 Multi-family
71 Penney Ln · Orono, ME
Flood risk 1/10 · Minimal
- FEMA flood zone
- X
- Chance of flooding over 30 yrs
- 0.0%
- Est. flood insurance / yr
- $507 – $1,088
Fire risk 3/10 · Minor
- Est. fire insurance / yr
- $669 – $1,243
Heat risk 3/10 · Minor
- Hot days now (above 91°F)
- 7 days/yr
- Hot days in 30 yrs
- 16 days/yr
Wind risk 6/10 · Moderate
- Chance of severe wind over 30 yrs
- 27.0%
Air-quality risk 1/10 · Minimal
- Unhealthy air days now
- 0 days/yr
- Unhealthy air days in 30 yrs
- 0 days/yr
Risk factors via First Street. Map © Google.
Why this score? — see what drove the C grade
The composite is a weighted blend of 9 inputs, each scored 0–100. Each bar is that input's sub-score; the figure is the points it added to the 100-point composite (weight × sub-score).
- Cash flow +15.0/30.0
- Appreciation +10.0/10.0
- ARV discount +7.5/15.0
- Schools +6.8/10.0
- 1% rule +5.0/10.0
- DSCR +5.0/10.0
- Livability +3.7/5.0
- Rent growth +2.5/5.0
- Condition / age +2.5/5.0
$38,999
🖨 Deal sheet (PDF) 📄 Offer letter ✓ Due diligence
Multi-family units
County records classify this as Multi-Family (2-4 Unit). Listing-text estimate: 1 unit. estimate disagrees with records
Listing remarks
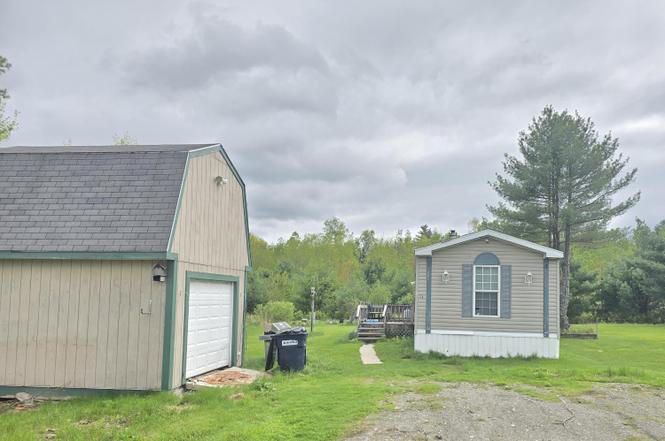
Escape to your own slice of paradise with this charming 3-bedroom, 2-bath Oakland Mobile home nestled in the serene Country Living Park of Bradley, Maine. Built in '96, this gem has been lovingly upgraded over the years. Picture yourself stretching out in your spacious lot, without the neighbors cramping your style! Plus, there's a cute prefab garage/shed—perfect for stashing your gear or creating your own little workshop.
Key facts
- Spacious lot
- Garage
- Built 1997
Tags
Neighborhood map
What this means for you Summary
Snapshot
- This is a 3-bed/2.0-bath multifamily listed at $39k.
Deal economics
- At list price, monthly cash flow is $1k ($13k/yr) — positive.
- The deal already cash-flows at list — no discount required.
- Meets the 1% rule at list price ($3k rent vs $39k).
- Recommended offer: $38k (3.0% below list) — sets the bar for market timing.
Location & tenants
- Location reads 73/100 on livability (#49 in ME) — a middle-class / working-renter tenant base. Strengths: crime A+, cost of living A+, health & safety A+; Watch: amenities F, commute F, employment F.
- RSU 34 (suburban): math 81% / reading 83% proficiency, ranked #80 of 112 in ME (top 71%) — strong family-tenant draw, lease renewals of 3-5y typical.
- Market conditions: 11 active listings in the ZIP; 3 comparable units currently listed for rent nearby; rentals lingering (median 45d on market — plan ~5-8 weeks vacancy on turnover, expect pricing pressure); 100% of comp listings sitting > 30 days — soft ceiling on asking rent; 440 units permitted in Penobscot County in 2024 (40 in 5+ unit buildings).
Forward outlook
- In year one you build about $4k of equity ($269 loan paydown + $4k appreciation (10.0% local appreciation)).
- Penobscot County population projected at -17% by 2050 — secular population decline; favor cash flow + early exit over multi-decade hold.
- At projected returns (10.0% appreciation + 3.0% rent growth), your $11k cash investment doubles in ~1 year — after that, you're playing with house money.
- By year 7, paydown + projected appreciation supports a ~$30k cash-out refi (75% LTV) — recoverable capital for the next deal without selling this one.
Negotiation context
- It's been on market 59 days — a 3% lower offer ($38k) is reasonable based on typical stale-listing flexibility.
Risks & watch-outs
- Watch-outs: HOA is 25% of rent.
- Climate carrying-cost: major wind risk, 27% chance of damaging wind over 30y — expect insurance premiums to compound above CPI over the hold.
Questions for the listing agent
- It's been on market 59 days. Have you received any prior offers? Is the seller open to a 3% concession, seller financing, or rate buy-down credit?
- What does the HOA fee cover, when was the last increase, and are there any pending special assessments or reserve-fund shortfalls?
- Is there a deadline driving the sale (1031 exchange, divorce, estate, relocation)? That informs how much negotiation room exists.
- Schools are B-rated — typically a magnet for longer-tenancy family renters. What's the average tenant stay here, and is there a school-zone premium baked into asking?
- What's the average days-on-market for RENTAL listings here right now (not sales)? A rising rental-DOM trend means longer vacancies and softer asking-rent achievability than the comps imply.
- What's the recent tenant-quality profile in this submarket — average credit score on applications, eviction rate, late-payment / NSF rate, and stable-employment percentage? A property-management company in the area should have these aggregated.
- How much new apartment / multifamily construction is in the pipeline within 1–3 miles? Heavy new supply (>2% of stock underway) typically softens rents 12–24 months out; light construction supports rent growth.
Investment metrics
- 1% rule
- 6.44% ✓
- Cap rate
- 39.35%
- Cash-on-cash
- 118.06%
- DSCR
- 6.25
- GRM
- 1.3
CMA / ARV
No comps found within radius.
Projected returns pro-forma
10.0% appreciation · 3.0% rent growth · sell at horizon
- IRR
- —
- Equity multiple
- 9.25×
- Total profit
- $90,096
- Equity at exit
- $35,133
- IRR
- —
- Equity multiple
- 20.45×
- Total profit
- $212,365
- Equity at exit
- $75,766
Cash invested: $10,920 (down + closing). Projections, not guarantees.
Landlord ↔ Tenant lean methodology
- Overall (STATE)
- 41 Moderately Tenant-Leaning
- State Maine
- 41 Moderately Tenant-Leaning · D+2
- County
- — inherits STATE
- City
- — inherits STATE
ZIP-level market 04411
- Home prices YoY
- 3.9%
- Active inventory
- 11
- Price-to-rent
- 1.3×
Monthly cashflow live
- Estimated rent
- $2,511 medium interval (Pro) →
- Mortgage (P&I)
- −$205
- Tax from tax record
- −$54 /mo · $642/yr
- Insurance
- −$16
- HOA
- −$635
- Vacancy / Maint / Mgmt
- −$527
- Net cashflow
- $1,074
Break-even live
Sensitivity live
| Price | -10% $1,096 | -5% $1,085 | +0% $1,074 | +5% $1,063 | +10% $1,052 |
|---|---|---|---|---|---|
| Rent | -10% $876 | -5% $975 | +0% $1,074 | +5% $1,174 | +10% $1,273 |
| Rate | -1.0pp $1,094 | -0.5pp $1,084 | base $1,074 | +0.5pp $1,064 | +1.0pp $1,054 |
UW: 25.0% down · 7.5% · 30yr · 1.5% tax · 5.0% vac · 8.0% maint · 8.0% mgmt
Financing live
Cash to close
- Down payment
- $9,750
- Closing costs
- $1,170
- Reserves months
- —
- Total cash needed
- —
Loan-product check · same deal, 3 products live
Conventional
25% down · 7.5% · 30yr
- Down + closing
- —
- Monthly P&I
- —
- Monthly cashflow
- —
- DSCR
- —
- Eligible?
- —
Personal DTI + credit; lowest rate.
DSCR
20% down · 8.5% · 30yr
- Down + closing
- —
- Monthly P&I
- —
- Monthly cashflow
- —
- DSCR
- —
- Eligible?
- —
No personal income docs; deal must DSCR.
Hard money
10% down · 12.0% · 12mo
- Down + closing
- —
- Monthly P&I
- —
- Monthly cashflow
- —
- DSCR
- —
- Eligible?
- —
Short-term bridge; refi at stabilization.
Rent comps 3 comps
| Address | Beds | Baths | Sqft | Rent | $/sqft | DOM | Units | Dist |
|---|---|---|---|---|---|---|---|---|
| 74 Mill St Orono, ME | 1.0–3.0 | 1.0–2.0 | 886 | $2,650 | $2.99 | 44d | 8 | 1.04mi |
| 295 Main St Orono, ME | 4.0 | 2.0 | 1200 | $3,100 | $2.58 | 44d | 1 | 1.37mi |
| 95 Park St Orono, ME | 2.0 | 1.0 | 850 | $1,650 | $1.94 | 44d | 1 | 1.40mi |
HOA detail
- Monthly dues
- $635 · $7,620/yr
Listing history 5 events
-
2025-07-24status Pending
-
2025-07-17price $38,999
-
2025-07-07price $43,999
-
2025-06-16price $49,999
-
2025-05-25$59,999 Active
ⓘ Source: listings_history table (triggers on properties + properties_extension) + one-shot
backfill from property_details.listing_events for pre-trigger history.
Tax reassessment forecast ME · Partial reset (capped growth)
- Current annual tax
- $642 · $54/mo
- Projected year-2 tax
- $642 · $54/mo
- Expected delta
- $0/yr ($0/mo · 0.0%)
ⓘ Screening estimate from a state-policy table — verify with the county assessor before closing.
Climate risk First Street
- Flood 1/10 Low FEMA zone X · 0% chance over 30 yrs
- Wildfire 3/10 Moderate
- Heat 3/10 Moderate 7 d/yr ≥91°F today · 16 d/yr by 30 yrs out
- Wind 6/10 Major 27% chance of damaging wind over 30 yrs
- Air quality 1/10 Low 0 unhealthy d/yr today · 0 by 30 yrs out
Nearby sold comps map
Loading sold comps map…
Walkable amenities ~0.75 mi
Loading nearby amenities…
Taxation est. · year 1
- Rental income
- $30,131
- − Mortgage interest
- −$2,185
- − Property taxes
- −$642
- − Insurance
- −$195
- − Repairs & maintenance
- −$2,410
- − Management
- −$2,410
- − HOA
- −$7,620
- − Depreciation
- −$1,135
- Taxable income
- $13,534
- Est. tax owed @ 24.0%
- −$3,248
- After-tax cash flow
- $9,644/yr
For passive investors: Depreciation is non-cash, so a rental often shows a tax loss while cash-flowing — sheltering income. Rental losses are passive: they offset passive income freely, and up to $25,000/yr can offset ordinary (W-2) income if you actively participate and your MAGI is under $100k (phasing out to $0 by $150k); unused losses carry forward. On sale, claimed depreciation is recaptured at up to 25%, and gains may owe capital-gains tax (a 1031 exchange can defer both). Figures are a year-1 estimate at your 24.0% rate — not tax advice; consult a CPA.
Schools (NCES district)
- District
- RSU 34
- NCES district ID
- 2314782
- Math proficiency
- 81% ▲ 48.00%
- Reading proficiency
- 83% ▲ 31.00%
- Median HH income
- $39,466
- Composite
- 68.31/100
- National rank
- #351
- State rank
- #80 of 112 in ME
Livability — Orono
- Score
- 73/100
- State rank
- #49
- US rank
- #5067
Category grades
Schools grade is shown separately in the Schools card above.
Census & demographics
- City population
- 8,371
- Population (ZIP)
- 1,561
Population outlook (Penobscot County) Hauer SSP2
- Today (2025)
- 149,928 people
- By 2030
- 146,386 · -2.4%
- By 2040
- 135,952 · -9.3%
- By 2050
- 123,864 · -17.4%
- By 2075
- 97,825 · -34.8%
- By 2100
- 77,196 · -48.5%
Race, ethnicity, and origin ACS 2023
- Neighborhood character
- Predominantly White (88%)
- Race & ethnicity
- White 88% Two or more races 6% Native American 3% Asian 2%
- Common ancestry
- Lithuanian 25% Slovak 3% Scotch-Irish 3%
- Foreign-born
- 2% · Canada, South Korea
- Languages at home
- 92% English-only · Other Asian/Pacific 3% Korean 1% French/Haitian/Cajun 1%
Political lean MEDSL · Penobscot
- 2024 margin
- R (+10.9) · D 43.6% · R 54.5% · Other 1.9%
- 2008→2024 swing
- -15.9pp toward R · 2008: 5.0pp · 2024: -10.9pp
- All cycles
- 2024: R+10.9 2020: R+8.3 2016: R+10.9 2012: D+2.9 2008: D+5.0
Not yet ingested
- Civics
- —
Market trends
- HPI YoY
- ▲ 11.15%
- Current HPI
- 298.3192
- Rent YoY
- —
- Metro
- —
- State GDP YoY
- —
- F500 in state
- 0
Price history
-35.0% since first listed5 events — show timeline
- 2025-07-24 Pending — MREIS
- 2025-07-17 Price Changed $38,999 MREIS
- 2025-07-07 Price Changed $43,999 MREIS
- 2025-06-16 Price Changed $49,999 MREIS
- 2025-05-25 Listed $59,999 MREIS
Property tax history
+3.8%/yrLatest (2025): $642 · +6.8% YoY. Source: county tax records.
Cash-flow waterfall
monthlySold comps — $/sqft
last 12 mo · ≤1 miLoading sold comps…