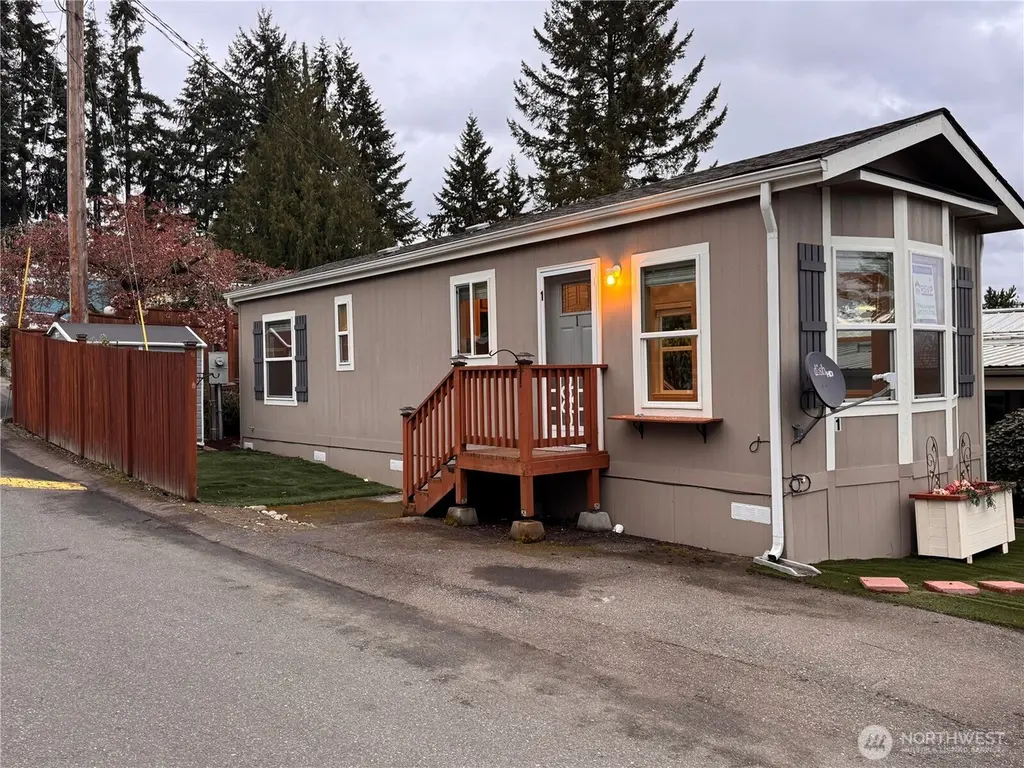
23708 Locust Way #1 · Bothell West, WA
Flood risk No data
- FEMA flood zone
- —
- Chance of flooding over 30 yrs
- —
- Est. flood insurance / yr
- —
Fire risk No data
- Est. fire insurance / yr
- —
Heat risk No data
- Hot days now (above threshold)
- —
- Hot days in 30 yrs
- —
Wind risk No data
- Chance of severe wind over 30 yrs
- —
Air-quality risk No data
- Unhealthy air days now
- —
- Unhealthy air days in 30 yrs
- —
Risk factors via First Street. Map © Google.
Why this score? — see what drove the B grade
The composite is a weighted blend of 9 inputs, each scored 0–100. Each bar is that input's sub-score; the figure is the points it added to the 100-point composite (weight × sub-score).
- Cash flow +30.0/30.0
- 1% rule +10.0/10.0
- DSCR +10.0/10.0
- ARV discount +7.6/15.0
- Schools +6.7/10.0
- Livability +4.5/5.0
- Rent growth +2.9/5.0
- Condition / age +2.5/5.0
- Appreciation +0.0/10.0
$94,900
🖨 Deal sheet 📄 Offer letter ✓ Due diligence
Listing remarks
Discover this well-maintained home in Bothell’s conveniently located Country Club Estates, an all-ages community—just minutes to Kenmore, Canyon Park, and the University of Washington. This beautifully maintained 2018 Fleetwood offers 560 sq ft with 1 bed and 1 bath, featuring fresh interior paint, beautiful wood cabinetry, and a bright south-facing bay window that fills the home with natural light. All appliances including washer/dryer stay. Turfed area ideal for pets and low-maintenance living. Enjoy the ease of a tiny home lifestyle—less upkeep, lower costs, and more freedom. Ideally positioned on a corner lot at the top of the hill and directly across from the clubhous
Key facts
- Clubhouse
- Turfed area
- Corner lot
Tags
Neighborhood map
What this means for you Summary
Snapshot
- This is a 1-bed/1.0-bath manufactured listed at $95k.
Deal economics
- At list price, monthly cash flow is $955 ($11k/yr) — positive.
- The deal already cash-flows at list — no discount required.
- Meets the 1% rule at list price ($2k rent vs $95k).
- Cap rate 18.4% vs local median 2.2% in Bothell West — top-decile yield for the area; either an underpriced asset or a hidden risk that comps aren't pricing in. Stress-test before assuming the spread holds.
Location & tenants
- Location reads 91/100 on livability (#2 in WA, #63 nationally) — a professional / high-income tenant draw. Strengths: schools A+, amenities A+, commute A+; Watch: cost of living F.
- Northshore School District (suburban): math 69% / reading 78% proficiency, ranked #9 of 291 in WA (top 3%) — strong family-tenant draw, lease renewals of 3-5y typical; only 12% free/reduced lunch — higher-income household profile.
- Market conditions: Rents rising (+1.8%/yr); 254 active listings in the ZIP; 3 comparable units currently listed for rent nearby; rentals leasing fast (median 3d on market — plan ~1-2 weeks tenant-placement turnaround); high-income renter base; 3,982 units permitted in Snohomish County in 2024 (1,492 in 5+ unit buildings).
- This rent is only 13% of the median local income ($184k/yr) — well below the 30% rent-burden line; pricing power to push rent on renewal without tenant pushback.
Forward outlook
- Local home prices are declining (-3.0%/yr); year-one equity from $656 of loan paydown is wiped out by about $3k of value loss. Plan a longer hold.
- Snohomish County population projected at +30% by 2050 — long-run rental-demand tailwind backs the buy-and-hold thesis.
- At projected returns (-3.0% appreciation + 1.8% rent growth), your $27k cash investment doubles in ~3 years — after that, you're playing with house money.
Negotiation context
- Only 3 days on market — expect competitive offers; lowballing is unlikely to land.
- 2 sale attempts since 6y ago with the ask held roughly flat each time — persistent listings suggest the price (not the market) is what's stuck; bring a comps-based counter.
- Current owner paid $70k; 36% above their basis — modest negotiation headroom, anchor on the comps not their cost.
Questions for the listing agent
- Is there a deadline driving the sale (1031 exchange, divorce, estate, relocation)? That informs how much negotiation room exists.
- Schools are A-rated — typically a magnet for longer-tenancy family renters. What's the average tenant stay here, and is there a school-zone premium baked into asking?
- What's the average days-on-market for RENTAL listings here right now (not sales)? A rising rental-DOM trend means longer vacancies and softer asking-rent achievability than the comps imply.
- What's the recent tenant-quality profile in this submarket — average credit score on applications, eviction rate, late-payment / NSF rate, and stable-employment percentage? A property-management company in the area should have these aggregated.
- How much new for-sale + rental construction is in the pipeline within 1–3 miles? Heavy new supply typically softens prices + rents 12–24 months out; constrained supply supports both.
Investment metrics
- 1% rule
- 2.07% ✓
- Cap rate
- 18.37%
- Cash-on-cash
- 43.12%
- DSCR
- 2.92
- GRM
- 4.0
CMA / ARV
- ARV (on-the-fly)
- $95,200
- Comps found
- 1
Show comp detail 1 sale within ~0.75 mi
| Address | Dist | Beds/Ba | Sqft | Sold | Price | $/sf | Match |
|---|---|---|---|---|---|---|---|
| 23708 Locust Way #1 | 0.00mi | 1/1.0 | 560 (0%) | 1mo | $94,950 | $170 | 99 |
Match score weights: distance 35% · size 25% · config 20% · recency 20%. Top-matched comps best support the ARV.
Projected returns pro-forma
-3.0% appreciation · 1.75% rent growth · sell at horizon
- IRR
- 38.6%
- Equity multiple
- 2.62×
- Total profit
- $42,983
- Equity at exit
- $14,150
- IRR
- 44.4%
- Equity multiple
- 4.99×
- Total profit
- $105,937
- Equity at exit
- $8,205
Cash invested: $26,572 (down + closing). Projections, not guarantees.
Landlord ↔ Tenant lean methodology
- Overall (STATE)
- 28 Tenant-Leaning
- State Washington
- 28 Tenant-Leaning · D+8
- County
- — inherits STATE
- City
- — inherits STATE
ZIP-level market 98021
- Rents YoY
- 1.8%
- Active inventory
- 254
- Price-to-rent
- 4.0×
Monthly cashflow live
- Estimated rent
- $1,964 medium interval (Pro) →
- Mortgage (P&I)
- −$498
- Tax from tax record
- −$60 /mo · $715/yr
- Insurance
- −$40
- HOA
- −$0
- Vacancy / Maint / Mgmt
- −$412
- Net cashflow
- $955
Break-even live
UW: 25.0% down · 7.5% · 30yr · 1.5% tax · 5.0% vac · 8.0% maint · 8.0% mgmt
Financing live
Cash to close
- Down payment
- $23,725
- Closing costs
- $2,847
- Reserves months
- —
- Total cash needed
- —
Loan-product check · same deal, 3 products live
Conventional
25% down · 7.5% · 30yr
- Down + closing
- —
- Monthly P&I
- —
- Monthly cashflow
- —
- DSCR
- —
- Eligible?
- —
Personal DTI + credit; lowest rate.
DSCR
20% down · 8.5% · 30yr
- Down + closing
- —
- Monthly P&I
- —
- Monthly cashflow
- —
- DSCR
- —
- Eligible?
- —
No personal income docs; deal must DSCR.
Hard money
10% down · 12.0% · 12mo
- Down + closing
- —
- Monthly P&I
- —
- Monthly cashflow
- —
- DSCR
- —
- Eligible?
- —
Short-term bridge; refi at stabilization.
Rent comps 3 comps
| Address | Beds | Baths | Sqft | Rent | $/sqft | DOM | Units | Dist |
|---|---|---|---|---|---|---|---|---|
| 18930 68th Ave NE Kenmore, WA | 1.0–2.0 | 1.0–2.0 | 799 | $1,927 | $2.41 | 2d | 6 | 1.22mi |
| 4208 236th St SW Mountlake Terrace, WA | 1.0–3.0 | 1.0–2.0 | 926 | $1,825 | $1.97 | 2d | 26 | 1.42mi |
| 6711 NE 182nd St Kenmore, WA | 1.0–2.0 | 1.0–2.0 | 899 | $1,737 | $1.93 | 3d | 10 | 1.50mi |
Listing history 7 events
-
2026-04-20status Pending
-
2026-04-16$94,900 Active
-
2020-09-04soldstatus $69,950 Sold
-
2020-08-19status Pending
-
2020-08-04$69,950 Active
-
1988-06-03soldstatus $2,497,650
-
1983-10-04soldstatus $1,590,000
ⓘ Source: listings_history table (triggers on properties + properties_extension) + one-shot
backfill from property_details.listing_events for pre-trigger history.
Tax reassessment forecast WA · Resets to sale price
- Current annual tax
- $715 · $60/mo
- Projected year-2 tax
- $930 · $78/mo
- Expected delta
- +$215/yr (+$18/mo · 30.1%)
ⓘ Screening estimate from a state-policy table — verify with the county assessor before closing.
Nearby sold comps map
Loading sold comps map…
Walkable amenities ~0.75 mi
Loading nearby amenities…
Taxation est. · year 1
- Rental income
- $23,567
- − Mortgage interest
- −$5,316
- − Property taxes
- −$715
- − Insurance
- −$474
- − Repairs & maintenance
- −$1,885
- − Management
- −$1,885
- − Depreciation
- −$2,761
- Taxable income
- $10,530
- Est. tax owed @ 24.0%
- −$2,527
- After-tax cash flow
- $8,929/yr
For passive investors: Depreciation is non-cash, so a rental often shows a tax loss while cash-flowing — sheltering income. Rental losses are passive: they offset passive income freely, and up to $25,000/yr can offset ordinary (W-2) income if you actively participate and your MAGI is under $100k (phasing out to $0 by $150k); unused losses carry forward. On sale, claimed depreciation is recaptured at up to 25%, and gains may owe capital-gains tax (a 1031 exchange can defer both). Figures are a year-1 estimate at your 24.0% rate — not tax advice; consult a CPA.
Schools (NCES district)
- District
- Northshore School District
- NCES district ID
- 5305910
- Math proficiency
- 69% ▼ -3.00%
- Reading proficiency
- 78% ▼ -1.00%
- Median HH income
- $92,951
- Composite
- 67.41/100
- National rank
- #826
- State rank
- #9 of 291 in WA
Livability — Bothell West
- Score
- 91/100
- State rank
- #2
- US rank
- #63
Category grades
Schools grade is shown separately in the Schools card above.
Census & demographics
- Census place
- Bothell West, WA
- County
- Snohomish County · 786,756 people
- Metro
- Seattle-Tacoma-Bellevue, WA
- Population (ZIP)
- 35,631
- Household income
- $183,786
- Rent vs Own
- Severe rent burden
- 413.0
Population outlook (Snohomish County) Hauer SSP2
- Today (2025)
- 899,800 people
- By 2030
- 960,975 · +6.8%
- By 2040
- 1,074,447 · +19.4%
- By 2050
- 1,171,954 · +30.2%
- By 2075
- 1,384,849 · +53.9%
- By 2100
- 1,497,296 · +66.4%
Race, ethnicity, and origin ACS 2023
- Neighborhood character
- Diverse neighborhood (Simpson 0.61)
- Race & ethnicity
- White 55% Asian 29% Two or more races 9% Hispanic / Latino 9% Black 1%
- Hispanic origin (detail)
- Mexican 6%
- Common ancestry
- Portuguese 4% Italian 3% Lithuanian 2%
- Foreign-born
- 29% · China, Canada, South Korea
- Languages at home
- 65% English-only · Other Indo-European 11% Other Asian/Pacific 6% Chinese 6%
Political lean MEDSL · Snohomish
- 2024 margin
- D (+19.0) · D 57.8% · R 38.9% · Other 3.3%
- 2008→2024 swing
- +0.1pp no change · 2008: 18.9pp · 2024: 19.0pp
- All cycles
- 2024: D+19.0 2020: D+20.6 2016: D+16.6 2012: D+16.2 2008: D+18.9
Not yet ingested
- Civics
- —
Market trends
- HPI YoY
- ▼ -903.22%
- Current HPI
- 380.5475
- Rent YoY
- ▲ 1.75%
- Metro
- Seattle-Tacoma-Bellevue, WA
- State GDP YoY
- ▲ 4.65%
- F500 in state
- 22
Industry mix (Fortune 500 HQ in WA)
| Industry | F500 HQs | Revenue |
|---|---|---|
| Retail | 2 | $269B |
|
||
| Technology / Retail | 1 | $638B |
|
||
| Technology | 1 | $245B |
|
||
| Telecommunications | 1 | $38B |
|
||
| Food / Beverage | 1 | $36B |
|
||
| Automotive / Trucks | 1 | $34B |
|
||
Price history
-94.0% since first listed7 events — show timeline
- 2026-04-20 Pending — NWMLS as Distributed by MLS Grid
- 2026-04-16 Listed $94,900 NWMLS as Distributed by MLS Grid
- 2020-09-04 Sold (MLS) $69,950 NWMLS as Distributed by MLS Grid
- 2020-08-19 Pending — NWMLS as Distributed by MLS Grid
- 2020-08-04 Listed $69,950 NWMLS as Distributed by MLS Grid
- 1988-06-03 Sold (Public Records) $2,497,650 Public Records
- 1983-10-04 Sold (Public Records) $1,590,000 Public Records
Property tax history
+26.2%/yrLatest (2026): $715 · -0.0% YoY. Source: county tax records.
Cash-flow waterfall
monthlySold comps — $/sqft
last 12 mo · ≤1 miLoading sold comps…