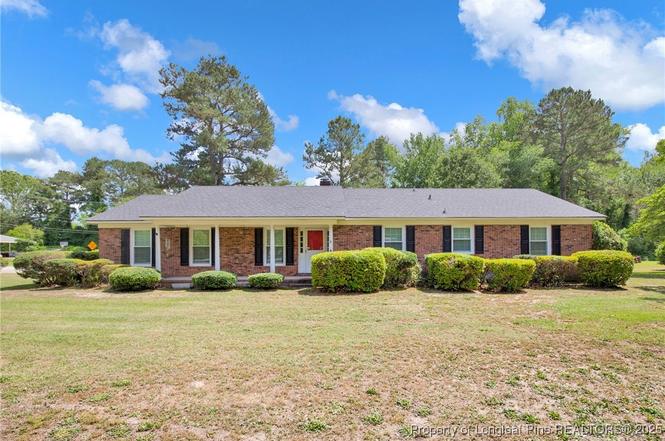
500 Cecil St · Vander, NC
Flood risk 1/10 · Minimal
- FEMA flood zone
- X (unshaded)
- Chance of flooding over 30 yrs
- 0.0%
- Est. flood insurance / yr
- $507 – $1,088
Fire risk 5/10 · Moderate
- Est. fire insurance / yr
- $906 – $1,684
Heat risk 7/10 · Major
- Hot days now (above 106°F)
- 7 days/yr
- Hot days in 30 yrs
- 16 days/yr
Wind risk 7/10 · Major
- Chance of severe wind over 30 yrs
- 75.0%
Air-quality risk 1/10 · Minimal
- Unhealthy air days now
- 0 days/yr
- Unhealthy air days in 30 yrs
- 0 days/yr
Risk factors via First Street. Map © Google.
Why this score? — see what drove the D grade
The composite is a weighted blend of 9 inputs, each scored 0–100. Each bar is that input's sub-score; the figure is the points it added to the 100-point composite (weight × sub-score).
- Appreciation +10.0/10.0
- Cash flow +8.9/30.0
- ARV discount +6.2/15.0
- Schools +3.1/10.0
- Livability +2.8/5.0
- DSCR +2.5/10.0
- Rent growth +2.5/5.0
- Condition / age +2.5/5.0
- 1% rule +1.8/10.0
$269,000
🖨 Deal sheet (PDF) 📄 Offer letter ✓ Due diligence
Listing remarks
New Updated Primary Bathroom, New Carpet, New Interior Paint, New LVP in Kitchen, New Windows!! $5000 in Seller Concessions to use as you choose. .. rate buy down, closing costs, upgrades, you pick. Check out the beautiful brick ranch on almost an acre of land. This 4-bedroom, 3 full bath home has plenty of space for a growing family. There are 2 living areas and a formal dining room. The backyard is spacious with lots of room to create your own backyard oasis. Don't miss out on making this home your very own.
Key facts
- Formal dining room
- Spacious backyard
- 2 living areas
Tags
Property features AI
Finance
- Other: Corner lot approximately 0.9 acre
- HOA & community: Curbs in the community
Exterior
- Parking: Attached carport; 2 covered spaces; 2 carport spaces
- Utilities: Water from spring and well; Holding tank and septic sewer
- Home design: Single-family residence; Residential property
- Construction: Brick veneer construction
- Exterior features: Covered porch; Covered patio; Storm door(s); Corner lot; Cleared lot
Interior
- Kitchen: Refrigerator; Cooktop; Dishwasher
- Bedrooms: Total rooms: 6
- Flooring: Carpet; Hardwood; Vinyl
- Bathrooms: 3 full bathrooms
- Heating & cooling: Heat pump heating; Central air; Ceiling fans
- Interior features: Ceiling fans; Eat-in kitchen; Storm windows; Wood-burning stove fireplace
- Laundry & utility: Washer hookup on main level; Crawl space basement
Neighborhood map
What this means for you Summary
Snapshot
- This is a 3-bed/4.0-bath single-family listed at $269k.
Deal economics
- At list price, monthly cash flow is $-218 ($-3k/yr) — negative.
- To cash-flow at today's rent, offer at most $231k (14.3% below list).
- To meet the 1% rule (rent ≥ 1% of price), the offer needs to be $183k (31.9% below list).
- Recommended offer: $183k (31.9% below list) — sets the bar for 1% rule.
- Cap rate 5.3% vs local median 3.8% in Vander — top-decile yield for the area; either an underpriced asset or a hidden risk that comps aren't pricing in. Stress-test before assuming the spread holds.
Location & tenants
- Location reads 55/100 on livability (#645 in NC) — a working-class tenant base; expect higher turnover. Strengths: cost of living A+, crime A, employment B+; Watch: amenities F, commute F, housing F.
- Cumberland County Schools (urban): math 32% / reading 41% proficiency, ranked #126 of 178 in NC (top 71%) — families likely to look elsewhere, expect single-tenant / working-renter base with shorter leases.
- Zoned schools: Sunnyside Elementary (math 17% / reading 32%, grade F, #1,112 of 1,410 statewide, top 82%, 333 students, 99% FRL); Mac Williams Middle (math 40% / reading 50%, grade D, #160 of 475 statewide, top 35%, 1,151 students, 58% FRL); Cape Fear High (math 75% / reading 47%, grade C+, #202 of 535 statewide, top 39%, 1,529 students, 50% FRL).
- Market conditions: 223 active listings in the ZIP; 1,125 units permitted in Cumberland County in 2024 (104 in 5+ unit buildings).
Forward outlook
- In year one you build about $29k of equity ($2k loan paydown + $27k appreciation (10.0% local appreciation)).
- By year 2, paydown + projected appreciation supports a ~$46k cash-out refi (75% LTV) — recoverable capital for the next deal without selling this one.
Negotiation context
- It's been on market 322 days — a 12% lower offer ($237k) is reasonable based on typical stale-listing flexibility.
- 2 sale attempts with the ask held roughly flat each time — persistent listings suggest the price (not the market) is what's stuck; bring a comps-based counter.
- Current owner paid $152k; list at $269k implies a 77% gain — meaningful room to come down on a strong offer.
Risks & watch-outs
- Climate carrying-cost: major wind risk, 75% chance of damaging wind over 30y; moderate wildfire risk; extreme-heat days projected 7→16/yr by 2055 (HVAC capex compounding) — expect insurance premiums to compound above CPI over the hold.
Questions for the listing agent
- What do current leases actually rent for vs. the listed asking? Can we see a recent rent roll and the last 12 months of T-12 income?
- It's been on market 322 days. Have you received any prior offers? Is the seller open to a 32% concession, seller financing, or rate buy-down credit?
- Built in 1967 — when were the roof, HVAC, electrical panel, plumbing, and water heater last replaced?
- Why hasn't it sold? Are there any deal-killer items the seller is aware of (foundation, flood, title, zoning, code violations)?
- Is there a deadline driving the sale (1031 exchange, divorce, estate, relocation)? That informs how much negotiation room exists.
- Schools are F-rated, which usually means shorter tenancies and higher turnover. Who's the typical renter profile here, and what's been the actual vacancy rate?
- The area grade is low — what's the realistic commute time and amenity access for the typical tenant pool here? Any planned neighborhood developments (good or bad) we should know about?
- What's the average days-on-market for RENTAL listings here right now (not sales)? A rising rental-DOM trend means longer vacancies and softer asking-rent achievability than the comps imply.
- What's the recent tenant-quality profile in this submarket — average credit score on applications, eviction rate, late-payment / NSF rate, and stable-employment percentage? A property-management company in the area should have these aggregated.
- How much new for-sale + rental construction is in the pipeline within 1–3 miles? Heavy new supply typically softens prices + rents 12–24 months out; constrained supply supports both.
Investment metrics
- 1% rule
- 0.68% ✗
- Cap rate
- 5.32%
- Cash-on-cash
- -3.47%
- DSCR
- 0.85
- GRM
- 12.2
CMA / ARV
- ARV (on-the-fly)
- $261,500
- Comps found
- 1
Show comp detail 1 sale within ~0.75 mi
| Address | Dist | Beds/Ba | Sqft | Sold | Price | $/sf | Match |
|---|---|---|---|---|---|---|---|
| 500 Cecil St | 0.00mi | 4/3.0 (+1) | 2,086 (-0%) | 0mo | $260,000 | $125 | 90 |
Match score weights: distance 35% · size 25% · config 20% · recency 20%. Top-matched comps best support the ARV.
Projected returns pro-forma
10.0% appreciation · 3.0% rent growth · sell at horizon
- IRR
- 21.8%
- Equity multiple
- 2.76×
- Total profit
- $132,541
- Equity at exit
- $242,337
- IRR
- 19.6%
- Equity multiple
- 6.32×
- Total profit
- $401,040
- Equity at exit
- $522,608
Cash invested: $75,320 (down + closing). Projections, not guarantees.
Landlord ↔ Tenant lean methodology
- Overall (STATE)
- 85 Strongly Landlord-Friendly
- State North Carolina
- 85 Strongly Landlord-Friendly · R+3
- County
- — inherits STATE
- City
- — inherits STATE
ZIP-level market 28312
- Home prices YoY
- 6.9%
- Active inventory
- 223
- Price-to-rent
- 12.2×
Monthly cashflow live
- Estimated rent
- $1,833 medium interval (Pro) →
- Mortgage (P&I)
- −$1,411
- Tax from tax record
- −$143 /mo · $1,715/yr
- Insurance
- −$112
- HOA
- −$0
- Vacancy / Maint / Mgmt
- −$385
- Net cashflow
- $-218
Break-even live
Sensitivity live
| Price | -10% $-66 | -5% $-142 | +0% $-218 | +5% $-294 | +10% $-370 |
|---|---|---|---|---|---|
| Rent | -10% $-363 | -5% $-290 | +0% $-218 | +5% $-145 | +10% $-73 |
| Rate | -1.0pp $-82 | -0.5pp $-149 | base $-218 | +0.5pp $-288 | +1.0pp $-358 |
UW: 25.0% down · 7.5% · 30yr · 1.5% tax · 5.0% vac · 8.0% maint · 8.0% mgmt
Financing live
Cash to close
- Down payment
- $67,250
- Closing costs
- $8,070
- Reserves months
- —
- Total cash needed
- —
Loan-product check · same deal, 3 products live
Conventional
25% down · 7.5% · 30yr
- Down + closing
- —
- Monthly P&I
- —
- Monthly cashflow
- —
- DSCR
- —
- Eligible?
- —
Personal DTI + credit; lowest rate.
DSCR
20% down · 8.5% · 30yr
- Down + closing
- —
- Monthly P&I
- —
- Monthly cashflow
- —
- DSCR
- —
- Eligible?
- —
No personal income docs; deal must DSCR.
Hard money
10% down · 12.0% · 12mo
- Down + closing
- —
- Monthly P&I
- —
- Monthly cashflow
- —
- DSCR
- —
- Eligible?
- —
Short-term bridge; refi at stabilization.
Listing history 6 events
-
2026-05-20status Pending
-
2026-04-20status Active
-
2026-03-17status Pending
-
2025-09-19price $269,000
-
2025-05-23$279,000 Active
-
2009-07-23soldstatus $152,000
ⓘ Source: listings_history table (triggers on properties + properties_extension) + one-shot
backfill from property_details.listing_events for pre-trigger history.
Tax reassessment forecast NC · Resets to sale price
- Current annual tax
- $1,715 · $143/mo
- Projected year-2 tax
- $2,206 · $184/mo
- Expected delta
- +$491/yr (+$41/mo · 28.6%)
ⓘ Screening estimate from a state-policy table — verify with the county assessor before closing.
Climate risk First Street
- Flood 1/10 Low FEMA zone X (unshaded) · 0% chance over 30 yrs
- Wildfire 5/10 Major
- Heat 7/10 Severe 7 d/yr ≥106°F today · 16 d/yr by 30 yrs out
- Wind 7/10 Severe 75% chance of damaging wind over 30 yrs
- Air quality 1/10 Low 0 unhealthy d/yr today · 0 by 30 yrs out
Nearby sold comps map
Loading sold comps map…
Walkable amenities ~0.75 mi
Loading nearby amenities…
Taxation est. · year 1
- Rental income
- $21,992
- − Mortgage interest
- −$15,068
- − Property taxes
- −$1,715
- − Insurance
- −$1,345
- − Repairs & maintenance
- −$1,759
- − Management
- −$1,759
- − Depreciation
- −$7,825
- Taxable loss
- −$7,480
- Est. tax savings @ 24.0%
- +$1,795
- After-tax cash flow
- $-819/yr
For passive investors: Depreciation is non-cash, so a rental often shows a tax loss while cash-flowing — sheltering income. Rental losses are passive: they offset passive income freely, and up to $25,000/yr can offset ordinary (W-2) income if you actively participate and your MAGI is under $100k (phasing out to $0 by $150k); unused losses carry forward. On sale, claimed depreciation is recaptured at up to 25%, and gains may owe capital-gains tax (a 1031 exchange can defer both). Figures are a year-1 estimate at your 24.0% rate — not tax advice; consult a CPA.
Schools (NCES district)
- District
- Cumberland County Schools
- NCES district ID
- 3700011
- Math proficiency
- 32% ▼ -2.00%
- Reading proficiency
- 41% ▼ -1.00%
- Median HH income
- $44,168
- Composite
- 31.0/100
- National rank
- #6096
- State rank
- #126 of 178 in NC
Livability — Vander
- Score
- 55/100
- State rank
- #645
- US rank
- #23450
Category grades
Schools grade is shown separately in the Schools card above.
Census & demographics
- Census place
- Vander, NC
- Population (ZIP)
- 19,889
Population outlook (Cumberland County) Hauer SSP2
- Today (2025)
- 330,855 people
- By 2030
- 333,523 · +0.8%
- By 2040
- 335,583 · +1.4%
- By 2050
- 335,325 · +1.4%
- By 2075
- 342,853 · +3.6%
- By 2100
- 340,698 · +3.0%
Race, ethnicity, and origin ACS 2023
- Neighborhood character
- Diverse neighborhood (Simpson 0.61)
- Race & ethnicity
- White 55% Black 29% Two or more races 8% Hispanic / Latino 8% Native American 2%
- Hispanic origin (detail)
- Mexican 4% Puerto Rican 2%
- Common ancestry
- Slovak 3% Serbian 2% Italian 2%
- Foreign-born
- 4% · Canada
- Languages at home
- 93% English-only · Spanish 5% French/Haitian/Cajun 1%
Political lean MEDSL · Cumberland
- 2024 margin
- D (+13.4) · D 56.1% · R 42.7% · Other 1.2%
- 2008→2024 swing
- -4.3pp toward R · 2008: 17.7pp · 2024: 13.4pp
- All cycles
- 2024: D+13.4 2020: D+16.6 2016: D+16.0 2012: D+19.7 2008: D+17.7
Not yet ingested
- Civics
- —
Market trends
- HPI YoY
- ▲ 19.75%
- Current HPI
- 306.7749
- Rent YoY
- —
- Metro
- —
- State GDP YoY
- ▲ 3.28%
- F500 in state
- 26
Industry mix (Fortune 500 HQ in NC)
| Industry | F500 HQs | Revenue |
|---|---|---|
| Financial Services | 2 | $213B |
|
||
| Retail | 2 | $95B |
|
||
| Industrial Conglomerate | 1 | $38B |
|
||
| Metals / Steel | 1 | $35B |
|
||
| Utilities | 1 | $30B |
|
||
| Industrial Machinery | 1 | $19B |
|
||
Price history
+77.0% since first listed6 events — show timeline
- 2026-05-20 Pending — LPRMLS
- 2026-04-20 Relisted — LPRMLS
- 2026-03-17 Pending — LPRMLS
- 2025-09-19 Price Changed $269,000 LPRMLS
- 2025-05-23 Listed $279,000 LPRMLS
- 2009-07-23 Sold (Public Records) $152,000 Public Records
Property tax history
+3.2%/yrLatest (2025): $1,715 · +28.6% YoY. Source: county tax records.
Cash-flow waterfall
monthlySold comps — $/sqft
last 12 mo · ≤1 miLoading sold comps…