 🌊 Lakefront
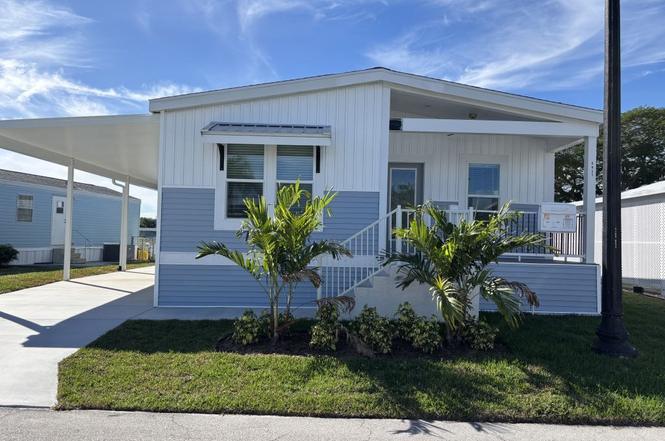
6951 41st Ave N #859 · Riviera Beach, FL
Flood risk 1/10 · Minimal
- FEMA flood zone
- X (unshaded)
- Chance of flooding over 30 yrs
- 0.0%
- Est. flood insurance / yr
- $507 – $1,088
Fire risk 2/10 · Minimal
- Est. fire insurance / yr
- $947 – $1,759
Heat risk 10/10 · Severe
- Hot days now (above 106°F)
- 7 days/yr
- Hot days in 30 yrs
- 24 days/yr
Wind risk 10/10 · Severe
- Chance of severe wind over 30 yrs
- 99.0%
Air-quality risk 2/10 · Minimal
- Unhealthy air days now
- 0 days/yr
- Unhealthy air days in 30 yrs
- 1 days/yr
Risk factors via First Street. Map © Google.
Why this score? — see what drove the B- grade
The composite is a weighted blend of 9 inputs, each scored 0–100. Each bar is that input's sub-score; the figure is the points it added to the 100-point composite (weight × sub-score).
- Cash flow +30.0/30.0
- 1% rule +10.0/10.0
- DSCR +10.0/10.0
- ARV discount +7.5/15.0
- Schools +4.3/10.0
- Livability +3.4/5.0
- Condition / age +2.5/5.0
- Rent growth +2.3/5.0
- Appreciation +0.0/10.0
$196,000
🖨 Deal sheet 📄 Offer letter ✓ Due diligence
Listing remarks
55+ age qualified community. BRAND NEW WEST PALM HOME! We work with multiple lenders to provide financing options. Inquire today to learn how to purchase with as little as 5% down! Additionally, sign a purchase agreement today and receive FREE LOT RENT September 1, 2026! Welcome to Palm Lake Estates, a 55+ age-qualified vibrant and active community where your dream home becomes reality. This 2025 3-bedroom, 2-bath home offers 1,564.8 sq. ft. of thoughtfully designed living space. Located near Riviera Beach, it perfectly combines modern conveniences with timeless style. Step inside to discover an open-concept layout filled with natural light, high ceilings, and quality finishes. The adje
Key facts
- Built 2025
- Listed 294 days
Property features AI
Finance
- Financial info: Listing price $196,000
Exterior
- Home design: Raleigh floorplan; Spec inventory home
- Construction: New construction
- Exterior features: Rear porch (per plan)
Interior
- Bedrooms: 3 bedrooms
- Bathrooms: 2 full bathrooms
- Interior features: Spec home (Raleigh w/ Rear Porch plan)
Neighborhood map
What this means for you Summary
Snapshot
- This is a 3-bed/2.0-bath manufactured listed at $196k.
Deal economics
- At list price, monthly cash flow is $1k ($13k/yr) — positive.
- The deal already cash-flows at list — no discount required.
- Meets the 1% rule at list price ($3k rent vs $196k).
- Recommended offer: $172k (12.0% below list) — sets the bar for market timing.
Location & tenants
- Location reads 67/100 on livability (#581 in FL) — a middle-class / working-renter tenant base. Strengths: housing A+, health & safety A+, cost of living A-; Watch: employment D, crime F, amenities F.
- Palm Beach (suburban): math 46% / reading 53% proficiency, ranked #34 of 73 in FL (top 47%) — families likely to look elsewhere, expect single-tenant / working-renter base with shorter leases.
- Market conditions: Rents soft (-0.7%/yr); 506 active listings in the ZIP; 11 comparable units currently listed for rent nearby; rentals at typical pace (median 25d on market — plan ~3-4 weeks tenant-placement turnaround); 3,974 units permitted in Palm Beach County in 2024 (1,012 in 5+ unit buildings).
- At $3,116/mo this rent would consume 57% of the median local household income ($65k/yr) (locally 1838% of renters already pay >50% of income on rent) — very limited rent-growth headroom before tenants either downsize or default.
Forward outlook
- Local home prices are declining (-3.0%/yr); year-one equity from $1k of loan paydown is wiped out by about $6k of value loss. Plan a longer hold.
- Palm Beach County population projected at +30% by 2050 — long-run rental-demand tailwind backs the buy-and-hold thesis.
- At projected returns (-3.0% appreciation + 0.0% rent growth), your $55k cash investment doubles in ~6 years — after that, you're playing with house money.
Negotiation context
- It's been on market 295 days — a 12% lower offer ($172k) is reasonable based on typical stale-listing flexibility.
Risks & watch-outs
- Climate carrying-cost: severe wind risk, 99% chance of damaging wind over 30y; extreme-heat days projected 7→24/yr by 2055 (HVAC capex compounding) — expect insurance premiums to compound above CPI over the hold.
Questions for the listing agent
- It's been on market 295 days. Have you received any prior offers? Is the seller open to a 12% concession, seller financing, or rate buy-down credit?
- Why hasn't it sold? Are there any deal-killer items the seller is aware of (foundation, flood, title, zoning, code violations)?
- Is there a deadline driving the sale (1031 exchange, divorce, estate, relocation)? That informs how much negotiation room exists.
- Crime grade is F in this area — have there been break-ins, vandalism, or insurance claims at this property in the last 3 years? What carrier currently insures it and at what premium?
- This sits on a lake — are riparian / water-frontage rights deeded with the parcel? Any dock permits, shoreline easements, or HOA water-use restrictions?
- What's the documented flood / surge / shoreline-erosion history here (FEMA AND non-FEMA — e.g., storm surge, creek backup, septic-field saturation)?
- Any water-quality or seasonal algae-bloom issues that affect tenant satisfaction or short-term-rental demand?
- What's the average days-on-market for RENTAL listings here right now (not sales)? A rising rental-DOM trend means longer vacancies and softer asking-rent achievability than the comps imply.
- What's the recent tenant-quality profile in this submarket — average credit score on applications, eviction rate, late-payment / NSF rate, and stable-employment percentage? A property-management company in the area should have these aggregated.
- How much new for-sale + rental construction is in the pipeline within 1–3 miles? Heavy new supply typically softens prices + rents 12–24 months out; constrained supply supports both.
Investment metrics
- 1% rule
- 1.59% ✓
- Cap rate
- 13.07%
- Cash-on-cash
- 24.21%
- DSCR
- 2.08
- GRM
- 5.2
CMA / ARV
No comps found within radius.
Projected returns pro-forma
-3.0% appreciation · 0.0% rent growth · sell at horizon
- IRR
- 14.0%
- Equity multiple
- 1.54×
- Total profit
- $29,667
- Equity at exit
- $29,224
- IRR
- 20.4%
- Equity multiple
- 2.49×
- Total profit
- $81,529
- Equity at exit
- $16,946
Cash invested: $54,880 (down + closing). Projections, not guarantees.
Landlord ↔ Tenant lean methodology
- Overall (STATE)
- 87 Strongly Landlord-Friendly
- State Florida
- 87 Strongly Landlord-Friendly · R+3
- County
- — inherits STATE
- City
- — inherits STATE
ZIP-level market 33404
- Home prices YoY
- -31.1%
- Rents YoY
- -0.7%
- Active inventory
- 506
- Price-to-rent
- 5.2×
Monthly cashflow live
- Estimated rent
- $3,116 high interval (Pro) →
- Mortgage (P&I)
- −$1,028
- Tax est. 1.5%
- −$245 /mo · $2,940/yr
- Insurance
- −$82
- HOA
- −$0
- Vacancy / Maint / Mgmt
- −$654
- Net cashflow
- $1,107
Break-even live
UW: 25.0% down · 7.5% · 30yr · 1.5% tax · 5.0% vac · 8.0% maint · 8.0% mgmt
Financing live
Cash to close
- Down payment
- $49,000
- Closing costs
- $5,880
- Reserves months
- —
- Total cash needed
- —
Loan-product check · same deal, 3 products live
Conventional
25% down · 7.5% · 30yr
- Down + closing
- —
- Monthly P&I
- —
- Monthly cashflow
- —
- DSCR
- —
- Eligible?
- —
Personal DTI + credit; lowest rate.
DSCR
20% down · 8.5% · 30yr
- Down + closing
- —
- Monthly P&I
- —
- Monthly cashflow
- —
- DSCR
- —
- Eligible?
- —
No personal income docs; deal must DSCR.
Hard money
10% down · 12.0% · 12mo
- Down + closing
- —
- Monthly P&I
- —
- Monthly cashflow
- —
- DSCR
- —
- Eligible?
- —
Short-term bridge; refi at stabilization.
Rent comps 11 comps
| Address | Beds | Baths | Sqft | Rent | $/sqft | DOM | Units | Dist |
|---|---|---|---|---|---|---|---|---|
| 2022 Oysterwood Ln Riviera Beach, FL | 3.0 | 3.5 | 1714 | $2,900 | $1.69 | 24d | 1 | 0.59mi |
| 2004 Sugar Maple Dr Riviera Beach, FL | 4.0 | 2.5 | 1861 | $2,995 | $1.61 | 14d | 1 | 0.64mi |
| 3016 King Palm Way Riviera Beach, FL | 3.0 | 2.5 | 1853 | $3,800 | $2.05 | 24d | 1 | 0.69mi |
| 6013 Woods Edge Cir Fl 33410 Riviera Beach, FL | 3.0 | 2.5 | 1897 | $3,000 | $1.58 | 24d | 1 | 0.80mi |
| 4408 Hemlock Dr Riviera Beach, FL | 4.0 | 2.5 | 1861 | $3,200 | $1.72 | 21d | 1 | 0.81mi |
| 4216 Leo Ln Unit 5G Riviera Beach, FL | 4.0 | 2.0 | 2116 | $2,900 | $1.37 | 24d | 1 | 0.87mi |
| 9000 Woodbine Trl Riviera Beach, FL | 1.0–3.0 | 1.0–2.0 | 1031 | $3,015 | $2.92 | 2d | 1 | 0.96mi |
| 2016 Avenue S Riviera Beach, FL | 4.0 | 3.0 | 1128 | $3,800 | $3.37 | 24d | 1 | 1.20mi |
| 2226 Oakmont Dr Riviera Beach, FL | 3.0 | 2.5 | 1972 | $2,850 | $1.45 | 24d | 1 | 1.24mi |
| 5911 Barbados Way E West Palm Beach, FL | 3.0 | 2.0 | 1454 | $2,900 | $1.99 | 22d | 1 | 1.37mi |
| 5911 Barbados Way E West Palm Beach, FL | 3.0 | 2.0 | 1454 | $2,900 | $1.99 | 24d | 1 | 1.37mi |
Listing history 11 events
-
2026-06-18days on market $196,000 Active 295 DOM
-
2026-06-17days on market $196,000 Active 294 DOM
-
2026-06-16days on market $196,000 Active 293 DOM
-
2026-06-15days on market $196,000 Active 292 DOM
-
2026-06-13days on market $196,000 Active 290 DOM
-
2026-06-09days on market $196,000 Active 286 DOM
-
2026-06-07days on market $196,000 Active 284 DOM
-
2026-06-04days on market $196,000 Active 281 DOM
-
2026-06-03days on market $196,000 Active 280 DOM
-
2026-06-01days on market $196,000 Active 278 DOM
-
2026-05-31days on market $196,000 Active 277 DOM
ⓘ Source: listings_history table (triggers on properties + properties_extension) + one-shot
backfill from property_details.listing_events for pre-trigger history.
Climate risk First Street
- Flood 1/10 Low FEMA zone X (unshaded) · 0% chance over 30 yrs
- Wildfire 2/10 Low
- Heat 10/10 Extreme 7 d/yr ≥106°F today · 24 d/yr by 30 yrs out
- Wind 10/10 Extreme 99% chance of damaging wind over 30 yrs
- Air quality 2/10 Low 0 unhealthy d/yr today · 1 by 30 yrs out
Nearby sold comps map
Loading sold comps map…
Walkable amenities ~0.75 mi
Loading nearby amenities…
Taxation est. · year 1
- Rental income
- $37,392
- − Mortgage interest
- −$10,979
- − Property taxes
- −$2,940
- − Insurance
- −$980
- − Repairs & maintenance
- −$2,991
- − Management
- −$2,991
- − Depreciation
- −$5,702
- Taxable income
- $10,808
- Est. tax owed @ 24.0%
- −$2,594
- After-tax cash flow
- $10,691/yr
For passive investors: Depreciation is non-cash, so a rental often shows a tax loss while cash-flowing — sheltering income. Rental losses are passive: they offset passive income freely, and up to $25,000/yr can offset ordinary (W-2) income if you actively participate and your MAGI is under $100k (phasing out to $0 by $150k); unused losses carry forward. On sale, claimed depreciation is recaptured at up to 25%, and gains may owe capital-gains tax (a 1031 exchange can defer both). Figures are a year-1 estimate at your 24.0% rate — not tax advice; consult a CPA.
Schools (NCES district)
- District
- Palm Beach
- NCES district ID
- 1201500
- Math proficiency
- 46% ▼ -16.00%
- Reading proficiency
- 53% ▼ -4.00%
- Median HH income
- $53,943
- Composite
- 42.72/100
- National rank
- #3160
- State rank
- #34 of 73 in FL
Livability — Riviera Beach
- Score
- 67/100
- State rank
- #581
- US rank
- #11060
Category grades
Schools grade is shown separately in the Schools card above.
Census & demographics
- County
- Palm Beach County · 1,438,312 people
- City population
- 30,912
- Metro
- Miami-Fort Lauderdale-Pompano Beach, FL
- Population (ZIP)
- 30,912
- Household income
- $65,063
- Rent vs Own
- Severe rent burden
- 1838.0
Population outlook (Palm Beach County) Hauer SSP2
- Today (2025)
- 1,637,487 people
- By 2030
- 1,743,255 · +6.5%
- By 2040
- 1,948,712 · +19.0%
- By 2050
- 2,132,979 · +30.3%
- By 2075
- 2,530,027 · +54.5%
- By 2100
- 2,706,979 · +65.3%
Race, ethnicity, and origin ACS 2023
- Neighborhood character
- Majority Black (64%)
- Race & ethnicity
- Black 64% White 22% Hispanic / Latino 9% Two or more races 8%
- Hispanic origin (detail)
- Mexican 1% Puerto Rican 1%
- Common ancestry
- Hispanic 8% Romanian 1% Italian 1%
- Foreign-born
- 21% · Canada, Jamaica
- Languages at home
- 82% English-only · Spanish 8% French/Haitian/Cajun 7% Other Indo-European 1%
Political lean MEDSL · Palm Beach
- 2024 margin
- Toss-up / Even · D 50.0% · R 49.2%
- 2008→2024 swing
- -22.1pp toward R · 2008: 22.9pp · 2024: 0.8pp
- All cycles
- 2024: D+0.8 2020: D+12.8 2016: D+15.3 2012: D+17.0 2008: D+22.9
Not yet ingested
- Civics
- —
Market trends
- HPI YoY
- ▼ -153.74%
- Current HPI
- 341.1761
- Rent YoY
- ▼ -0.72%
- Metro
- Miami-Fort Lauderdale-Pompano Beach, FL
- State GDP YoY
- ▲ 3.28%
- F500 in state
- 36
Industry mix (Fortune 500 HQ in FL)
| Industry | F500 HQs | Revenue |
|---|---|---|
| Industrial Technology | 2 | $29B |
|
||
| Insurance | 2 | $17B |
|
||
| Retail | 1 | $60B |
|
||
| Technology Distribution | 1 | $58B |
|
||
| Homebuilding | 1 | $35B |
|
||
| Technology Manufacturing | 1 | $35B |
|
||
Cash-flow waterfall
monthlySold comps — $/sqft
last 12 mo · ≤1 miLoading sold comps…