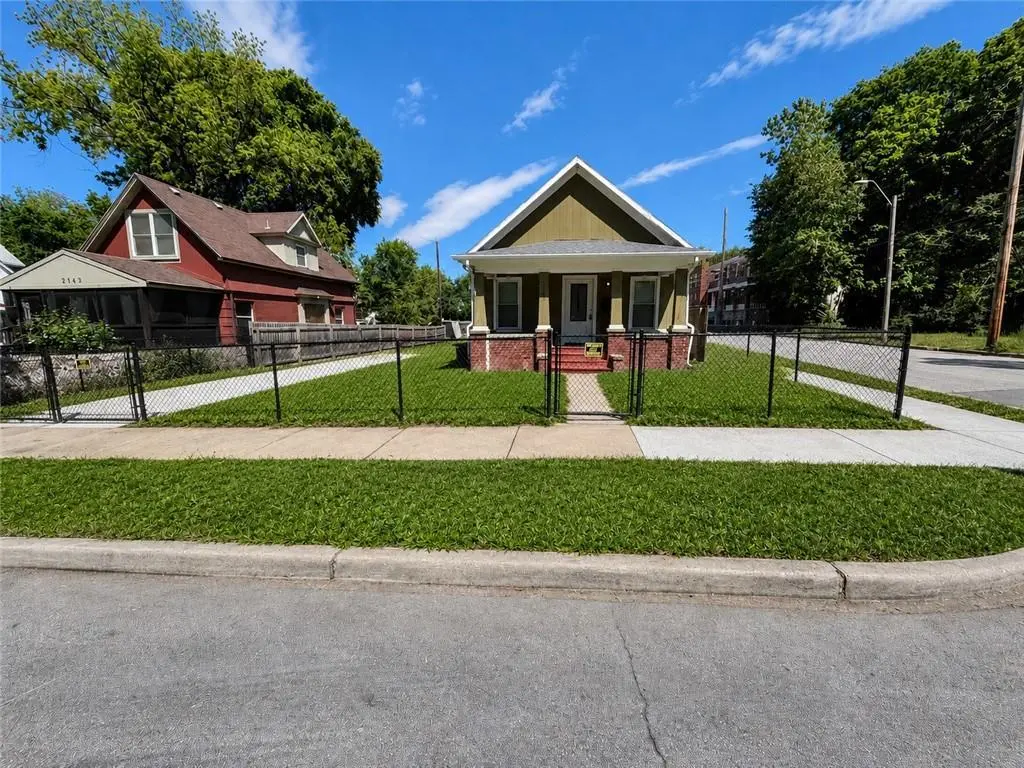
2947 Garfield Ave · Kansas City, MO
Flood risk 1/10 · Minimal
- FEMA flood zone
- X (unshaded)
- Chance of flooding over 30 yrs
- 0.0%
- Est. flood insurance / yr
- $507 – $1,088
Fire risk 1/10 · Minimal
- Est. fire insurance / yr
- $1,054 – $1,958
Heat risk 4/10 · Minor
- Hot days now (above 106°F)
- 7 days/yr
- Hot days in 30 yrs
- 15 days/yr
Wind risk 2/10 · Minimal
- Chance of severe wind over 30 yrs
- —
Air-quality risk 3/10 · Minor
- Unhealthy air days now
- 2 days/yr
- Unhealthy air days in 30 yrs
- 3 days/yr
Risk factors via First Street. Map © Google.
Why this score? — see what drove the C- grade
The composite is a weighted blend of 9 inputs, each scored 0–100. Each bar is that input's sub-score; the figure is the points it added to the 100-point composite (weight × sub-score).
- Cash flow +21.9/30.0
- ARV discount +7.5/15.0
- DSCR +7.0/10.0
- Rent growth +4.9/5.0
- 1% rule +4.4/10.0
- Livability +3.9/5.0
- Condition / age +2.5/5.0
- Schools +1.5/10.0
- Appreciation +0.0/10.0
$125,000
🖨 Deal sheet (PDF) 📄 Offer letter ✓ Due diligence
Listing remarks MLS
TOTALLY REBUILT house in up & coming area! New siding, roof, electrical, plumbing, HVAC, Water Heater, interior/exterior paint, tile, appliances and more! Nicely appointed kitchen with new stainless appliances & island, all new remodeled tile bathrooms, finished lower level! Have to see to appreciate. Truly feels like a new home at a great price! Seller is also constructing a new fence around property to have a fully fenced in yard with a partial privacy fence. Don’t miss this one! Price includes small lot to on the north side of property. Recently built police station and many commercial developments are underway.
Key facts
- Off street parking
- Finished basement
- Large pantry
Tags
Property features AI
Finance
- Other: Living area approximately 1,527 total (above and below grade combined); Above-grade finished area reported as 777; below-grade finished area reported as 750
- HOA & community: No association fees
Exterior
- Parking: Off-street parking
- Utilities: City/public water (verify); Public sewer
- Home design: Single-family residence; Residential property; Bungalow style; Approximately 101+ years old; Two finished levels (above and below grade)
- Construction: Board & batten siding; Composition roof
- Exterior features: Metal and wood fencing; Corner lot location
Interior
- Bedrooms: Three bedrooms — one on the main level and two in the basement
- Flooring: Tile
- Bathrooms: Two full bathrooms
- Heating & cooling: Electric heating; Electric cooling
- Interior features: Finished basement; Tile flooring; Bungalow floor plan
- Laundry & utility: Laundry located in the basement
Neighborhood map
What this means for you Summary
Snapshot
- This is a 2-bed/2.0-bath single-family listed at $125k.
Deal economics
- At list price, monthly cash flow is $196 ($2k/yr) — positive.
- The deal already cash-flows at list — no discount required.
- To meet the 1% rule (rent ≥ 1% of price), the offer needs to be $117k (6.1% below list).
- Recommended offer: $117k (6.1% below list) — sets the bar for 1% rule.
- Cap rate 8.2% vs local median 3.9% in Kansas City — top-decile yield for the area; either an underpriced asset or a hidden risk that comps aren't pricing in. Stress-test before assuming the spread holds.
Location & tenants
- Location reads 78/100 on livability (#28 in MO, #2,671 nationally) — a middle-class / working-renter tenant base. Strengths: amenities A+, commute A+, cost of living A+; Watch: crime F.
- Kansas City 33 (urban): math 12% / reading 24% proficiency, ranked #308 of 324 in MO (top 95%) — low school quality limits family demand, transient renter base, plan for 1-2y turnover; 75% free/reduced lunch — lower-income household profile, screen leases tightly.
- Zoned schools: Ac Prep Elementary (math 12% / reading 27%, grade F, #941 of 1,115 statewide, top 86%, 341 students, 99% FRL); Central Middle School (math 0% / reading 9%, grade F, #388 of 391 statewide, top 99%, 428 students, 99% FRL); Southeast High School (math 2% / reading 12%, grade F, #512 of 521 statewide, top 99%, 487 students, 99% FRL) — zoned schools average 99% FRL vs 75% district-wide (24 pts higher); higher-poverty schools than district average — tighter screening recommended.
- Market conditions: Rents rising fast (+9.5%/yr); 98 active listings in the ZIP; 40 comparable units currently listed for rent nearby; rentals at typical pace (median 23d on market — plan ~3-4 weeks tenant-placement turnaround); lower-income renter base — watch delinquency; 4,002 units permitted in Jackson County in 2024 (2,271 in 5+ unit buildings).
- This rent runs 34% of the median local income ($42k/yr) — at the standard rent-burdened threshold; future hikes will face affordability resistance.
Forward outlook
- Local home prices are declining (-3.0%/yr); year-one equity from $864 of loan paydown is wiped out by about $4k of value loss. Plan a longer hold.
- Jackson County population projected at +4% by 2050 — modest demand growth; plan on rents tracking national, not racing it.
- At projected returns (-3.0% appreciation + 8.0% rent growth), your $35k cash investment doubles in ~9 years — after that, you're playing with house money.
Negotiation context
- Only 14 days on market — expect competitive offers; lowballing is unlikely to land.
- 2 sale attempts since 8y ago with the ask held roughly flat each time — persistent listings suggest the price (not the market) is what's stuck; bring a comps-based counter.
Risks & watch-outs
- Watch-outs: built in 1909 — expect roof / HVAC / electrical / plumbing capex.
Questions for the listing agent
- Built in 1909 — when were the roof, HVAC, electrical panel, plumbing, and water heater last replaced?
- Is there a deadline driving the sale (1031 exchange, divorce, estate, relocation)? That informs how much negotiation room exists.
- Crime grade is F in this area — have there been break-ins, vandalism, or insurance claims at this property in the last 3 years? What carrier currently insures it and at what premium?
- What's the average days-on-market for RENTAL listings here right now (not sales)? A rising rental-DOM trend means longer vacancies and softer asking-rent achievability than the comps imply.
- What's the recent tenant-quality profile in this submarket — average credit score on applications, eviction rate, late-payment / NSF rate, and stable-employment percentage? A property-management company in the area should have these aggregated.
- How much new for-sale + rental construction is in the pipeline within 1–3 miles? Heavy new supply typically softens prices + rents 12–24 months out; constrained supply supports both.
Investment metrics
- 1% rule
- 0.94% ✗
- Cap rate
- 8.18%
- Cash-on-cash
- 6.73%
- DSCR
- 1.30
- GRM
- 8.9
CMA / ARV
- ARV (median comp)
- $125,111
- List price
- $125,000
- Delta
- -0.09%
- Verdict
- FAIR
- Comps
- 20 within 1.0 mi
Show comp detail 3 sales within ~0.75 mi
| Address | Dist | Beds/Ba | Sqft | Sold | Price | $/sf | Match |
|---|---|---|---|---|---|---|---|
| 3034 Brooklyn Ave | 0.10mi | 2/1.0 | 820 (+6%) | 13mo | $65,000 | $79 | 71 |
| 2524 Woodland Ave | 0.59mi | 2/1.0 | 764 (-2%) | 20mo | $36,500 | $48 | 49 |
| 3208 E 30th Ter | 0.69mi | 2/1.0 | 828 (+7%) | 12mo | $120,000 | $145 | 43 |
Match score weights: distance 35% · size 25% · config 20% · recency 20%. Top-matched comps best support the ARV.
Projected returns pro-forma
-3.0% appreciation · 8.0% rent growth · sell at horizon
- IRR
- -1.2%
- Equity multiple
- 0.95×
- Total profit
- $-1,613
- Equity at exit
- $18,638
- IRR
- 12.7%
- Equity multiple
- 2.22×
- Total profit
- $42,658
- Equity at exit
- $10,808
Cash invested: $35,000 (down + closing). Projections, not guarantees.
Landlord ↔ Tenant lean methodology
- Overall (STATE)
- 81 Strongly Landlord-Friendly
- State Missouri
- 81 Strongly Landlord-Friendly · R+10
- County
- — inherits STATE
- City
- — inherits STATE
ZIP-level market 64109
- Rents YoY
- 9.5%
- Active inventory
- 98
- Price-to-rent
- 8.9×
Monthly cashflow live
- Estimated rent
- $1,173 high interval (Pro) →
- Mortgage (P&I)
- −$656
- Tax from tax record
- −$23 /mo · $274/yr
- Insurance
- −$52
- HOA
- −$0
- Vacancy / Maint / Mgmt
- −$246
- Net cashflow
- $196
Break-even live
Sensitivity live
| Price | -10% $267 | -5% $232 | +0% $196 | +5% $161 | +10% $-23 |
|---|---|---|---|---|---|
| Rent | -10% $104 | -5% $150 | +0% $196 | +5% $243 | +10% $289 |
| Rate | -1.0pp $259 | -0.5pp $228 | base $196 | +0.5pp $164 | +1.0pp $131 |
UW: 25.0% down · 7.5% · 30yr · 1.5% tax · 5.0% vac · 8.0% maint · 8.0% mgmt
Financing live
Cash to close
- Down payment
- $31,250
- Closing costs
- $3,750
- Reserves months
- —
- Total cash needed
- —
Loan-product check · same deal, 3 products live
Conventional
25% down · 7.5% · 30yr
- Down + closing
- —
- Monthly P&I
- —
- Monthly cashflow
- —
- DSCR
- —
- Eligible?
- —
Personal DTI + credit; lowest rate.
DSCR
20% down · 8.5% · 30yr
- Down + closing
- —
- Monthly P&I
- —
- Monthly cashflow
- —
- DSCR
- —
- Eligible?
- —
No personal income docs; deal must DSCR.
Hard money
10% down · 12.0% · 12mo
- Down + closing
- —
- Monthly P&I
- —
- Monthly cashflow
- —
- DSCR
- —
- Eligible?
- —
Short-term bridge; refi at stabilization.
Rent comps 40 comps
| Address | Beds | Baths | Sqft | Rent | $/sqft | DOM | Units | Dist |
|---|---|---|---|---|---|---|---|---|
| 3233 Park Ave Unit 1 Kansas City, MO | 2.0 | 1.0 | 950 | $1,075 | $1.13 | 45d | 1 | 0.38mi |
| 3233 Park Ave Unit 2 Kansas City, MO | 2.0 | 1.0 | 950 | $1,000 | $1.05 | 25d | 1 | 0.38mi |
| 2637 E 29th St Unit 3 Kansas City, MO | 2.0 | 1.0 | 954 | $1,050 | $1.10 | 45d | 1 | 0.38mi |
| 1500 E 29th St Kansas City, MO | 1.0 | 1.0 | 650 | $895 | $1.38 | 9d | 1 | 0.40mi |
| 2938 Flora Ave Unit 1s Kansas City, MO | 2.0 | 1.0 | 795 | $875 | $1.10 | 5d | 1 | 0.41mi |
| 2538 Woodland Ave Unit 2B Kansas City, MO | 2.0 | 1.0 | 850 | $950 | $1.12 | 22d | 1 | 0.57mi |
| 2701 Benton Blvd Unit 2705-3 Kansas City, MO | 2.0 | 1.0 | 800 | $1,200 | $1.50 | 9d | 1 | 0.60mi |
| 2701 Benton Blvd Unit 2703-2 Kansas City, MO | 2.0 | 1.0 | 800 | $1,200 | $1.50 | 3d | 1 | 0.60mi |
| 3300 Virginia Ave Unit 2S Kansas City, MO | 2.0 | 1.0 | 900 | $1,000 | $1.11 | 45d | 1 | 0.67mi |
| 1108 E 30th St Unit St301 Kansas City, MO | 1.0 | 1.0 | 830 | $1,095 | $1.32 | 45d | 1 | 0.68mi |
| 3330 Agnes Ave Kansas City, MO | 3.0 | 1.0 | 1000 | $1,410 | $1.41 | 45d | 1 | 0.69mi |
| 3314 Tracy Ave Kansas City, MO | 3.0 | 1.0 | 1100 | $947 | $0.86 | 9d | 1 | 0.74mi |
| 3314 Tracy Ave Unit B Kansas City, MO | 3.0 | 1.0 | 1100 | $947 | $0.86 | 22d | 1 | 0.74mi |
| 3035 Harrison St Kansas City, MO | 1.0–2.0 | 1.0 | 725 | $1,250 | $1.72 | 4d | 1 | 0.77mi |
| 2454 Benton Blvd Unit 2458-2 Kansas City, MO | 1.0 | 1.0 | 750 | $1,000 | $1.33 | 9d | 1 | 0.77mi |
| 2454 Benton Blvd Unit 2460-3 Kansas City, MO | 1.0 | 1.0 | 750 | $1,100 | $1.47 | 18d | 1 | 0.78mi |
| 2454 Benton Blvd Unit 2456-1 Kansas City, MO | 1.0 | 1.0 | 750 | $1,000 | $1.33 | 18d | 1 | 0.78mi |
| 3310 College Ave Kansas City, MO | 3.0 | 1.0 | 874 | $995 | $1.14 | 45d | 1 | 0.82mi |
| 3609 Wayne Ave Kansas City, MO | 3.0 | 1.5 | 1118 | $1,900 | $1.70 | 25d | 1 | 0.85mi |
| 901 E 28th St Kansas City, MO | 1.0 | 1.0 | 900 | $947 | $1.05 | 17d | 1 | 0.86mi |
| 3240 Harrison St Kansas City, MO | 1.0–2.0 | 1.0 | 747 | $1,199 | $1.60 | 45d | 1 | 0.90mi |
| 2725 Campbell St Unit 2725-1 NE Kansas City, MO | 2.0 | 1.0 | 1000 | $1,250 | $1.25 | 45d | 1 | 0.90mi |
| 826 Linwood Blvd Kansas City, MO | 2.0 | 2.0 | 990 | $1,045 | $1.06 | 18d | 1 | 0.90mi |
| 1207 E Armour Blvd Unit 206 Kansas City, MO | 1.0 | 1.0 | 625 | $1,095 | $1.75 | 25d | 1 | 0.90mi |
| 3710 Wabash Ave Unit 2S Kansas City, MO | 2.0 | 1.0 | 875 | $850 | $0.97 | 25d | 1 | 0.90mi |
| 1205 E Armour Blvd Apt 106 Kansas City, MO | 1.0 | 1.0 | 625 | $995 | $1.59 | 45d | 1 | 0.91mi |
| 2727 Campbell St Unit 2727-1SW Kansas City, MO | 2.0 | 1.0 | 1000 | $1,250 | $1.25 | 9d | 1 | 0.91mi |
| 1108 E Armour Blvd Kansas City, MO | 2.0 | 1.0–2.0 | 773 | $1,745 | $2.26 | 4d | 11 | 0.92mi |
| 1108 E Armour Blvd Kansas City, MO | 2.0 | 1.0–2.0 | 780 | $1,745 | $2.24 | 45d | 5 | 0.92mi |
| 2501 Troost Ave Kansas City, MO | 2.0 | 1.0–2.0 | 984 | $2,679 | $2.72 | 45d | 15 | 0.92mi |
| 2821 Charlotte St Unit 2n Kansas City, MO | 2.0 | 1.0 | 935 | $1,195 | $1.28 | 45d | 1 | 0.93mi |
| 1111 E Armour Blvd Kansas City, MO | 2.0 | 1.0–2.0 | 788 | $1,660 | $2.11 | 4d | 9 | 0.95mi |
| 1111 E Armour Blvd Kansas City, MO | 2.0 | 1.0–2.0 | 812 | $1,660 | $2.04 | 45d | 9 | 0.95mi |
| 1020 E Armour Blvd Kansas City, MO | 1.0 | 1.0 | 709 | $1,510 | $2.13 | 4d | 18 | 0.97mi |
| 1020 E Armour Blvd Kansas City, MO | 2.0 | 1.0–2.0 | 865 | $1,825 | $2.11 | 17d | 22 | 0.97mi |
| 2732 Charlotte St Kansas City, MO | 1.0 | 1.0 | 600 | $950 | $1.58 | 45d | 1 | 0.97mi |
| 2732 Charlotte St Kansas City, MO | 1.0 | 1.0 | 600 | $950 | $1.58 | 4d | 1 | 0.97mi |
| 3403 Campbell St #9 Kansas City, MO | 2.0 | 1.0 | 900 | $1,100 | $1.22 | 21d | 1 | 0.97mi |
| 712 E Linwood Blvd Kansas City, MO | 1.0 | 1.0 | 625 | $1,195 | $1.91 | 4d | 1 | 0.99mi |
| 3233 Charlotte St Unit 2s Kansas City, MO | 1.0 | 1.0 | 850 | $900 | $1.06 | 25d | 1 | 0.99mi |
Listing history 10 events
-
2026-05-16historical Active Under Contract 623-char remark
-
2026-05-09$125,000 Active 623-char remark
-
2026-04-30historical
-
2026-04-30historical
-
2018-10-15soldstatus Sold
Show marketing remark (640 chars)
TOTALLY REBUILT house in up & coming area! New siding, roof, electrical, plumbing, HVAC, Water Heater, interior/exterior paint, tile, appliances and more! Nicely appointed kitchen with new stainless appliances & island, all new remodeled tile bathrooms, finished lower level! Have to see to appreciate. Truly feels like a new home at a great price! Seller is also constructing a new fence around property to have a fully fenced in yard with a partial privacy fence. Don’t miss this one! Price includes small lot to on the north side of property. Recently built police station and many commercial developments are underway.
-
2018-08-29status Pending
Show marketing remark (640 chars)
TOTALLY REBUILT house in up & coming area! New siding, roof, electrical, plumbing, HVAC, Water Heater, interior/exterior paint, tile, appliances and more! Nicely appointed kitchen with new stainless appliances & island, all new remodeled tile bathrooms, finished lower level! Have to see to appreciate. Truly feels like a new home at a great price! Seller is also constructing a new fence around property to have a fully fenced in yard with a partial privacy fence. Don’t miss this one! Price includes small lot to on the north side of property. Recently built police station and many commercial developments are underway.
-
2018-08-16historical Contingent - Accepting Backup Offers
Show marketing remark (640 chars)
TOTALLY REBUILT house in up & coming area! New siding, roof, electrical, plumbing, HVAC, Water Heater, interior/exterior paint, tile, appliances and more! Nicely appointed kitchen with new stainless appliances & island, all new remodeled tile bathrooms, finished lower level! Have to see to appreciate. Truly feels like a new home at a great price! Seller is also constructing a new fence around property to have a fully fenced in yard with a partial privacy fence. Don’t miss this one! Price includes small lot to on the north side of property. Recently built police station and many commercial developments are underway.
-
2018-08-10$80,000 Active
Show marketing remark (640 chars)
TOTALLY REBUILT house in up & coming area! New siding, roof, electrical, plumbing, HVAC, Water Heater, interior/exterior paint, tile, appliances and more! Nicely appointed kitchen with new stainless appliances & island, all new remodeled tile bathrooms, finished lower level! Have to see to appreciate. Truly feels like a new home at a great price! Seller is also constructing a new fence around property to have a fully fenced in yard with a partial privacy fence. Don’t miss this one! Price includes small lot to on the north side of property. Recently built police station and many commercial developments are underway.
-
2012-03-26soldstatus
-
1994-08-18soldstatus
ⓘ Source: listings_history table (triggers on properties + properties_extension) + one-shot
backfill from property_details.listing_events for pre-trigger history.
Tax reassessment forecast MO · Resets to sale price
- Current annual tax
- $274 · $23/mo
- Projected year-2 tax
- $1,212 · $101/mo
- Expected delta
- +$939/yr (+$78/mo · 342.6%)
ⓘ Screening estimate from a state-policy table — verify with the county assessor before closing.
Climate risk First Street
- Flood 1/10 Low FEMA zone X (unshaded) · 0% chance over 30 yrs
- Wildfire 1/10 Low
- Heat 4/10 Moderate 7 d/yr ≥106°F today · 15 d/yr by 30 yrs out
- Wind 2/10 Low
- Air quality 3/10 Moderate 2 unhealthy d/yr today · 3 by 30 yrs out
Nearby sold comps map
Loading sold comps map…
Walkable amenities ~0.75 mi
Loading nearby amenities…
Taxation est. · year 1
- Rental income
- $14,078
- − Mortgage interest
- −$7,002
- − Property taxes
- −$274
- − Insurance
- −$625
- − Repairs & maintenance
- −$1,126
- − Management
- −$1,126
- − Depreciation
- −$3,636
- Taxable income
- $288
- Est. tax owed @ 24.0%
- −$69
- After-tax cash flow
- $2,287/yr
For passive investors: Depreciation is non-cash, so a rental often shows a tax loss while cash-flowing — sheltering income. Rental losses are passive: they offset passive income freely, and up to $25,000/yr can offset ordinary (W-2) income if you actively participate and your MAGI is under $100k (phasing out to $0 by $150k); unused losses carry forward. On sale, claimed depreciation is recaptured at up to 25%, and gains may owe capital-gains tax (a 1031 exchange can defer both). Figures are a year-1 estimate at your 24.0% rate — not tax advice; consult a CPA.
Schools (NCES district)
- District
- Kansas City 33
- NCES district ID
- 2916400
- Math proficiency
- 12% ▼ -8.00%
- Reading proficiency
- 24% ▬ 0.00%
- Median HH income
- $35,227
- Composite
- 14.8/100
- National rank
- #9387
- State rank
- #308 of 324 in MO
Livability — Kansas City
- Score
- 78/100
- State rank
- #28
- US rank
- #2671
Category grades
Schools grade is shown separately in the Schools card above.
Census & demographics
- Census place
- Kansas City, MO
- County
- Jackson County · 687,798 people
- City population
- 439,467
- Metro
- Kansas City, MO-KS
- Population (ZIP)
- 10,043
- Household income
- $41,943
- Rent vs Own
- Severe rent burden
- 853.0
Population outlook (Jackson County) Hauer SSP2
- Today (2025)
- 719,589 people
- By 2030
- 731,456 · +1.6%
- By 2040
- 746,689 · +3.8%
- By 2050
- 749,289 · +4.1%
- By 2075
- 736,227 · +2.3%
- By 2100
- 668,210 · -7.1%
Race, ethnicity, and origin ACS 2023
- Neighborhood character
- Diverse neighborhood (Simpson 0.64)
- Race & ethnicity
- Black 45% White 39% Hispanic / Latino 9% Two or more races 4% Asian 2%
- Hispanic origin (detail)
- Mexican 7%
- Common ancestry
- Slovak 1% Romanian 1% Lithuanian 1%
- Foreign-born
- 7% · Canada, Philippines, China
- Languages at home
- 88% English-only · Spanish 5% Other Asian/Pacific 3% Arabic 1%
Political lean MEDSL · Jackson
- 2024 margin
- D (+19.3) · D 58.9% · R 39.5% · Other 1.6%
- 2008→2024 swing
- -6.1pp toward R · 2008: 25.4pp · 2024: 19.3pp
- All cycles
- 2024: D+19.3 2020: D+22.0 2016: D+16.6 2012: D+19.0 2008: D+25.4
Not yet ingested
- Civics
- —
Market trends
- HPI YoY
- ▼ -275.12%
- Current HPI
- 243.6094
- Rent YoY
- ▲ 9.50%
- Metro
- Kansas City, MO-KS
- State GDP YoY
- ▲ 1.84%
- F500 in state
- 20
Industry mix (Fortune 500 HQ in MO)
| Industry | F500 HQs | Revenue |
|---|---|---|
| Healthcare | 1 | $163B |
|
||
| Insurance | 1 | $21B |
|
||
| Industrial Technology | 1 | $17B |
|
||
| Retail | 1 | $16B |
|
||
| Industrial Distribution | 1 | $10B |
|
||
| Utilities | 1 | $9B |
|
||
Price history
+56.2% since first listed12 events — show timeline
- 2026-06-12 Sold (MLS) — Heartland MLS as Distributed by MLS Grid
- 2026-05-23 Pending — Heartland MLS as Distributed by MLS Grid
- 2026-05-16 Contingent — Heartland MLS as Distributed by MLS Grid
- 2026-05-09 Listed $125,000 Heartland MLS as Distributed by MLS Grid
- 2026-04-30 Listing Removed — Heartland MLS as Distributed by MLS Grid
- 2026-04-30 Coming Soon — Heartland MLS as Distributed by MLS Grid
- 2018-10-15 Sold (MLS) — Heartland MLS as Distributed by MLS Grid
- 2018-08-29 Pending — Heartland MLS as Distributed by MLS Grid
- 2018-08-16 Contingent — Heartland MLS as Distributed by MLS Grid
- 2018-08-10 Listed $80,000 Heartland MLS as Distributed by MLS Grid
- 2012-03-26 Sold (Public Records) — Public Records
- 1994-08-18 Sold (Public Records) — Public Records
Property tax history
+2.1%/yrLatest (2025): $274 · -62.8% YoY. Source: county tax records.
Cash-flow waterfall
monthlySold comps — $/sqft
last 12 mo · ≤1 miLoading sold comps…