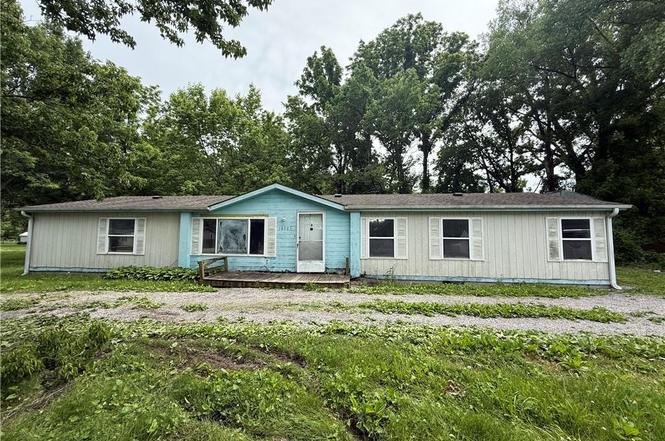
18505 E Truman Rd · Independence, MO
Flood risk 1/10 · Minimal
- FEMA flood zone
- X (unshaded)
- Chance of flooding over 30 yrs
- 0.0%
- Est. flood insurance / yr
- $507 – $1,088
Fire risk 1/10 · Minimal
- Est. fire insurance / yr
- $1,054 – $1,958
Heat risk 4/10 · Minor
- Hot days now (above 107°F)
- 7 days/yr
- Hot days in 30 yrs
- 16 days/yr
Wind risk 2/10 · Minimal
- Chance of severe wind over 30 yrs
- —
Air-quality risk 3/10 · Minor
- Unhealthy air days now
- 3 days/yr
- Unhealthy air days in 30 yrs
- 3 days/yr
Risk factors via First Street. Map © Google.
Why this score? — see what drove the C grade
The composite is a weighted blend of 9 inputs, each scored 0–100. Each bar is that input's sub-score; the figure is the points it added to the 100-point composite (weight × sub-score).
- Cash flow +24.5/30.0
- DSCR +7.9/10.0
- ARV discount +7.5/15.0
- 1% rule +6.7/10.0
- Livability +4.1/5.0
- Rent growth +3.4/5.0
- Schools +2.7/10.0
- Condition / age +2.5/5.0
- Appreciation +0.0/10.0
$170,000
🖨 Deal sheet 📄 Offer letter ✓ Due diligence
Listing remarks MLS
Nice acreage backyard overlooks creek/fishing- dbl wide on concrete foundation- tall crawl- short bsmt w/ ext walk-up door. Needs paint/carpet. Detached garage. Pre-approval per "as-is" sellers addendums.
Key facts
- Outbuilding
- Circle drive
- Creek
Tags
Property features AI
Finance
- Other: No maintenance provided by a community association
- HOA & community: No association fees
Exterior
- Parking: Detached 2-car garage
- Utilities: Public water; Public sewer
- Home design: Manufactured single-family residence; Ranch floor plan; One-story
- Construction: Wood siding; Composition roof; Estimated age: 31-40 years; Above-grade living area approximately 1,716 (source: public records)
- Exterior features: Acreage lot (approximately 3.03 acres); Located in a designated flood plain
Interior
- Kitchen: Pantry; Vinyl flooring in kitchen
- Bedrooms: 3 bedrooms (all on the first level)
- Flooring: Carpet in bedrooms, dining room and living room; Vinyl in kitchen
- Bathrooms: 2 full bathrooms (first level)
- Heating & cooling: Forced air heating; Electric cooling (central air)
- Interior features: Vaulted ceilings; Crawl space basement
- Laundry & utility: Main-level laundry room
Neighborhood map
What this means for you Summary
Snapshot
- This is a 3-bed/2.0-bath manufactured listed at $170k.
Deal economics
- At list price, monthly cash flow is $348 ($4k/yr) — positive.
- The deal already cash-flows at list — no discount required.
- Meets the 1% rule at list price ($2k rent vs $170k).
- Cap rate 8.7% vs local median 5.0% in Independence — top-decile yield for the area; either an underpriced asset or a hidden risk that comps aren't pricing in. Stress-test before assuming the spread holds.
Location & tenants
- Location reads 82/100 on livability (#10 in MO, #1,296 nationally) — a professional / high-income tenant draw. Strengths: amenities A+, commute A+, cost of living A+; Watch: schools C-, employment D+, crime F.
- Independence 30 (suburban): math 26% / reading 38% proficiency, ranked #252 of 324 in MO (top 78%) — families likely to look elsewhere, expect single-tenant / working-renter base with shorter leases.
- Market conditions: Rents rising (+3.8%/yr); 106 active listings in the ZIP; 11 comparable units currently listed for rent nearby; rentals leasing fast (median 3d on market — plan ~1-2 weeks tenant-placement turnaround); 4,002 units permitted in Jackson County in 2024 (2,271 in 5+ unit buildings).
- This rent runs 35% of the median local income ($68k/yr) — at the standard rent-burdened threshold; future hikes will face affordability resistance.
Forward outlook
- Local home prices are declining (-3.0%/yr); year-one equity from $1k of loan paydown is wiped out by about $5k of value loss. Plan a longer hold.
- Jackson County population projected at +4% by 2050 — modest demand growth; plan on rents tracking national, not racing it.
Negotiation context
- Only 5 days on market — expect competitive offers; lowballing is unlikely to land.
- 2 sale attempts since 17y ago with the ask held roughly flat each time — persistent listings suggest the price (not the market) is what's stuck; bring a comps-based counter.
Questions for the listing agent
- Is there a deadline driving the sale (1031 exchange, divorce, estate, relocation)? That informs how much negotiation room exists.
- Crime grade is F in this area — have there been break-ins, vandalism, or insurance claims at this property in the last 3 years? What carrier currently insures it and at what premium?
- What's the average days-on-market for RENTAL listings here right now (not sales)? A rising rental-DOM trend means longer vacancies and softer asking-rent achievability than the comps imply.
- What's the recent tenant-quality profile in this submarket — average credit score on applications, eviction rate, late-payment / NSF rate, and stable-employment percentage? A property-management company in the area should have these aggregated.
- How much new for-sale + rental construction is in the pipeline within 1–3 miles? Heavy new supply typically softens prices + rents 12–24 months out; constrained supply supports both.
Investment metrics
- 1% rule
- 1.17% ✓
- Cap rate
- 8.75%
- Cash-on-cash
- 8.77%
- DSCR
- 1.39
- GRM
- 7.1
CMA / ARV
No comps found within radius.
Projected returns pro-forma
-3.0% appreciation · 3.76% rent growth · sell at horizon
- IRR
- -2.1%
- Equity multiple
- 0.92×
- Total profit
- $-3,791
- Equity at exit
- $25,348
- IRR
- 8.5%
- Equity multiple
- 1.67×
- Total profit
- $31,875
- Equity at exit
- $14,698
Cash invested: $47,600 (down + closing). Projections, not guarantees.
Landlord ↔ Tenant lean methodology
- Overall (STATE)
- 81 Strongly Landlord-Friendly
- State Missouri
- 81 Strongly Landlord-Friendly · R+10
- County
- — inherits STATE
- City
- — inherits STATE
ZIP-level market 64056
- Rents YoY
- 3.8%
- Active inventory
- 106
- Price-to-rent
- 7.1×
Monthly cashflow live
- Estimated rent
- $1,991 high interval (Pro) →
- Mortgage (P&I)
- −$891
- Tax from tax record
- −$263 /mo · $3,153/yr
- Insurance
- −$71
- HOA
- −$0
- Vacancy / Maint / Mgmt
- −$418
- Net cashflow
- $348
Break-even live
UW: 25.0% down · 7.5% · 30yr · 1.5% tax · 5.0% vac · 8.0% maint · 8.0% mgmt
Financing live
Cash to close
- Down payment
- $42,500
- Closing costs
- $5,100
- Reserves months
- —
- Total cash needed
- —
Loan-product check · same deal, 3 products live
Conventional
25% down · 7.5% · 30yr
- Down + closing
- —
- Monthly P&I
- —
- Monthly cashflow
- —
- DSCR
- —
- Eligible?
- —
Personal DTI + credit; lowest rate.
DSCR
20% down · 8.5% · 30yr
- Down + closing
- —
- Monthly P&I
- —
- Monthly cashflow
- —
- DSCR
- —
- Eligible?
- —
No personal income docs; deal must DSCR.
Hard money
10% down · 12.0% · 12mo
- Down + closing
- —
- Monthly P&I
- —
- Monthly cashflow
- —
- DSCR
- —
- Eligible?
- —
Short-term bridge; refi at stabilization.
Rent comps 11 comps
| Address | Beds | Baths | Sqft | Rent | $/sqft | DOM | Units | Dist |
|---|---|---|---|---|---|---|---|---|
| 1720 S Whitney Dr Independence, MO | 3.0 | 2.5 | 1904 | $1,995 | $1.05 | 43d | 1 | 0.56mi |
| 18504 E 20th Street Ct Independence, MO | 4.0 | 3.0 | 1942 | $2,315 | $1.19 | 21d | 1 | 0.72mi |
| 1709 Berry Rd Independence, MO | 3.0 | 2.0 | 1941 | $1,710 | $0.88 | 16d | 1 | 0.73mi |
| 1900 S Brookstone Village Dr Independence, MO | 1.0–3.0 | 1.0–2.0 | 951 | $1,797 | $1.89 | 2d | 8 | 0.83mi |
| 1208 S Mayview Ave Independence, MO | 4.0 | 2.0 | 1595 | $2,300 | $1.44 | 1d | 1 | 0.89mi |
| 20105 E 12th Ter S Independence, MO | 4.0 | 2.0 | 1624 | $2,010 | $1.24 | 3d | 1 | 1.09mi |
| 111 N Gilbert St Independence, MO | 3.0 | 1.0 | 1328 | $1,511 | $1.14 | 1d | 1 | 1.33mi |
| 1318 S Kaydeen Ct Independence, MO | 2.0–3.0 | 2.0 | 1200 | $1,745 | $1.45 | 1d | 1 | 1.39mi |
| 19200 E Salisbury Rd Independence, MO | 4.0 | 2.0 | 1518 | $2,000 | $1.32 | 23d | 1 | 1.42mi |
| 19300 E Salisbury Rd Independence, MO | 3.0 | 1.0 | 1257 | $1,845 | $1.47 | 1d | 1 | 1.45mi |
| 17004 E 3rd Ter N Independence, MO | 3.0 | 1.5 | 1486 | $1,495 | $1.01 | 1d | 1 | 1.48mi |
Listing history 4 events
-
2026-06-15status $170,000 Pending 5 DOM
-
2026-06-15days on market $170,000 Active 5 DOM
-
2026-06-13remarks 645-char remark
-
2026-06-13$170,000 Active 3 DOM
ⓘ Source: listings_history table (triggers on properties + properties_extension) + one-shot
backfill from property_details.listing_events for pre-trigger history.
Tax reassessment forecast MO · Resets to sale price
- Current annual tax
- $3,153 · $263/mo
- Projected year-2 tax
- $3,153 · $263/mo
- Expected delta
- $0/yr ($0/mo · 0.0%)
ⓘ Screening estimate from a state-policy table — verify with the county assessor before closing.
Climate risk First Street
- Flood 1/10 Low FEMA zone X (unshaded) · 0% chance over 30 yrs
- Wildfire 1/10 Low
- Heat 4/10 Moderate 7 d/yr ≥107°F today · 16 d/yr by 30 yrs out
- Wind 2/10 Low
- Air quality 3/10 Moderate 3 unhealthy d/yr today · 3 by 30 yrs out
Nearby sold comps map
Loading sold comps map…
Walkable amenities ~0.75 mi
Loading nearby amenities…
Taxation est. · year 1
- Rental income
- $23,895
- − Mortgage interest
- −$9,523
- − Property taxes
- −$3,153
- − Insurance
- −$850
- − Repairs & maintenance
- −$1,912
- − Management
- −$1,912
- − Depreciation
- −$4,945
- Taxable income
- $1,600
- Est. tax owed @ 24.0%
- −$384
- After-tax cash flow
- $3,791/yr
For passive investors: Depreciation is non-cash, so a rental often shows a tax loss while cash-flowing — sheltering income. Rental losses are passive: they offset passive income freely, and up to $25,000/yr can offset ordinary (W-2) income if you actively participate and your MAGI is under $100k (phasing out to $0 by $150k); unused losses carry forward. On sale, claimed depreciation is recaptured at up to 25%, and gains may owe capital-gains tax (a 1031 exchange can defer both). Figures are a year-1 estimate at your 24.0% rate — not tax advice; consult a CPA.
Schools (NCES district)
- District
- Independence 30
- NCES district ID
- 2915480
- Math proficiency
- 26% ▼ -8.00%
- Reading proficiency
- 38% ▼ -5.00%
- Median HH income
- $41,843
- Composite
- 27.04/100
- National rank
- #7054
- State rank
- #252 of 324 in MO
Livability — Independence
- Score
- 82/100
- State rank
- #10
- US rank
- #1296
Category grades
Schools grade is shown separately in the Schools card above.
Census & demographics
- Census place
- Independence, MO
- County
- Jackson County · 687,798 people
- City population
- 117,675
- Metro
- Kansas City, MO-KS
- Population (ZIP)
- 17,395
- Household income
- $67,685
- Rent vs Own
- Severe rent burden
- 747.0
Population outlook (Jackson County) Hauer SSP2
- Today (2025)
- 719,589 people
- By 2030
- 731,456 · +1.6%
- By 2040
- 746,689 · +3.8%
- By 2050
- 749,289 · +4.1%
- By 2075
- 736,227 · +2.3%
- By 2100
- 668,210 · -7.1%
Race, ethnicity, and origin ACS 2023
- Neighborhood character
- Predominantly White (69%)
- Race & ethnicity
- White 69% Black 14% Hispanic / Latino 8% Two or more races 7% Pacific Islander 1%
- Hispanic origin (detail)
- Mexican 6%
- Common ancestry
- Italian 9% Lithuanian 2% Slovak 2%
- Foreign-born
- 3% · Canada
- Languages at home
- 96% English-only · Spanish 4%
Political lean MEDSL · Jackson
- 2024 margin
- D (+19.3) · D 58.9% · R 39.5% · Other 1.6%
- 2008→2024 swing
- -6.1pp toward R · 2008: 25.4pp · 2024: 19.3pp
- All cycles
- 2024: D+19.3 2020: D+22.0 2016: D+16.6 2012: D+19.0 2008: D+25.4
Not yet ingested
- Civics
- —
Market trends
- HPI YoY
- ▼ -163.60%
- Current HPI
- 286.349
- Rent YoY
- ▲ 3.76%
- Metro
- Kansas City, MO-KS
- State GDP YoY
- ▲ 1.84%
- F500 in state
- 20
Industry mix (Fortune 500 HQ in MO)
| Industry | F500 HQs | Revenue |
|---|---|---|
| Healthcare | 1 | $163B |
|
||
| Insurance | 1 | $21B |
|
||
| Industrial Technology | 1 | $17B |
|
||
| Retail | 1 | $16B |
|
||
| Industrial Distribution | 1 | $10B |
|
||
| Utilities | 1 | $9B |
|
||
Price history
+326.1% since first listed4 events — show timeline
- 2026-06-10 Listed $170,000 Heartland MLS as Distributed by MLS Grid
- 2009-02-27 Sold (MLS) — Heartland MLS as Distributed by MLS Grid
- 2009-01-30 Listed $39,900 Heartland MLS as Distributed by MLS Grid
- 1984-04-01 Sold (Public Records) — Public Records
Property tax history
+11.2%/yrLatest (2025): $3,153 · +18.6% YoY. Source: county tax records.
Cash-flow waterfall
monthlySold comps — $/sqft
last 12 mo · ≤1 miLoading sold comps…