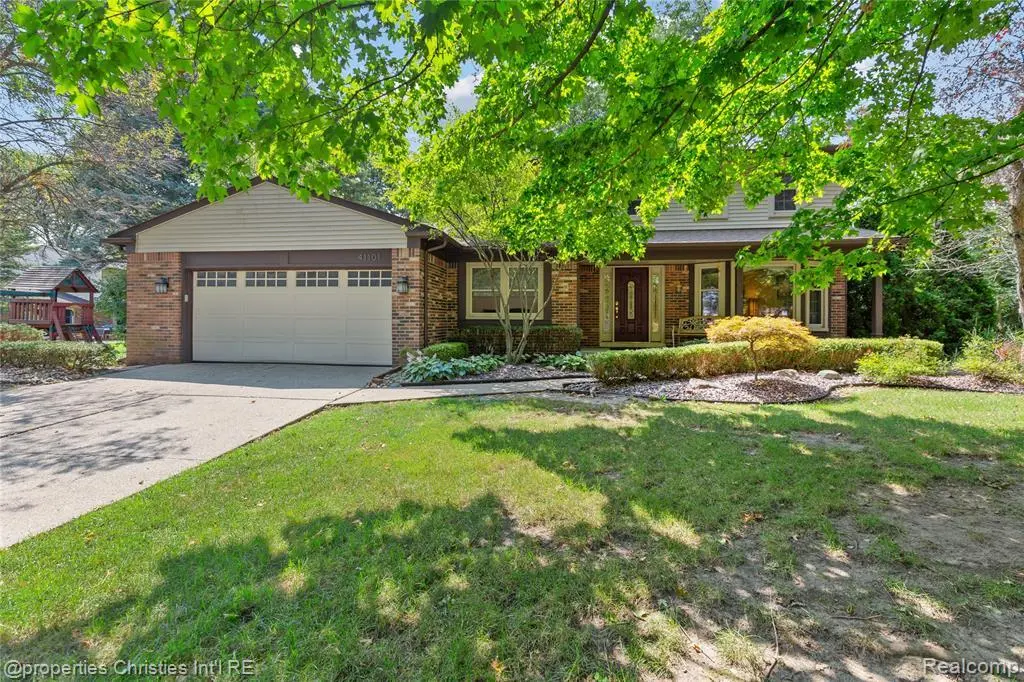
41101 Croydon Ct · Northville, MI
Flood risk 1/10 · Minimal
- FEMA flood zone
- X (unshaded)
- Chance of flooding over 30 yrs
- 0.0%
- Est. flood insurance / yr
- $473 – $860
Fire risk 1/10 · Minimal
- Est. fire insurance / yr
- $784 – $1,456
Heat risk 3/10 · Minor
- Hot days now (above 97°F)
- 7 days/yr
- Hot days in 30 yrs
- 15 days/yr
Wind risk 2/10 · Minimal
- Chance of severe wind over 30 yrs
- —
Air-quality risk 3/10 · Minor
- Unhealthy air days now
- 2 days/yr
- Unhealthy air days in 30 yrs
- 4 days/yr
Risk factors via First Street. Map © Google.
Why this score? — see what drove the C- grade
The composite is a weighted blend of 9 inputs, each scored 0–100. Each bar is that input's sub-score; the figure is the points it added to the 100-point composite (weight × sub-score).
- Cash flow +18.4/30.0
- ARV discount +6.9/15.0
- DSCR +5.8/10.0
- Schools +5.6/10.0
- 1% rule +4.5/10.0
- Livability +4.4/5.0
- Rent growth +2.5/5.0
- Condition / age +2.5/5.0
- Appreciation +0.0/10.0
$599,000
🖨 Deal sheet 📄 Offer letter ✓ Due diligence
Listing remarks MLS
Welcome to this inviting 4-bedroom colonial home nestled in a peaceful cul-de-sac in the highly sought-after Northville School District. This well-maintained property offers a perfect blend of comfort and modern upgrades. Newer Hardwood Floors! Tastefully updated flooring throughout the main areas adds warmth and elegance. Newer Roof Recently installed, providing peace of mind for years to come. Updated Sump Pump Ensuring your home stays dry and comfortable. Finished Basement Expansive additional space for recreation, home office, or storage, tailored to your needs. Brand-New Heat Exchanger (2023) Enhancing your home's efficiency and comfort. Don't miss the opportunity to make this lovely colonial your new home.
Key facts
- Newer roof
- Finished basement
- Updated sump pump
Tags
Property features AI
Finance
- Other: Located in Northville Colony Estates 3 subdivision; Directions: South of 6 Mile, West of Haggerty
- HOA & community: Homeowners association with an annual fee of $280 (about $23.33/month)
Exterior
- Parking: Attached garage with 2 spaces
- Utilities: Public water; Public sewer
- Home design: Single-family residence; Two levels; Ground-level entry; Brick and vinyl siding exterior; Asphalt roof; Lot about 0.35 acres (74.49 x 138.3)
- Construction: Brick and vinyl siding construction
- Exterior features: Patio; Porch; Cul-de-sac lot; Paved road access
Interior
- Bedrooms: Total rooms: 10
- Bathrooms: Three full bathrooms; One half bathroom
- Heating & cooling: Forced air heating (natural gas); No central cooling
- Interior features: Finished basement; Fireplace in the living room
Neighborhood map
What this means for you Summary
Snapshot
- This is a 4-bed/2.5-bath single-family listed at $599k.
Deal economics
- At list price, monthly cash flow is $564 ($7k/yr) — positive.
- The deal already cash-flows at list — no discount required.
- To meet the 1% rule (rent ≥ 1% of price), the offer needs to be $568k (5.2% below list).
- Recommended offer: $568k (5.2% below list) — sets the bar for 1% rule.
- Cap rate 7.4% vs local median 2.4% in Northville — top-decile yield for the area; either an underpriced asset or a hidden risk that comps aren't pricing in. Stress-test before assuming the spread holds.
Location & tenants
- Location reads 88/100 on livability (#13 in MI, #205 nationally) — a professional / high-income tenant draw. Strengths: schools A+, crime A+, amenities A+; Watch: commute F.
- Plymouth-Canton Community Schools (suburban): math 58% / reading 66% proficiency, ranked #27 of 540 in MI (top 5%) — acceptable for families but not a draw, mixed tenant base, ~2y average lease; only 14% free/reduced lunch — higher-income household profile.
- Market conditions: 145 active listings in the ZIP; 2 comparable units currently listed for rent nearby; 2,639 units permitted in Wayne County in 2024 (1,216 in 5+ unit buildings).
Forward outlook
- Local home prices are declining (-3.0%/yr); year-one equity from $4k of loan paydown is wiped out by about $18k of value loss. Plan a longer hold.
- Wayne County population projected at -17% by 2050 — secular population decline; favor cash flow + early exit over multi-decade hold.
Negotiation context
- It's been on market 36 days — a 3% lower offer ($581k) is reasonable based on typical stale-listing flexibility.
- 16 sale attempts since 26y ago with the ask held roughly flat each time — persistent listings suggest the price (not the market) is what's stuck; bring a comps-based counter.
- Current owner paid $320k; list at $599k implies a 87% gain — meaningful room to come down on a strong offer.
Questions for the listing agent
- It's been on market 36 days. Have you received any prior offers? Is the seller open to a 5% concession, seller financing, or rate buy-down credit?
- Built in 1978 — when were the roof, HVAC, electrical panel, plumbing, and water heater last replaced?
- What does the HOA fee cover, when was the last increase, and are there any pending special assessments or reserve-fund shortfalls?
- Is there a deadline driving the sale (1031 exchange, divorce, estate, relocation)? That informs how much negotiation room exists.
- Schools are A-rated — typically a magnet for longer-tenancy family renters. What's the average tenant stay here, and is there a school-zone premium baked into asking?
- What's the average days-on-market for RENTAL listings here right now (not sales)? A rising rental-DOM trend means longer vacancies and softer asking-rent achievability than the comps imply.
- What's the recent tenant-quality profile in this submarket — average credit score on applications, eviction rate, late-payment / NSF rate, and stable-employment percentage? A property-management company in the area should have these aggregated.
- How much new for-sale + rental construction is in the pipeline within 1–3 miles? Heavy new supply typically softens prices + rents 12–24 months out; constrained supply supports both.
Investment metrics
- 1% rule
- 0.95% ✗
- Cap rate
- 7.42%
- Cash-on-cash
- 4.04%
- DSCR
- 1.18
- GRM
- 8.8
CMA / ARV
- ARV (median comp)
- $590,909
- List price
- $599,000
- Delta
- 1.37%
- Verdict
- FAIR
- Comps
- 20 within 1.0 mi
Show comp detail 12 sales within ~0.75 mi
| Address | Dist | Beds/Ba | Sqft | Sold | Price | $/sf | Match |
|---|---|---|---|---|---|---|---|
| 42098 Banbury Rd | 0.55mi | 4/2.5 | 2,439 (+1%) | 10mo | $550,000 | $226 | 65 |
| 41100 White Haven Ct | 0.28mi | 3/2.5 (-1) | 2,169 (-11%) | 1mo | $571,000 | $263 | 63 |
| 15948 Park Ln | 0.60mi | 5/2.5 (+1) | 2,385 (-2%) | 3mo | $610,000 | $256 | 62 |
| 41849 Banbury Rd | 0.38mi | 3/2.5 (-1) | 2,201 (-9%) | 4mo | $550,000 | $250 | 58 |
| 17540 E Northville Trl | 0.50mi | 4/2.5 | 2,578 (+6%) | 10mo | $665,000 | $258 | 58 |
| 42117 Banbury Rd | 0.56mi | 4/2.5 | 2,563 (+6%) | 10mo | $590,000 | $230 | 56 |
| 41501 Ladywood Ct | 0.66mi | 4/2.5 | 2,203 (-9%) | 1mo | $568,500 | $258 | 53 |
| 41925 Waterwheel Rd | 0.61mi | 4/2.5 | 2,710 (+12%) | 9mo | $547,500 | $202 | 44 |
| 41718 Ladywood Dr | 0.68mi | 4/2.5 | 2,735 (+13%) | 8mo | $450,000 | $165 | 40 |
| 41908 Pon Meadow Dr | 0.55mi | 3/2.5 (-1) | 2,757 (+14%) | 9mo | $600,500 | $218 | 39 |
| 42331 Beacontree Ct | 0.68mi | 4/2.5 | 2,750 (+13%) | 10mo | $590,000 | $215 | 38 |
| 15800 Park Ln | 0.70mi | 3/3.0 (-1) | 2,213 (-9%) | 10mo | $377,500 | $171 | 38 |
Match score weights: distance 35% · size 25% · config 20% · recency 20%. Top-matched comps best support the ARV.
Projected returns pro-forma
-3.0% appreciation · 3.0% rent growth · sell at horizon
- IRR
- -10.0%
- Equity multiple
- 0.64×
- Total profit
- $-61,173
- Equity at exit
- $89,313
- IRR
- -0.6%
- Equity multiple
- 0.96×
- Total profit
- $-7,183
- Equity at exit
- $51,791
Cash invested: $167,720 (down + closing). Projections, not guarantees.
Landlord ↔ Tenant lean methodology
- Overall (STATE)
- 62 Landlord-Friendly
- State Michigan
- 62 Landlord-Friendly · EVEN
- County
- — inherits STATE
- City
- — inherits STATE
ZIP-level market 48168
- Active inventory
- 145
- Price-to-rent
- 8.8×
Monthly cashflow live
- Estimated rent
- $5,681 medium interval (Pro) →
- Mortgage (P&I)
- −$3,141
- Tax from tax record
- −$510 /mo · $6,122/yr
- Insurance
- −$250
- HOA
- −$23
- Vacancy / Maint / Mgmt
- −$1,193
- Net cashflow
- $564
Break-even live
UW: 25.0% down · 7.5% · 30yr · 1.5% tax · 5.0% vac · 8.0% maint · 8.0% mgmt
Financing live
Cash to close
- Down payment
- $149,750
- Closing costs
- $17,970
- Reserves months
- —
- Total cash needed
- —
Loan-product check · same deal, 3 products live
Conventional
25% down · 7.5% · 30yr
- Down + closing
- —
- Monthly P&I
- —
- Monthly cashflow
- —
- DSCR
- —
- Eligible?
- —
Personal DTI + credit; lowest rate.
DSCR
20% down · 8.5% · 30yr
- Down + closing
- —
- Monthly P&I
- —
- Monthly cashflow
- —
- DSCR
- —
- Eligible?
- —
No personal income docs; deal must DSCR.
Hard money
10% down · 12.0% · 12mo
- Down + closing
- —
- Monthly P&I
- —
- Monthly cashflow
- —
- DSCR
- —
- Eligible?
- —
Short-term bridge; refi at stabilization.
Rent comps 2 comps
| Address | Beds | Baths | Sqft | Rent | $/sqft | DOM | Units | Dist |
|---|---|---|---|---|---|---|---|---|
| 42021 Banbury Ct Northville, MI | 5.0 | 3.0 | 2600 | $3,623 | $1.39 | 16d | 1 | 0.50mi |
| 16646 Brooklane Blvd Northville, MI | 4.0 | 4.5 | 3282 | $13,300 | $4.05 | 16d | 1 | 1.47mi |
HOA detail
- Monthly dues
- $23 · $276/yr
Listing history 50 events
-
2026-06-18days on market $599,000 Active 36 DOM
-
2026-06-17days on market $599,000 Active 35 DOM
-
2026-06-16days on market $599,000 Active 34 DOM
-
2026-06-15days on market $599,000 Active 33 DOM
-
2026-06-13days on market $599,000 Active 31 DOM
-
2026-06-09days on market $599,000 Active 27 DOM
-
2026-06-08days on market $599,000 Active 26 DOM
-
2026-06-07days on market $599,000 Active 25 DOM
-
2026-06-04days on market $599,000 Active 22 DOM
-
2026-06-03days on market $599,000 Active 21 DOM
-
2026-06-02days on market $599,000 Active 20 DOM
-
2026-06-01days on market $599,000 Active 19 DOM
-
2026-05-31days on market $599,000 Active 18 DOM
-
2026-05-13$599,000 Active 733-char remark
Show marketing remark (721 chars)
Welcome to this inviting 4-bedroom colonial home nestled in a peaceful cul-de-sac in the highly sought-after Northville School District. This well-maintained property offers a perfect blend of comfort and modern upgrades. Newer Hardwood Floors! Tastefully updated flooring throughout the main areas adds warmth and elegance. Newer Roof Recently installed, providing peace of mind for years to come. Updated Sump Pump Ensuring your home stays dry and comfortable. Finished Basement Expansive additional space for recreation, home office, or storage, tailored to your needs. Brand-New Heat Exchanger (2023) Enhancing your home's efficiency and comfort. Don't miss the opportunity to make this lovely colonial your new home.
-
2026-05-13$599,000 Active 721-char remark
Show marketing remark (721 chars)
Welcome to this inviting 4-bedroom colonial home nestled in a peaceful cul-de-sac in the highly sought-after Northville School District. This well-maintained property offers a perfect blend of comfort and modern upgrades. Newer Hardwood Floors! Tastefully updated flooring throughout the main areas adds warmth and elegance. Newer Roof Recently installed, providing peace of mind for years to come. Updated Sump Pump Ensuring your home stays dry and comfortable. Finished Basement Expansive additional space for recreation, home office, or storage, tailored to your needs. Brand-New Heat Exchanger (2023) Enhancing your home's efficiency and comfort. Don't miss the opportunity to make this lovely colonial your new home.
-
2024-12-15historical
-
2024-12-15historical
-
2024-11-12price $589,900
-
2024-11-12price $589,900
-
2024-10-24$599,900 Active
-
2024-10-24$599,900 Active
-
2024-10-22historical
-
2024-10-22historical
-
2024-09-22historical
-
2024-09-22historical
-
2024-08-15$599,900 Active
-
2024-08-15$599,900 Active
-
2013-04-23soldstatus $320,000
-
2013-04-08soldstatus $320,000
-
2013-04-08soldstatus $320,000
-
2013-03-11historical
-
2013-03-11historical
-
2013-02-16$329,900
-
2013-02-16$329,900
-
2003-10-03soldstatus $330,000
-
2003-07-14soldstatus $330,000
-
2003-07-14soldstatus $330,000
-
2003-06-10historical
-
2003-05-30$339,900
-
2003-05-30$339,900
-
2003-05-30historical
-
2003-03-28$339,900
-
2001-06-27soldstatus $293,500
-
2001-04-11soldstatus $293,500
-
2001-03-16$294,500
-
2001-02-01historical
-
2001-01-10$299,800
-
2001-01-08historical
-
2000-10-28$299,900
-
2000-10-28historical
ⓘ Source: listings_history table (triggers on properties + properties_extension) + one-shot
backfill from property_details.listing_events for pre-trigger history.
Tax reassessment forecast MI · Partial reset (capped growth)
- Current annual tax
- $6,122 · $510/mo
- Projected year-2 tax
- $7,673 · $639/mo
- Expected delta
- +$1,551/yr (+$129/mo · 25.3%)
ⓘ Screening estimate from a state-policy table — verify with the county assessor before closing.
Climate risk First Street
- Flood 1/10 Low FEMA zone X (unshaded) · 0% chance over 30 yrs
- Wildfire 1/10 Low
- Heat 3/10 Moderate 7 d/yr ≥97°F today · 15 d/yr by 30 yrs out
- Wind 2/10 Low
- Air quality 3/10 Moderate 2 unhealthy d/yr today · 4 by 30 yrs out
Nearby sold comps map
Loading sold comps map…
Walkable amenities ~0.75 mi
Loading nearby amenities…
Taxation est. · year 1
- Rental income
- $68,175
- − Mortgage interest
- −$33,553
- − Property taxes
- −$6,122
- − Insurance
- −$2,995
- − Repairs & maintenance
- −$5,454
- − Management
- −$5,454
- − HOA
- −$276
- − Depreciation
- −$17,425
- Taxable loss
- −$3,104
- Est. tax savings @ 24.0%
- +$745
- After-tax cash flow
- $7,516/yr
For passive investors: Depreciation is non-cash, so a rental often shows a tax loss while cash-flowing — sheltering income. Rental losses are passive: they offset passive income freely, and up to $25,000/yr can offset ordinary (W-2) income if you actively participate and your MAGI is under $100k (phasing out to $0 by $150k); unused losses carry forward. On sale, claimed depreciation is recaptured at up to 25%, and gains may owe capital-gains tax (a 1031 exchange can defer both). Figures are a year-1 estimate at your 24.0% rate — not tax advice; consult a CPA.
Schools (NCES district)
- District
- Plymouth-Canton Community Schools
- NCES district ID
- 2628560
- Math proficiency
- 58% ▼ -5.00%
- Reading proficiency
- 66% ▼ -1.00%
- Median HH income
- $82,996
- Composite
- 55.86/100
- National rank
- #1204
- State rank
- #27 of 540 in MI
Livability — Northville
- Score
- 88/100
- State rank
- #13
- US rank
- #205
Category grades
Schools grade is shown separately in the Schools card above.
Census & demographics
- City population
- 24,713
- Population (ZIP)
- 25,039
Population outlook (Wayne County) Hauer SSP2
- Today (2025)
- 1,675,273 people
- By 2030
- 1,620,300 · -3.3%
- By 2040
- 1,502,341 · -10.3%
- By 2050
- 1,384,039 · -17.4%
- By 2075
- 1,124,592 · -32.9%
- By 2100
- 881,193 · -47.4%
Race, ethnicity, and origin ACS 2023
- Neighborhood character
- Predominantly White (72%)
- Race & ethnicity
- White 72% Asian 19% Two or more races 5% Hispanic / Latino 4% Black 2%
- Common ancestry
- Romanian 9% Italian 3% Lithuanian 3%
- Foreign-born
- 20% · Canada, China, Jamaica
- Languages at home
- 77% English-only · Other Indo-European 7% Other Asian/Pacific 5% Chinese 3%
Political lean MEDSL · Wayne
- 2024 margin
- Strong D (+29.0) · D 62.7% · R 33.7% · Other 3.6%
- 2008→2024 swing
- -20.5pp toward R · 2008: 49.5pp · 2024: 29.0pp
- All cycles
- 2024: D+29.0 2020: D+38.1 2016: D+37.3 2012: D+46.9 2008: D+49.5
Not yet ingested
- Civics
- —
Market trends
- HPI YoY
- ▼ -198.06%
- Current HPI
- 176.9122
- Rent YoY
- —
- Metro
- —
- State GDP YoY
- ▲ 1.37%
- F500 in state
- 28
Industry mix (Fortune 500 HQ in MI)
| Industry | F500 HQs | Revenue |
|---|---|---|
| Automotive Parts | 3 | $48B |
|
||
| Automotive | 2 | $372B |
|
||
| Chemicals | 1 | $45B |
|
||
| Automotive Retail | 1 | $29B |
|
||
| Healthcare / Medical Devices | 1 | $23B |
|
||
| Automotive Technology | 1 | $20B |
|
||
Price history
+81.6% since first listed40 events — show timeline
- 2026-05-13 Listed $599,000 MiRealSource-MiMLS
- 2026-05-13 Listed $599,000 REALCOMP
- 2024-12-15 Listing Removed — MiRealSource-MiMLS
- 2024-12-15 Listing Removed — REALCOMP
- 2024-11-12 Price Changed $589,900 MiRealSource-MiMLS
- 2024-11-12 Price Changed $589,900 REALCOMP
- 2024-10-24 Listed $599,900 MiRealSource-MiMLS
- 2024-10-24 Listed $599,900 REALCOMP
- 2024-10-22 Coming Soon — MiRealSource-MiMLS
- 2024-10-22 Coming Soon — REALCOMP
- 2024-09-22 Listing Removed — MiRealSource-MiMLS
- 2024-09-22 Listing Removed — REALCOMP
- 2024-08-15 Listed $599,900 MiRealSource-MiMLS
- 2024-08-15 Listed $599,900 REALCOMP
- 2013-04-23 Sold (Public Records) $320,000 Public Records
- 2013-04-08 Sold (MLS) $320,000 MiRealSource-MiMLS
- 2013-04-08 Sold (MLS) $320,000 REALCOMP
- 2013-03-11 Listing Removed — MiRealSource-MiMLS
- 2013-03-11 Listing Removed — REALCOMP
- 2013-02-16 Listed $329,900 MiRealSource-MiMLS
- 2013-02-16 Listed $329,900 REALCOMP
- 2003-10-03 Sold (Public Records) $330,000 Public Records
- 2003-07-14 Sold (MLS) $330,000 MiRealSource-MiMLS
- 2003-07-14 Sold (MLS) $330,000 REALCOMP
- 2003-06-10 Listing Removed — MiRealSource-MiMLS
- 2003-05-30 Listing Removed — REALCOMP
- 2003-05-30 Listed $339,900 MiRealSource-MiMLS
- 2003-05-30 Listed $339,900 REALCOMP
- 2003-03-28 Listed $339,900 REALCOMP
- 2001-06-27 Sold (Public Records) $293,500 Public Records
- 2001-04-11 Sold (MLS) $293,500 REALCOMP
- 2001-03-16 Listed $294,500 REALCOMP
- 2001-02-01 Listing Removed — REALCOMP
- 2001-01-10 Listed $299,800 REALCOMP
- 2001-01-08 Listing Removed — REALCOMP
- 2000-10-28 Listing Removed — REALCOMP
- 2000-10-28 Listed $299,900 REALCOMP
- 2000-09-16 Listed $314,900 REALCOMP
- 2000-09-14 Listing Removed — REALCOMP
- 2000-08-28 Listed $329,800 REALCOMP
Property tax history
+2.7%/yrLatest (2025): $6,122 · +2.5% YoY. Source: county tax records.
Cash-flow waterfall
monthlySold comps — $/sqft
last 12 mo · ≤1 miLoading sold comps…