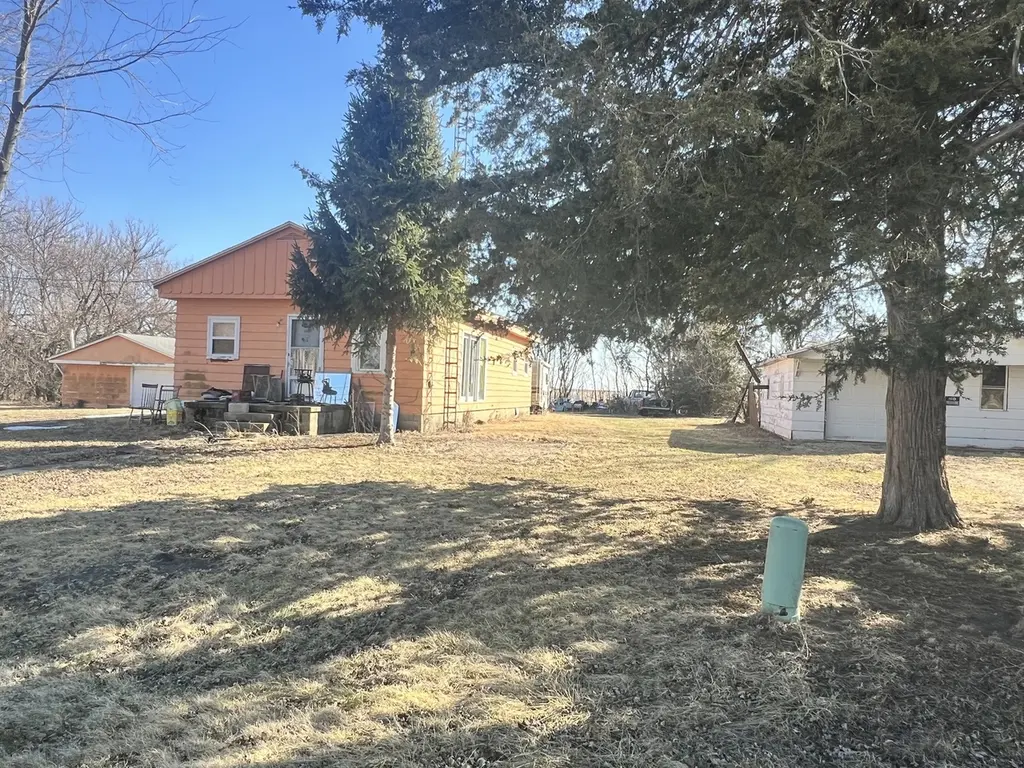
415 E 5th Ave · Rankin, IL
Flood risk 1/10 · Minimal
- FEMA flood zone
- X (unshaded)
- Chance of flooding over 30 yrs
- 0.0%
- Est. flood insurance / yr
- $473 – $860
Fire risk 1/10 · Minimal
- Est. fire insurance / yr
- $804 – $1,492
Heat risk 3/10 · Minor
- Hot days now (above 103°F)
- 7 days/yr
- Hot days in 30 yrs
- 18 days/yr
Wind risk 2/10 · Minimal
- Chance of severe wind over 30 yrs
- 2.0%
Air-quality risk 2/10 · Minimal
- Unhealthy air days now
- 1 days/yr
- Unhealthy air days in 30 yrs
- 1 days/yr
Risk factors via First Street. Map © Google.
Why this score? — see what drove the B+ grade
The composite is a weighted blend of 9 inputs, each scored 0–100. Each bar is that input's sub-score; the figure is the points it added to the 100-point composite (weight × sub-score).
- Cash flow +30.0/30.0
- ARV discount +15.0/15.0
- 1% rule +10.0/10.0
- DSCR +10.0/10.0
- Appreciation +5.4/10.0
- Livability +2.8/5.0
- Rent growth +2.5/5.0
- Condition / age +2.5/5.0
- Schools +1.0/10.0
$49,900
🖨 Deal sheet 📄 Offer letter ✓ Due diligence
Listing remarks MLS
Small Town living. Being sold as is/where is. Estimated information. Spacious lot. Owner will get cleaned up when it warms up. Plumbing needs attention.
Key facts
- Spacious lot
- 0.4 acre lot
- Garage
Tags
Neighborhood map
What this means for you Summary
Snapshot
- This is a 2-bed/1.0-bath other listed at $50k.
Deal economics
- At list price, monthly cash flow is $421 ($5k/yr) — positive.
- The deal already cash-flows at list — no discount required.
- Meets the 1% rule at list price ($926 rent vs $50k).
- Recommended offer: $45k (9.0% below list) — sets the bar for market timing.
Location & tenants
- Location reads 55/100 on livability (#1,248 in IL) — a working-class tenant base; expect higher turnover. Strengths: cost of living A+, housing A-; Watch: schools F, crime F, amenities F.
- Hoopeston Area CUSD 11 (town): math 9% / reading 15% proficiency, ranked #559 of 620 in IL (top 90%) — low school quality limits family demand, transient renter base, plan for 1-2y turnover.
- Market conditions: 16 active listings in the ZIP; 8 units permitted in Vermilion County in 2024 (0 in 5+ unit buildings).
Forward outlook
- In year one you build about $756 of equity ($345 loan paydown + $411 appreciation (0.8% local appreciation)).
- Vermilion County population projected at -24% by 2050 — secular population decline; favor cash flow + early exit over multi-decade hold.
- At projected returns (0.8% appreciation + 3.0% rent growth), your $14k cash investment doubles in ~3 years — after that, you're playing with house money.
Negotiation context
- It's been on market 112 days — a 9% lower offer ($45k) is reasonable based on typical stale-listing flexibility.
- 2 sale attempts since 18y ago with the ask held roughly flat each time — persistent listings suggest the price (not the market) is what's stuck; bring a comps-based counter.
- Current owner paid $15k; list at $50k implies a 233% gain — meaningful room to come down on a strong offer.
Questions for the listing agent
- It's been on market 112 days. Have you received any prior offers? Is the seller open to a 9% concession, seller financing, or rate buy-down credit?
- Why hasn't it sold? Are there any deal-killer items the seller is aware of (foundation, flood, title, zoning, code violations)?
- Is there a deadline driving the sale (1031 exchange, divorce, estate, relocation)? That informs how much negotiation room exists.
- Schools are F-rated, which usually means shorter tenancies and higher turnover. Who's the typical renter profile here, and what's been the actual vacancy rate?
- Crime grade is F in this area — have there been break-ins, vandalism, or insurance claims at this property in the last 3 years? What carrier currently insures it and at what premium?
- What's the average days-on-market for RENTAL listings here right now (not sales)? A rising rental-DOM trend means longer vacancies and softer asking-rent achievability than the comps imply.
- What's the recent tenant-quality profile in this submarket — average credit score on applications, eviction rate, late-payment / NSF rate, and stable-employment percentage? A property-management company in the area should have these aggregated.
- How much new for-sale + rental construction is in the pipeline within 1–3 miles? Heavy new supply typically softens prices + rents 12–24 months out; constrained supply supports both.
Investment metrics
- 1% rule
- 1.85% ✓
- Cap rate
- 16.41%
- Cash-on-cash
- 36.13%
- DSCR
- 2.61
- GRM
- 4.5
CMA / ARV
- ARV (median comp)
- $75,436
- List price
- $49,900
- Delta
- -33.85%
- Verdict
- UNDERPRICED
- Comps
- 1 within 2.0 mi
Projected returns pro-forma
0.82% appreciation · 3.0% rent growth · sell at horizon
- IRR
- 38.3%
- Equity multiple
- 2.95×
- Total profit
- $27,292
- Equity at exit
- $16,578
- IRR
- 40.6%
- Equity multiple
- 5.80×
- Total profit
- $67,086
- Equity at exit
- $21,682
Cash invested: $13,972 (down + closing). Projections, not guarantees.
Landlord ↔ Tenant lean methodology
- Overall (STATE)
- 43 Moderately Tenant-Leaning
- State Illinois
- 43 Moderately Tenant-Leaning · D+7
- County
- — inherits STATE
- City
- — inherits STATE
ZIP-level market 60960
- Home prices YoY
- 0.5%
- Active inventory
- 16
- Price-to-rent
- 4.5×
Monthly cashflow live
- Estimated rent
- $926 medium interval (Pro) →
- Mortgage (P&I)
- −$262
- Tax from tax record
- −$28 /mo · $336/yr
- Insurance
- −$21
- HOA
- −$0
- Vacancy / Maint / Mgmt
- −$194
- Net cashflow
- $421
Break-even live
UW: 25.0% down · 7.5% · 30yr · 1.5% tax · 5.0% vac · 8.0% maint · 8.0% mgmt
Financing live
Cash to close
- Down payment
- $12,475
- Closing costs
- $1,497
- Reserves months
- —
- Total cash needed
- —
Loan-product check · same deal, 3 products live
Conventional
25% down · 7.5% · 30yr
- Down + closing
- —
- Monthly P&I
- —
- Monthly cashflow
- —
- DSCR
- —
- Eligible?
- —
Personal DTI + credit; lowest rate.
DSCR
20% down · 8.5% · 30yr
- Down + closing
- —
- Monthly P&I
- —
- Monthly cashflow
- —
- DSCR
- —
- Eligible?
- —
No personal income docs; deal must DSCR.
Hard money
10% down · 12.0% · 12mo
- Down + closing
- —
- Monthly P&I
- —
- Monthly cashflow
- —
- DSCR
- —
- Eligible?
- —
Short-term bridge; refi at stabilization.
Listing history 20 events
-
2026-06-18days on market $49,900 Active 112 DOM
-
2026-06-17days on market $49,900 Active 111 DOM
-
2026-06-16days on market $49,900 Active 110 DOM
-
2026-06-15days on market $49,900 Active 109 DOM
-
2026-06-13days on market $49,900 Active 107 DOM
-
2026-06-12days on market $49,900 Active 106 DOM
-
2026-06-09days on market $49,900 Active 103 DOM
-
2026-06-08days on market $49,900 Active 102 DOM
-
2026-06-07days on market $49,900 Active 101 DOM
-
2026-06-07days on market $49,900 Active 100 DOM
-
2026-06-04days on market $49,900 Active 97 DOM
-
2026-06-02days on market $49,900 Active 96 DOM
-
2026-06-01days on market $49,900 Active 95 DOM
-
2026-05-31days on market $49,900 Active 94 DOM
-
2026-05-31days on market $49,900 Active 93 DOM
-
2026-02-26$49,900 Active 158-char remark
Show marketing remark (158 chars)
Small Town living. Being sold as is/where is. Estimated information. Spacious lot. Owner will get cleaned up when it warms up. Plumbing needs attention.
-
2022-03-31historical
-
2008-07-18soldstatus $15,000
-
2008-05-06$25,000
-
2002-04-24soldstatus $13,000
ⓘ Source: listings_history table (triggers on properties + properties_extension) + one-shot
backfill from property_details.listing_events for pre-trigger history.
Tax reassessment forecast IL · Partial reset (capped growth)
- Current annual tax
- $336 · $28/mo
- Projected year-2 tax
- $734 · $61/mo
- Expected delta
- +$398/yr (+$33/mo · 118.4%)
ⓘ Screening estimate from a state-policy table — verify with the county assessor before closing.
Climate risk First Street
- Flood 1/10 Low FEMA zone X (unshaded) · 0% chance over 30 yrs
- Wildfire 1/10 Low
- Heat 3/10 Moderate 7 d/yr ≥103°F today · 18 d/yr by 30 yrs out
- Wind 2/10 Low 2% chance of damaging wind over 30 yrs
- Air quality 2/10 Low 1 unhealthy d/yr today · 1 by 30 yrs out
Nearby sold comps map
Loading sold comps map…
Walkable amenities ~0.75 mi
Loading nearby amenities…
Taxation est. · year 1
- Rental income
- $11,107
- − Mortgage interest
- −$2,795
- − Property taxes
- −$336
- − Insurance
- −$250
- − Repairs & maintenance
- −$889
- − Management
- −$889
- − Depreciation
- −$1,452
- Taxable income
- $4,497
- Est. tax owed @ 24.0%
- −$1,079
- After-tax cash flow
- $3,969/yr
For passive investors: Depreciation is non-cash, so a rental often shows a tax loss while cash-flowing — sheltering income. Rental losses are passive: they offset passive income freely, and up to $25,000/yr can offset ordinary (W-2) income if you actively participate and your MAGI is under $100k (phasing out to $0 by $150k); unused losses carry forward. On sale, claimed depreciation is recaptured at up to 25%, and gains may owe capital-gains tax (a 1031 exchange can defer both). Figures are a year-1 estimate at your 24.0% rate — not tax advice; consult a CPA.
Schools (NCES district)
- District
- Hoopeston Area CUSD 11
- NCES district ID
- 1719660
- Math proficiency
- 9% ▼ -7.00%
- Reading proficiency
- 15% ▼ -3.00%
- Median HH income
- $40,897
- Composite
- 10.39/100
- National rank
- #9786
- State rank
- #559 of 620 in IL
Livability — Rankin
- Score
- 55/100
- State rank
- #1248
- US rank
- #23467
Category grades
Schools grade is shown separately in the Schools card above.
Census & demographics
- Census place
- Rankin, IL
- Population (ZIP)
- 890
Population outlook (Vermilion County) Hauer SSP2
- Today (2025)
- 72,775 people
- By 2030
- 69,235 · -4.9%
- By 2040
- 62,360 · -14.3%
- By 2050
- 55,539 · -23.7%
- By 2075
- 40,606 · -44.2%
- By 2100
- 26,985 · -62.9%
Race, ethnicity, and origin ACS 2023
- Neighborhood character
- Predominantly White (95%)
- Race & ethnicity
- White 95% Hispanic / Latino 4% Two or more races 1%
- Common ancestry
- Scottish 6% Romanian 4% German 2%
Political lean MEDSL · Vermilion
- 2024 margin
- Solid R (+35.7) · D 31.4% · R 67.0% · Other 1.6%
- 2008→2024 swing
- -36.2pp toward R · 2008: 0.6pp · 2024: -35.7pp
- All cycles
- 2024: R+35.7 2020: R+32.9 2016: R+29.2 2012: R+15.7 2008: D+0.6
Not yet ingested
- Civics
- —
Market trends
- HPI YoY
- ▲ 0.82%
- Current HPI
- 164.2254
- Rent YoY
- —
- Metro
- —
- State GDP YoY
- ▲ 1.59%
- F500 in state
- 60
Industry mix (Fortune 500 HQ in IL)
| Industry | F500 HQs | Revenue |
|---|---|---|
| Insurance | 4 | $201B |
|
||
| Consumer Goods | 4 | $87B |
|
||
| Industrial Machinery | 3 | $64B |
|
||
| Healthcare | 2 | $55B |
|
||
| Retail / Pharmacy | 1 | $148B |
|
||
| Agriculture / Food | 1 | $86B |
|
||
Price history
+283.8% since first listed5 events — show timeline
- 2026-02-26 Listed $49,900 MRED as Distributed by MLS Grid
- 2022-03-31 Listing Removed — MRED as Distributed by MLS Grid
- 2008-07-18 Sold (MLS) $15,000 MRED as Distributed by MLS Grid
- 2008-05-06 Listed $25,000 MRED as Distributed by MLS Grid
- 2002-04-24 Sold (Public Records) $13,000 Public Records
Property tax history
-1.5%/yrLatest (2018): $336 · -3.0% YoY. Source: county tax records.
Cash-flow waterfall
monthlySold comps — $/sqft
last 12 mo · ≤1 miLoading sold comps…