 Multi-family
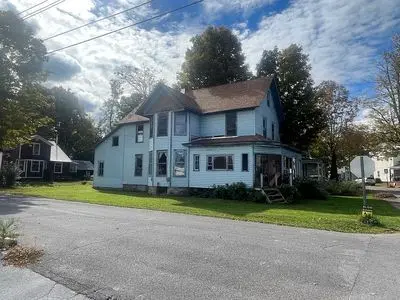
105 Seiter St · Boonville, NY
Flood risk 1/10 · Minimal
- FEMA flood zone
- X (unshaded)
- Chance of flooding over 30 yrs
- 0.0%
- Est. flood insurance / yr
- $473 – $860
Fire risk 3/10 · Minor
- Est. fire insurance / yr
- $691 – $1,283
Heat risk 1/10 · Minimal
- Hot days now (above 89°F)
- 7 days/yr
- Hot days in 30 yrs
- 16 days/yr
Wind risk 1/10 · Minimal
- Chance of severe wind over 30 yrs
- 0.0%
Air-quality risk 2/10 · Minimal
- Unhealthy air days now
- 0 days/yr
- Unhealthy air days in 30 yrs
- 1 days/yr
Risk factors via First Street. Map © Google.
Why this score? — see what drove the C grade
The composite is a weighted blend of 9 inputs, each scored 0–100. Each bar is that input's sub-score; the figure is the points it added to the 100-point composite (weight × sub-score).
- Cash flow +15.0/30.0
- Appreciation +10.0/10.0
- ARV discount +7.5/15.0
- 1% rule +5.0/10.0
- DSCR +5.0/10.0
- Schools +4.1/10.0
- Livability +4.0/5.0
- Rent growth +2.5/5.0
- Condition / age +2.5/5.0
$44,900
🖨 Deal sheet (PDF) 📄 Offer letter ✓ Due diligence
Multi-family units
County records classify this as Multi-Family (2-4 Unit). Listing-text estimate: 1 unit. estimate disagrees with records
Listing remarks
Investor Opportunity & acirc; & euro; & ldquo; 2,000 Sq Ft Full Gut Rehab & acirc; & euro; & ldquo; Ready to Finish Investor opportunity in Boonville. Property is fully gutted and ready to be finished, offering a clean slate for redevelopment. ? 2,000 sq ft ? Newer roofing shingles ? New underground water service from street ? New sewer line installed to the house ? Electric service from pole (two existing 100 amp services) ? New 200 amp panel ready for installation ? Solid stone foundation Previously configured as multi-family. Flexible layout allows restoration as duplex or conversion to a large single-family home. Interior access available. Property is gutted
Key facts
- New electric service
- Full gut rehab
- Flexible layout
Tags
Neighborhood map
What this means for you Summary
Snapshot
- This is a 4-bed/2.0-bath multifamily listed at $45k.
Deal economics
- At list price, monthly cash flow is $1k ($14k/yr) — positive.
- The deal already cash-flows at list — no discount required.
- Meets the 1% rule at list price ($2k rent vs $45k).
- Recommended offer: $44k (1.5% below list) — sets the bar for market timing.
- Cap rate 38.0% vs local median 3.6% in Boonville — top-decile yield for the area; either an underpriced asset or a hidden risk that comps aren't pricing in. Stress-test before assuming the spread holds.
Location & tenants
- Location reads 79/100 on livability (#146 in NY, #2,225 nationally) — a middle-class / working-renter tenant base. Strengths: cost of living A+, housing A+, health & safety A+; Watch: employment D, commute F.
- Adirondack Central School District (rural): math 41% / reading 54% proficiency, ranked #426 of 590 in NY (top 72%) — families likely to look elsewhere, expect single-tenant / working-renter base with shorter leases.
- Market conditions: 38 active listings in the ZIP; 204 units permitted in Oneida County in 2024 (68 in 5+ unit buildings).
Forward outlook
- In year one you build about $5k of equity ($310 loan paydown + $4k appreciation (10.0% local appreciation)).
- Oneida County population projected at -12% by 2050 — secular population decline; favor cash flow + early exit over multi-decade hold.
- At projected returns (10.0% appreciation + 3.0% rent growth), your $13k cash investment doubles in ~1 year — after that, you're playing with house money.
- By year 7, paydown + projected appreciation supports a ~$35k cash-out refi (75% LTV) — recoverable capital for the next deal without selling this one.
Negotiation context
- It's been on market 25 days — a 2% lower offer ($44k) is reasonable based on typical stale-listing flexibility.
Questions for the listing agent
- Built in 1970 — when were the roof, HVAC, electrical panel, plumbing, and water heater last replaced?
- Is there a deadline driving the sale (1031 exchange, divorce, estate, relocation)? That informs how much negotiation room exists.
- What's the average days-on-market for RENTAL listings here right now (not sales)? A rising rental-DOM trend means longer vacancies and softer asking-rent achievability than the comps imply.
- What's the recent tenant-quality profile in this submarket — average credit score on applications, eviction rate, late-payment / NSF rate, and stable-employment percentage? A property-management company in the area should have these aggregated.
- How much new apartment / multifamily construction is in the pipeline within 1–3 miles? Heavy new supply (>2% of stock underway) typically softens rents 12–24 months out; light construction supports rent growth.
Investment metrics
- 1% rule
- 4.28% ✓
- Cap rate
- 38.02%
- Cash-on-cash
- 113.30%
- DSCR
- 6.04
- GRM
- 1.9
CMA / ARV
- ARV (on-the-fly)
- $160,370
- Comps found
- 1
Show comp detail 1 sale within ~0.75 mi
| Address | Dist | Beds/Ba | Sqft | Sold | Price | $/sf | Match |
|---|---|---|---|---|---|---|---|
| 517 Main | 0.39mi | 3/3.0 (-1) | 1,993 (-2%) | 6mo | $158,400 | $79 | 64 |
Match score weights: distance 35% · size 25% · config 20% · recency 20%. Top-matched comps best support the ARV.
Projected returns pro-forma
10.0% appreciation · 3.0% rent growth · sell at horizon
- IRR
- —
- Equity multiple
- 8.96×
- Total profit
- $100,094
- Equity at exit
- $40,449
- IRR
- —
- Equity multiple
- 19.72×
- Total profit
- $235,393
- Equity at exit
- $87,231
Cash invested: $12,572 (down + closing). Projections, not guarantees.
Landlord ↔ Tenant lean methodology
- Overall (STATE)
- 15 Strongly Tenant-Friendly
- State New York
- 15 Strongly Tenant-Friendly · D+10
- County
- — inherits STATE
- City
- — inherits STATE
ZIP-level market 13309
- Home prices YoY
- 24.5%
- Active inventory
- 38
- Price-to-rent
- 3.9×
Monthly cashflow live
- Estimated rent
- $1,921 medium interval (Pro) →
- Mortgage (P&I)
- −$235
- Tax from tax record
- −$76 /mo · $917/yr
- Insurance
- −$19
- HOA
- −$0
- Vacancy / Maint / Mgmt
- −$403
- Net cashflow
- $1,187
Break-even live
Sensitivity live
| Price | -10% $1,212 | -5% $1,200 | +0% $1,187 | +5% $1,174 | +10% $1,162 |
|---|---|---|---|---|---|
| Rent | -10% $1,035 | -5% $1,111 | +0% $1,187 | +5% $1,263 | +10% $1,339 |
| Rate | -1.0pp $1,210 | -0.5pp $1,198 | base $1,187 | +0.5pp $1,175 | +1.0pp $1,164 |
2-unit breakdown (identical units grouped — click to expand)
| Units | Beds | Baths | Est. rent |
|---|---|---|---|
| 2× units | 2 | 1 | $1,920 |
| #1 | 2 | 1 | $960 |
| #2 | 2 | 1 | $960 |
| Total (2 units) | $1,921 | ||
UW: 25.0% down · 7.5% · 30yr · 1.5% tax · 5.0% vac · 8.0% maint · 8.0% mgmt
Financing live
Cash to close
- Down payment
- $11,225
- Closing costs
- $1,347
- Reserves months
- —
- Total cash needed
- —
Loan-product check · same deal, 3 products live
Conventional
25% down · 7.5% · 30yr
- Down + closing
- —
- Monthly P&I
- —
- Monthly cashflow
- —
- DSCR
- —
- Eligible?
- —
Personal DTI + credit; lowest rate.
DSCR
20% down · 8.5% · 30yr
- Down + closing
- —
- Monthly P&I
- —
- Monthly cashflow
- —
- DSCR
- —
- Eligible?
- —
No personal income docs; deal must DSCR.
Hard money
10% down · 12.0% · 12mo
- Down + closing
- —
- Monthly P&I
- —
- Monthly cashflow
- —
- DSCR
- —
- Eligible?
- —
Short-term bridge; refi at stabilization.
Listing history 16 events
-
2026-06-21days on market $44,900 Active 25 DOM
-
2026-06-18days on market $44,900 Active 23 DOM
-
2026-06-17days on market $44,900 Active 22 DOM
-
2026-06-16days on market $44,900 Active 21 DOM
-
2026-06-15days on market $44,900 Active 20 DOM
-
2026-06-13days on market $44,900 Active 18 DOM
-
2026-06-12days on market $44,900 Active 17 DOM
-
2026-06-09days on market $44,900 Active 14 DOM
-
2026-06-08days on market $44,900 Active 13 DOM
-
2026-06-07days on market $44,900 Active 12 DOM
-
2026-06-07days on market $44,900 Active 11 DOM
-
2026-06-04days on market $44,900 Active 8 DOM
-
2026-06-02days on market $44,900 Active 7 DOM
-
2026-06-01days on market $44,900 Active 6 DOM
-
2026-05-31days on market $44,900 Active 5 DOM
-
2026-05-26$44,900 Active
ⓘ Source: listings_history table (triggers on properties + properties_extension) + one-shot
backfill from property_details.listing_events for pre-trigger history.
Tax reassessment forecast NY · Partial reset (capped growth)
- Current annual tax
- $917 · $76/mo
- Projected year-2 tax
- $917 · $76/mo
- Expected delta
- $0/yr ($0/mo · 0.0%)
ⓘ Screening estimate from a state-policy table — verify with the county assessor before closing.
Climate risk First Street
- Flood 1/10 Low FEMA zone X (unshaded) · 0% chance over 30 yrs
- Wildfire 3/10 Moderate
- Heat 1/10 Low 7 d/yr ≥89°F today · 16 d/yr by 30 yrs out
- Wind 1/10 Low 0% chance of damaging wind over 30 yrs
- Air quality 2/10 Low 0 unhealthy d/yr today · 1 by 30 yrs out
Nearby sold comps map
Loading sold comps map…
Walkable amenities ~0.75 mi
Loading nearby amenities…
Taxation est. · year 1
- Rental income
- $23,052
- − Mortgage interest
- −$2,515
- − Property taxes
- −$917
- − Insurance
- −$224
- − Repairs & maintenance
- −$1,844
- − Management
- −$1,844
- − Depreciation
- −$1,306
- Taxable income
- $14,401
- Est. tax owed @ 24.0%
- −$3,456
- After-tax cash flow
- $10,788/yr
For passive investors: Depreciation is non-cash, so a rental often shows a tax loss while cash-flowing — sheltering income. Rental losses are passive: they offset passive income freely, and up to $25,000/yr can offset ordinary (W-2) income if you actively participate and your MAGI is under $100k (phasing out to $0 by $150k); unused losses carry forward. On sale, claimed depreciation is recaptured at up to 25%, and gains may owe capital-gains tax (a 1031 exchange can defer both). Figures are a year-1 estimate at your 24.0% rate — not tax advice; consult a CPA.
Schools (NCES district)
- District
- Adirondack Central School District
- NCES district ID
- 3605040
- Math proficiency
- 41% ▼ -5.00%
- Reading proficiency
- 54% ▲ 5.00%
- Median HH income
- $50,343
- Composite
- 40.7/100
- National rank
- #3669
- State rank
- #426 of 590 in NY
Livability — Boonville
- Score
- 79/100
- State rank
- #146
- US rank
- #2225
Category grades
Schools grade is shown separately in the Schools card above.
Census & demographics
- Census place
- Boonville, NY
- City population
- 5,828
- Population (ZIP)
- 5,828
Population outlook (Oneida County) Hauer SSP2
- Today (2025)
- 225,223 people
- By 2030
- 220,384 · -2.1%
- By 2040
- 209,071 · -7.2%
- By 2050
- 197,920 · -12.1%
- By 2075
- 175,541 · -22.1%
- By 2100
- 148,491 · -34.1%
Race, ethnicity, and origin ACS 2023
- Neighborhood character
- Predominantly White (95%)
- Race & ethnicity
- White 95% Two or more races 4%
- Common ancestry
- Romanian 10% Lithuanian 5% Slovak 3%
- Foreign-born
- 0%
Political lean MEDSL · Oneida
- 2024 margin
- Strong R (+21.3) · D 39.4% · R 60.6%
- 2008→2024 swing
- -15.2pp toward R · 2008: -6.1pp · 2024: -21.3pp
- All cycles
- 2024: R+21.3 2020: R+15.5 2016: R+21.1 2012: R+5.3 2008: R+6.1
Not yet ingested
- Civics
- —
Market trends
- HPI YoY
- ▲ 83.52%
- Current HPI
- 425.0098
- Rent YoY
- —
- Metro
- —
- State GDP YoY
- ▲ 2.60%
- F500 in state
- 92
Industry mix (Fortune 500 HQ in NY)
| Industry | F500 HQs | Revenue |
|---|---|---|
| Financial Services | 10 | $950B |
|
||
| Consumer Goods | 9 | $162B |
|
||
| Insurance | 4 | $225B |
|
||
| Telecommunications | 2 | $144B |
|
||
| Pharmaceuticals | 2 | $112B |
|
||
| Media / Entertainment | 2 | $69B |
|
||
Price history
1 event — show timeline
- 2026-05-26 Listed $44,900 FSBO.com
Property tax history
-2.9%/yrLatest (2025): $917 · -26.3% YoY. Source: county tax records.
Cash-flow waterfall
monthlySold comps — $/sqft
last 12 mo · ≤1 miLoading sold comps…