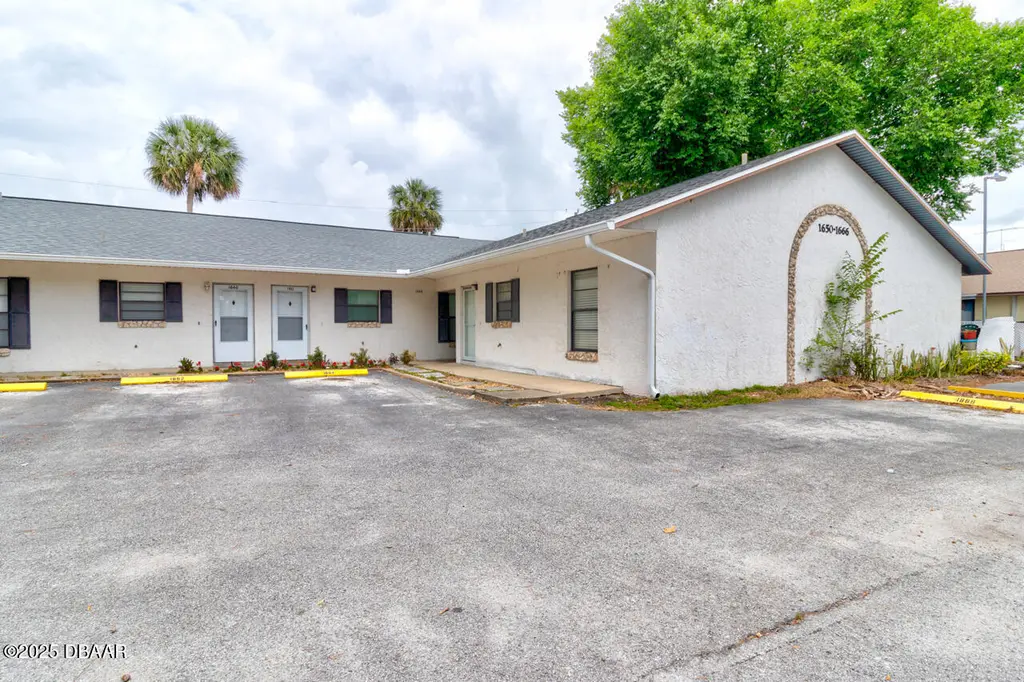
1662 Espanola Ave · Holly Hill, FL
Flood risk 6/10 · Moderate
- FEMA flood zone
- X (shaded)
- Chance of flooding over 30 yrs
- 0.57%
- Est. flood insurance / yr
- $507 – $1,088
Fire risk 1/10 · Minimal
- Est. fire insurance / yr
- $947 – $1,759
Heat risk 10/10 · Severe
- Hot days now (above 104°F)
- 7 days/yr
- Hot days in 30 yrs
- 20 days/yr
Wind risk 10/10 · Severe
- Chance of severe wind over 30 yrs
- 99.0%
Air-quality risk 3/10 · Minor
- Unhealthy air days now
- 3 days/yr
- Unhealthy air days in 30 yrs
- 3 days/yr
Risk factors via First Street. Map © Google.
Why this score? — see what drove the C- grade
The composite is a weighted blend of 9 inputs, each scored 0–100. Each bar is that input's sub-score; the figure is the points it added to the 100-point composite (weight × sub-score).
- Cash flow +21.0/30.0
- ARV discount +7.5/15.0
- DSCR +6.7/10.0
- 1% rule +6.0/10.0
- Schools +3.9/10.0
- Livability +3.6/5.0
- Rent growth +2.8/5.0
- Condition / age +2.5/5.0
- Appreciation +0.0/10.0
$138,000
🖨 Deal sheet 📄 Offer letter ✓ Due diligence
Listing remarks
* * * PRICE REDUCTION * * * Discover this beautifully renovated unit, offering an exceptional turnkey investment opportunity in a prime location just 15 minutes from the beach. Generating immediate cashflow. Recently updated with AC, water heater (2019), and a new roof (2022), this property allows for flexible short-term or long-term rentals. Inside, enjoy the seamless tile flooring, a modern kitchen with new appliances, updated light fixtures, and a fresh bathroom. The unit also features a fenced-in patio for privacy and the convenience of in-unit laundry. With updated ventilation and energy-saving systems, this property is move-in ready and promises excellent potential for investor
Key facts
- Fenced-in patio
- In-unit laundry
- Updated ventilation
Tags
Property features AI
Finance
- Other: Pets allowed with breed restrictions
- HOA & community: Homeowners association with a $190 monthly fee
Exterior
- Parking: Assigned parking
- Utilities: Public water; Public sewer; Water service available
- Home design: Single-family residence; One story; Attached property
- Construction: Block, concrete and stucco construction
- Exterior features: Patio; Rear porch; Fenced yard; Shingle roof; Paved road access; Lot dimensions approximately 25 x 59
Interior
- Kitchen: Refrigerator; Microwave; Disposal; Dishwasher
- Bedrooms: Total rooms: 5
- Flooring: Tile
- Bathrooms: 1 full bathroom
- Heating & cooling: Central heating; Central air; Ceiling fans
- Interior features: Ceiling fans throughout; Unfurnished
- Laundry & utility: Dryer
Neighborhood map
What this means for you Summary
Snapshot
- This is a 2-bed/1.0-bath single-family listed at $138k.
Deal economics
- At list price, monthly cash flow is $193 ($2k/yr) — positive.
- The deal already cash-flows at list — no discount required.
- Meets the 1% rule at list price ($2k rent vs $138k).
- Recommended offer: $136k (1.5% below list) — sets the bar for market timing.
Location & tenants
- Location reads 72/100 on livability (#325 in FL) — a middle-class / working-renter tenant base. Strengths: cost of living A+, housing A+, health & safety A+; Watch: schools F, amenities F, commute F.
- Volusia (suburban): math 44% / reading 49% proficiency, ranked #47 of 73 in FL (top 64%) — families likely to look elsewhere, expect single-tenant / working-renter base with shorter leases.
- Market conditions: Rents rising (+1.0%/yr); 332 active listings in the ZIP; 27 comparable units currently listed for rent nearby; rentals at typical pace (median 23d on market — plan ~3-4 weeks tenant-placement turnaround); 3,402 units permitted in Volusia County in 2024 (681 in 5+ unit buildings).
- This rent runs 32% of the median local income ($56k/yr) — at the standard rent-burdened threshold; future hikes will face affordability resistance.
Forward outlook
- Local home prices are declining (-3.0%/yr); year-one equity from $954 of loan paydown is wiped out by about $4k of value loss. Plan a longer hold.
- Volusia County population projected at +19% by 2050 — long-run rental-demand tailwind backs the buy-and-hold thesis.
Negotiation context
- It's been on market 17 days — a 2% lower offer ($136k) is reasonable based on typical stale-listing flexibility.
- 6 sale attempts since 20y ago with the ask held roughly flat each time — persistent listings suggest the price (not the market) is what's stuck; bring a comps-based counter.
- Current owner paid $54k; list at $138k implies a 158% gain — meaningful room to come down on a strong offer.
Risks & watch-outs
- Climate carrying-cost: major flood risk; severe wind risk, 99% chance of damaging wind over 30y; extreme-heat days projected 7→20/yr by 2055 (HVAC capex compounding) — expect insurance premiums to compound above CPI over the hold.
Questions for the listing agent
- What does the HOA fee cover, when was the last increase, and are there any pending special assessments or reserve-fund shortfalls?
- Is there a deadline driving the sale (1031 exchange, divorce, estate, relocation)? That informs how much negotiation room exists.
- Schools are F-rated, which usually means shorter tenancies and higher turnover. Who's the typical renter profile here, and what's been the actual vacancy rate?
- What's the average days-on-market for RENTAL listings here right now (not sales)? A rising rental-DOM trend means longer vacancies and softer asking-rent achievability than the comps imply.
- What's the recent tenant-quality profile in this submarket — average credit score on applications, eviction rate, late-payment / NSF rate, and stable-employment percentage? A property-management company in the area should have these aggregated.
- How much new for-sale + rental construction is in the pipeline within 1–3 miles? Heavy new supply typically softens prices + rents 12–24 months out; constrained supply supports both.
Investment metrics
- 1% rule
- 1.10% ✓
- Cap rate
- 7.97%
- Cash-on-cash
- 6.01%
- DSCR
- 1.27
- GRM
- 7.6
CMA / ARV
No comps found within radius.
Projected returns pro-forma
-3.0% appreciation · 1.01% rent growth · sell at horizon
- IRR
- -9.4%
- Equity multiple
- 0.66×
- Total profit
- $-12,970
- Equity at exit
- $20,576
- IRR
- -3.0%
- Equity multiple
- 0.82×
- Total profit
- $-6,960
- Equity at exit
- $11,932
Cash invested: $38,640 (down + closing). Projections, not guarantees.
Landlord ↔ Tenant lean methodology
- Overall (STATE)
- 87 Strongly Landlord-Friendly
- State Florida
- 87 Strongly Landlord-Friendly · R+3
- County
- — inherits STATE
- City
- — inherits STATE
ZIP-level market 32117
- Home prices YoY
- -8.2%
- Rents YoY
- 1.0%
- Active inventory
- 332
- Price-to-rent
- 7.6×
Monthly cashflow live
- Estimated rent
- $1,518 high interval (Pro) →
- Mortgage (P&I)
- −$724
- Tax from tax record
- −$34 /mo · $412/yr
- Insurance
- −$58
- HOA
- −$190
- Vacancy / Maint / Mgmt
- −$319
- Net cashflow
- $193
Break-even live
UW: 25.0% down · 7.5% · 30yr · 1.5% tax · 5.0% vac · 8.0% maint · 8.0% mgmt
Financing live
Cash to close
- Down payment
- $34,500
- Closing costs
- $4,140
- Reserves months
- —
- Total cash needed
- —
Loan-product check · same deal, 3 products live
Conventional
25% down · 7.5% · 30yr
- Down + closing
- —
- Monthly P&I
- —
- Monthly cashflow
- —
- DSCR
- —
- Eligible?
- —
Personal DTI + credit; lowest rate.
DSCR
20% down · 8.5% · 30yr
- Down + closing
- —
- Monthly P&I
- —
- Monthly cashflow
- —
- DSCR
- —
- Eligible?
- —
No personal income docs; deal must DSCR.
Hard money
10% down · 12.0% · 12mo
- Down + closing
- —
- Monthly P&I
- —
- Monthly cashflow
- —
- DSCR
- —
- Eligible?
- —
Short-term bridge; refi at stabilization.
Rent comps 27 comps
| Address | Beds | Baths | Sqft | Rent | $/sqft | DOM | Units | Dist |
|---|---|---|---|---|---|---|---|---|
| 1540 Espanola Ave Unit 9 Daytona Beach, FL | 1.0 | 1.0 | 600 | $900 | $1.50 | 23d | 1 | 0.28mi |
| 1521 Moravia Ave Daytona Beach, FL | 2.0 | 2.0 | 700 | $2,000 | $2.86 | 18d | 1 | 0.57mi |
| 1355 Hiawatha Ave Daytona Beach, FL | 2.0 | 1.0 | 780 | $1,675 | $2.15 | 14d | 1 | 0.63mi |
| 946 15th St Daytona Beach, FL | 2.0 | 2.0 | 1010 | $1,500 | $1.49 | 23d | 1 | 0.92mi |
| 1563 Hancock Ln Daytona Beach, FL | 2.0 | 2.0 | 912 | $1,475 | $1.62 | 11d | 1 | 0.92mi |
| 3009 N Halifax Ave #1 Daytona Beach, FL | 2.0 | 1.5 | 816 | $1,650 | $2.02 | 23d | 1 | 0.94mi |
| 3009 N Halifax Ave #2 Daytona Beach, FL | 1.0 | 1.0 | 612 | $1,250 | $2.04 | 23d | 1 | 0.94mi |
| 2711 N Halifax Ave Daytona Beach, FL | 1.0–2.0 | 1.0 | 785 | $1,675 | $2.13 | 14d | 3 | 0.97mi |
| 2711 N Halifax Ave Daytona Beach, FL | 1.0–2.0 | 1.0 | 785 | $1,675 | $2.13 | 23d | 2 | 0.97mi |
| 410 Sauls St Ormond Beach, FL | 3.0 | 1.0 | 990 | $1,500 | $1.52 | 23d | 1 | 1.00mi |
| 638 LPGA Blvd Unit B Daytona Beach, FL | 3.0 | 2.0 | 1111 | $2,490 | $2.24 | 23d | 1 | 1.11mi |
| 1707 Evergreen St Ormond Beach, FL | 2.0 | 1.0 | 868 | $1,750 | $2.02 | 23d | 1 | 1.13mi |
| 1559 Hammock Dr Unit B Holly Hill, FL | 2.0 | 1.5 | 1100 | $1,375 | $1.25 | 14d | 1 | 1.17mi |
| 900 LPGA Blvd Daytona Beach, FL | 1.0–2.0 | 1.0–2.0 | 885 | $1,495 | $1.69 | 14d | 14 | 1.20mi |
| 2609 N Oleander Ave Unit 17 Daytona Beach, FL | 2.0 | 1.5 | 950 | $1,180 | $1.24 | 14d | 1 | 1.26mi |
| 2417 N Oleander Ave Unit 5 Daytona Beach, FL | 2.0 | 1.0 | 850 | $1,450 | $1.71 | 23d | 1 | 1.28mi |
| 921 Daytona Ave Unit A Daytona Beach, FL | 2.0 | 1.0 | 1100 | $1,775 | $1.61 | 23d | 1 | 1.32mi |
| 400 Auburn Dr #3 Daytona Beach, FL | 2.0 | 1.0 | 945 | $1,350 | $1.43 | 23d | 1 | 1.34mi |
| 851 State Ave Daytona Beach, FL | 2.0 | 1.0 | 682 | $1,495 | $2.19 | 23d | 1 | 1.35mi |
| 501 Plaza Blvd Unit A Daytona Beach, FL | 2.0 | 1.0 | 800 | $1,500 | $1.88 | 23d | 1 | 1.40mi |
| 2727 N Atlantic Ave Apt 503 Daytona Beach, FL | 1.0 | 1.0 | 600 | $1,400 | $2.33 | 23d | 1 | 1.41mi |
| 820 State Ave Unit 2 Daytona Beach, FL | 2.0 | 1.0 | 690 | $1,250 | $1.81 | 23d | 1 | 1.43mi |
| 820 State Ave Apt 1 Daytona Beach, FL | 2.0 | 2.0 | 841 | $1,470 | $1.75 | 23d | 1 | 1.43mi |
| 820 State Ave Unit 3 Daytona Beach, FL | 2.0 | 1.0 | 841 | $1,370 | $1.63 | 23d | 1 | 1.44mi |
| 432 Auburn Dr #204 Daytona Beach, FL | 2.0 | 1.0 | 992 | $1,350 | $1.36 | 23d | 1 | 1.47mi |
| 16 Oriole Cir Unit A Ormond Beach, FL | 2.0 | 1.0 | 675 | $1,500 | $2.22 | 23d | 1 | 1.47mi |
| 840 Center Ave Apt 75 Holly Hill, FL | 2.0 | 1.0 | 900 | $1,250 | $1.39 | 23d | 1 | 1.48mi |
HOA detail
- Monthly dues
- $190 · $2,280/yr
- Likely covers
- water
Listing history 13 events
-
2026-06-18days on market $138,000 Active 17 DOM
-
2026-06-17days on market $138,000 Active 16 DOM
-
2026-06-16days on market $138,000 Active 15 DOM
-
2026-06-15days on market $138,000 Active 14 DOM
-
2026-06-14days on market $138,000 Active 12 DOM
-
2026-06-10days on market $138,000 Active 9 DOM
-
2026-06-09days on market $138,000 Active 8 DOM
-
2026-06-08days on market $138,000 Active 7 DOM
-
2026-06-07days on market $138,000 Active 6 DOM
-
2026-06-05days on market $138,000 Active 3 DOM
-
2026-06-03days on market $138,000 Active 2 DOM
-
2026-06-01remarks 699-char remark
-
2026-06-01$138,000 Active 1 DOM
ⓘ Source: listings_history table (triggers on properties + properties_extension) + one-shot
backfill from property_details.listing_events for pre-trigger history.
Tax reassessment forecast FL · Resets to sale price
- Current annual tax
- $412 · $34/mo
- Projected year-2 tax
- $1,145 · $95/mo
- Expected delta
- +$733/yr (+$61/mo · 177.8%)
ⓘ Screening estimate from a state-policy table — verify with the county assessor before closing.
Climate risk First Street
- Flood 6/10 Major FEMA zone X (shaded) · 57% chance over 30 yrs
- Wildfire 1/10 Low
- Heat 10/10 Extreme 7 d/yr ≥104°F today · 20 d/yr by 30 yrs out
- Wind 10/10 Extreme 99% chance of damaging wind over 30 yrs
- Air quality 3/10 Moderate 3 unhealthy d/yr today · 3 by 30 yrs out
Nearby sold comps map
Loading sold comps map…
Walkable amenities ~0.75 mi
Loading nearby amenities…
Taxation est. · year 1
- Rental income
- $18,212
- − Mortgage interest
- −$7,730
- − Property taxes
- −$412
- − Insurance
- −$690
- − Repairs & maintenance
- −$1,457
- − Management
- −$1,457
- − HOA
- −$2,280
- − Depreciation
- −$4,015
- Taxable income
- $171
- Est. tax owed @ 24.0%
- −$41
- After-tax cash flow
- $2,280/yr
For passive investors: Depreciation is non-cash, so a rental often shows a tax loss while cash-flowing — sheltering income. Rental losses are passive: they offset passive income freely, and up to $25,000/yr can offset ordinary (W-2) income if you actively participate and your MAGI is under $100k (phasing out to $0 by $150k); unused losses carry forward. On sale, claimed depreciation is recaptured at up to 25%, and gains may owe capital-gains tax (a 1031 exchange can defer both). Figures are a year-1 estimate at your 24.0% rate — not tax advice; consult a CPA.
Schools (NCES district)
- District
- Volusia
- NCES district ID
- 1201920
- Math proficiency
- 44% ▼ -9.00%
- Reading proficiency
- 49% ▼ -3.00%
- Median HH income
- $42,946
- Composite
- 39.2/100
- National rank
- #4019
- State rank
- #47 of 73 in FL
Livability — Holly Hill
- Score
- 72/100
- State rank
- #325
- US rank
- #5737
Category grades
Schools grade is shown separately in the Schools card above.
Census & demographics
- Census place
- Holly Hill, FL
- County
- Volusia County · 556,871 people
- Metro
- Deltona-Daytona Beach-Ormond Beach, FL
- Population (ZIP)
- 30,955
- Household income
- $56,419
- Rent vs Own
- Severe rent burden
- 1781.0
Population outlook (Volusia County) Hauer SSP2
- Today (2025)
- 572,749 people
- By 2030
- 598,695 · +4.5%
- By 2040
- 644,880 · +12.6%
- By 2050
- 681,451 · +19.0%
- By 2075
- 759,957 · +32.7%
- By 2100
- 778,902 · +36.0%
Race, ethnicity, and origin ACS 2023
- Neighborhood character
- Diverse neighborhood (Simpson 0.63)
- Race & ethnicity
- White 53% Black 27% Hispanic / Latino 10% Two or more races 9% Asian 3%
- Hispanic origin (detail)
- Mexican 2% Puerto Rican 3%
- Common ancestry
- Romanian 2% Lithuanian 2% Slovak 1%
- Foreign-born
- 8% · Canada, Vietnam, Jamaica
- Languages at home
- 86% English-only · Spanish 8% Vietnamese 1% Other Indo-European 1%
Political lean MEDSL · Volusia
- 2024 margin
- Strong R (+21.8) · D 38.7% · R 60.5%
- 2008→2024 swing
- -27.4pp toward R · 2008: 5.7pp · 2024: -21.8pp
- All cycles
- 2024: R+21.8 2020: R+14.1 2016: R+13.1 2012: R+1.2 2008: D+5.7
Not yet ingested
- Civics
- —
Market trends
- HPI YoY
- ▼ -96.62%
- Current HPI
- 1084.54
- Rent YoY
- ▲ 1.01%
- Metro
- Deltona-Daytona Beach-Ormond Beach, FL
- State GDP YoY
- ▲ 3.28%
- F500 in state
- 36
Industry mix (Fortune 500 HQ in FL)
| Industry | F500 HQs | Revenue |
|---|---|---|
| Industrial Technology | 2 | $29B |
|
||
| Insurance | 2 | $17B |
|
||
| Retail | 1 | $60B |
|
||
| Technology Distribution | 1 | $58B |
|
||
| Homebuilding | 1 | $35B |
|
||
| Technology Manufacturing | 1 | $35B |
|
||
Price history
+157.9% since first listed14 events — show timeline
- 2026-05-29 Listed $138,000 Daytona MLS
- 2025-01-02 Listing Removed — Daytona MLS
- 2024-12-09 Price Changed $187,000 Daytona MLS
- 2024-10-18 Price Changed $190,000 Daytona MLS
- 2024-07-15 Listed $199,000 Daytona MLS
- 2024-05-08 Listing Removed — Daytona MLS
- 2024-05-01 Listed $220,000 Daytona MLS
- 2007-04-16 Listing Removed — Daytona MLS
- 2007-01-08 Listing Removed — Daytona MLS
- 2007-01-08 Listed $104,900 Daytona MLS
- 2006-09-19 Listing Removed — Daytona MLS
- 2006-09-16 Listed $104,900 Daytona MLS
- 2006-09-16 Listed $104,900 Daytona MLS
- 2002-07-31 Sold (Public Records) $53,500 Public Records
Property tax history
-6.6%/yrLatest (2025): $412 · +5.2% YoY. Source: county tax records.
Cash-flow waterfall
monthlySold comps — $/sqft
last 12 mo · ≤1 miLoading sold comps…