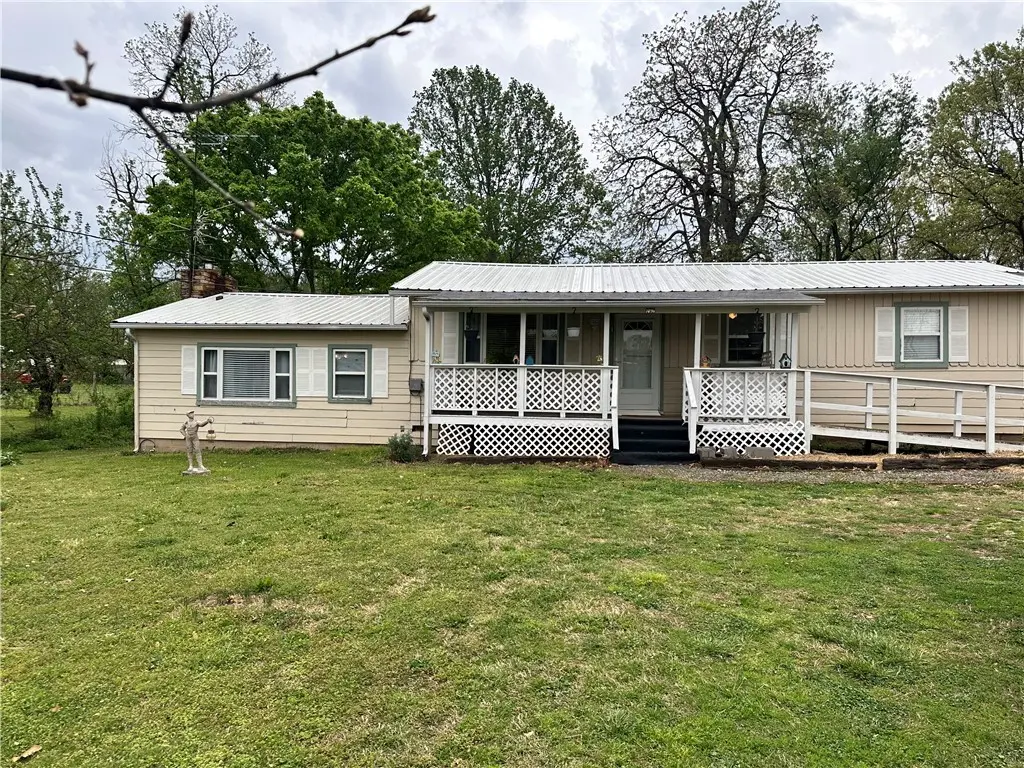
1096 S Hwy 59 · West Siloam Springs, OK
Flood risk 1/10 · Minimal
- FEMA flood zone
- X (unshaded)
- Chance of flooding over 30 yrs
- 0.0%
- Est. flood insurance / yr
- $507 – $1,088
Fire risk 7/10 · Major
- Est. fire insurance / yr
- $2,463 – $4,575
Heat risk 5/10 · Moderate
- Hot days now (above 107°F)
- 7 days/yr
- Hot days in 30 yrs
- 21 days/yr
Wind risk 2/10 · Minimal
- Chance of severe wind over 30 yrs
- 3.0%
Air-quality risk 2/10 · Minimal
- Unhealthy air days now
- 1 days/yr
- Unhealthy air days in 30 yrs
- 1 days/yr
Risk factors via First Street. Map © Google.
Why this score? — see what drove the C+ grade
The composite is a weighted blend of 9 inputs, each scored 0–100. Each bar is that input's sub-score; the figure is the points it added to the 100-point composite (weight × sub-score).
- Cash flow +17.5/30.0
- ARV discount +15.0/15.0
- Appreciation +9.9/10.0
- DSCR +5.5/10.0
- 1% rule +4.7/10.0
- Livability +3.1/5.0
- Condition / age +2.8/5.0
- Rent growth +2.5/5.0
- Schools +2.0/10.0
$180,000
🖨 Deal sheet (PDF) 📄 Offer letter ✓ Due diligence
Listing remarks
Less than a minute to Hwy 412! Great location! This is a framed home, not a mobile home, and it sits on 1ac mol with a metal roof and spacious decking on the front and back. This charming home would make a great investment, rental, or personal home for the right buyer! Lots of potential and space. Previous owner made additional living space out of the garage so there is an extra large living room with a great wood/pellet stove. Current owners added on a half bath, but there is room to make it into a full bath if you prefer. The acre is pretty clear and makes great space for a small homestead, hobby, etc. Reach out today to set up a showing!
Key facts
- Half bath
- Metal roof
- Wood pellet stove
Tags
Property features AI
Finance
- HOA & community: Monthly association fee
Exterior
- Parking: Gravel driveway (off-street parking)
- Utilities: Electricity available; Propane service
- Home design: Single-story home; Residential zoning; Entry level: Main; Metal roof; Frame construction
- Construction: Frame construction; Metal roof; Crawlspace foundation; Built 25+ years ago
- Exterior features: Covered porch; Deck; Gravel driveway; Full chain link fence; Property outside city limits; Highway frontage
Interior
- Kitchen: Dishwasher; Propane range; Range hood; Refrigerator; Propane water heater
- Bedrooms: Three main-level bedrooms
- Flooring: Laminate; Simulated wood; Vinyl; Wood
- Bathrooms: One full bathroom; One half bathroom
- Heating & cooling: Central heating (propane); Central electric air conditioning
- Interior features: Ceiling fans; Window treatments and blinds; Wood burning stove / pellet stove in family room; Crawlspace basement
- Laundry & utility: Washer hookup; Dryer hookup
Neighborhood map
What this means for you Summary
Snapshot
- This is a 3-bed/1.5-bath single-family listed at $180k. Condition is rated fair.
Deal economics
- At list price, monthly cash flow is $139 ($2k/yr) — positive.
- The deal already cash-flows at list — no discount required.
- To meet the 1% rule (rent ≥ 1% of price), the offer needs to be $175k (2.8% below list).
- Recommended offer: $175k (2.8% below list) — sets the bar for 1% rule.
Location & tenants
- Location reads 61/100 on livability (#318 in OK) — a middle-class / working-renter tenant base. Strengths: cost of living A+, housing A+; Watch: employment D+, schools F, amenities F.
- Moseley (rural): math 20% / reading 20% proficiency, ranked #418 of 513 in OK (top 82%) — low school quality limits family demand, transient renter base, plan for 1-2y turnover.
- Market conditions: 38 active listings in the ZIP; 1 comparable units currently listed for rent nearby; 51 units permitted in Delaware County in 2024 (0 in 5+ unit buildings).
Forward outlook
- In year one you build about $19k of equity ($1k loan paydown + $18k appreciation (9.7% local appreciation)).
- Delaware County population projected to shrink 6% by 2050 — rents likely to lag national; underwrite the cash flow, not the appreciation.
- At projected returns (9.7% appreciation + 3.0% rent growth), your $50k cash investment doubles in ~3 years — after that, you're playing with house money.
- By year 2, paydown + projected appreciation supports a ~$30k cash-out refi (75% LTV) — recoverable capital for the next deal without selling this one.
Negotiation context
- It's been on market 16 days — a 2% lower offer ($177k) is reasonable based on typical stale-listing flexibility.
- 4 sale attempts since 3y ago with the ask held roughly flat each time — persistent listings suggest the price (not the market) is what's stuck; bring a comps-based counter.
Risks & watch-outs
- Climate carrying-cost: major wildfire risk; extreme-heat days projected 7→21/yr by 2055 (HVAC capex compounding) — expect insurance premiums to compound above CPI over the hold.
Questions for the listing agent
- Have any recent inspections been done? Can we get a copy of the seller's disclosures and any deferred-maintenance estimates?
- Built in 1965 — when were the roof, HVAC, electrical panel, plumbing, and water heater last replaced?
- Is there a deadline driving the sale (1031 exchange, divorce, estate, relocation)? That informs how much negotiation room exists.
- Schools are F-rated, which usually means shorter tenancies and higher turnover. Who's the typical renter profile here, and what's been the actual vacancy rate?
- What's the average days-on-market for RENTAL listings here right now (not sales)? A rising rental-DOM trend means longer vacancies and softer asking-rent achievability than the comps imply.
- What's the recent tenant-quality profile in this submarket — average credit score on applications, eviction rate, late-payment / NSF rate, and stable-employment percentage? A property-management company in the area should have these aggregated.
- How much new for-sale + rental construction is in the pipeline within 1–3 miles? Heavy new supply typically softens prices + rents 12–24 months out; constrained supply supports both.
Investment metrics
- 1% rule
- 0.97% ✗
- Cap rate
- 7.22%
- Cash-on-cash
- 3.30%
- DSCR
- 1.15
- GRM
- 8.6
CMA / ARV
- ARV (on-the-fly)
- $249,782
- Comps found
- 2
Show comp detail 2 sales within ~0.75 mi
| Address | Dist | Beds/Ba | Sqft | Sold | Price | $/sf | Match |
|---|---|---|---|---|---|---|---|
| 1004 Lyndale St | 0.68mi | 3/2.0 | 1,671 (+13%) | 15mo | $258,500 | $155 | 32 |
| 1625 S Hefton St | 0.62mi | 3/2.0 | 1,270 (-14%) | 23mo | $215,000 | $169 | 26 |
Match score weights: distance 35% · size 25% · config 20% · recency 20%. Top-matched comps best support the ARV.
Projected returns pro-forma
9.73% appreciation · 3.0% rent growth · sell at horizon
- IRR
- 26.1%
- Equity multiple
- 3.06×
- Total profit
- $103,575
- Equity at exit
- $158,637
- IRR
- 23.0%
- Equity multiple
- 6.90×
- Total profit
- $297,274
- Equity at exit
- $338,429
Cash invested: $50,400 (down + closing). Projections, not guarantees.
Landlord ↔ Tenant lean methodology
- Overall (STATE)
- 83 Strongly Landlord-Friendly
- State Oklahoma
- 83 Strongly Landlord-Friendly · R+20
- County
- — inherits STATE
- City
- — inherits STATE
ZIP-level market 74964
- Home prices YoY
- 2.8%
- Active inventory
- 38
- Price-to-rent
- 8.6×
Monthly cashflow live
- Estimated rent
- $1,750 medium interval (Pro) →
- Mortgage (P&I)
- −$944
- Tax est. 1.5%
- −$225 /mo · $2,700/yr
- Insurance
- −$75
- HOA
- −$0
- Vacancy / Maint / Mgmt
- −$368
- Net cashflow
- $139
Break-even live
Sensitivity live
| Price | -10% $263 | -5% $201 | +0% $139 | +5% $76 | +10% $14 |
|---|---|---|---|---|---|
| Rent | -10% $0 | -5% $69 | +0% $139 | +5% $208 | +10% $277 |
| Rate | -1.0pp $229 | -0.5pp $184 | base $139 | +0.5pp $92 | +1.0pp $44 |
UW: 25.0% down · 7.5% · 30yr · 1.5% tax · 5.0% vac · 8.0% maint · 8.0% mgmt
Financing live
Cash to close
- Down payment
- $45,000
- Closing costs
- $5,400
- Reserves months
- —
- Total cash needed
- —
Loan-product check · same deal, 3 products live
Conventional
25% down · 7.5% · 30yr
- Down + closing
- —
- Monthly P&I
- —
- Monthly cashflow
- —
- DSCR
- —
- Eligible?
- —
Personal DTI + credit; lowest rate.
DSCR
20% down · 8.5% · 30yr
- Down + closing
- —
- Monthly P&I
- —
- Monthly cashflow
- —
- DSCR
- —
- Eligible?
- —
No personal income docs; deal must DSCR.
Hard money
10% down · 12.0% · 12mo
- Down + closing
- —
- Monthly P&I
- —
- Monthly cashflow
- —
- DSCR
- —
- Eligible?
- —
Short-term bridge; refi at stabilization.
Rent comps 1 comps
| Address | Beds | Baths | Sqft | Rent | $/sqft | DOM | Units | Dist |
|---|---|---|---|---|---|---|---|---|
| 2010 S Elm St Siloam Springs, AR | 3.0 | 2.0 | 1566 | $1,750 | $1.12 | 14d | 1 | 1.05mi |
Listing history 10 events
-
2026-05-15status Pending
-
2026-05-12historical
-
2026-05-04status Pending
-
2026-04-20status Active
-
2026-04-14status Pending
-
2026-04-12$180,000 Active
-
2024-10-30historical
-
2024-05-03$180,000 Active
-
2024-04-22historical
-
2023-10-10$180,000 Active
ⓘ Source: listings_history table (triggers on properties + properties_extension) + one-shot
backfill from property_details.listing_events for pre-trigger history.
Climate risk First Street
- Flood 1/10 Low FEMA zone X (unshaded) · 0% chance over 30 yrs
- Wildfire 7/10 Severe
- Heat 5/10 Major 7 d/yr ≥107°F today · 21 d/yr by 30 yrs out
- Wind 2/10 Low 3% chance of damaging wind over 30 yrs
- Air quality 2/10 Low 1 unhealthy d/yr today · 1 by 30 yrs out
Nearby sold comps map
Loading sold comps map…
Walkable amenities ~0.75 mi
Loading nearby amenities…
Taxation est. · year 1
- Rental income
- $21,000
- − Mortgage interest
- −$10,083
- − Property taxes
- −$2,700
- − Insurance
- −$900
- − Repairs & maintenance
- −$1,680
- − Management
- −$1,680
- − Depreciation
- −$5,236
- Taxable loss
- −$1,279
- Est. tax savings @ 24.0%
- +$307
- After-tax cash flow
- $1,970/yr
For passive investors: Depreciation is non-cash, so a rental often shows a tax loss while cash-flowing — sheltering income. Rental losses are passive: they offset passive income freely, and up to $25,000/yr can offset ordinary (W-2) income if you actively participate and your MAGI is under $100k (phasing out to $0 by $150k); unused losses carry forward. On sale, claimed depreciation is recaptured at up to 25%, and gains may owe capital-gains tax (a 1031 exchange can defer both). Figures are a year-1 estimate at your 24.0% rate — not tax advice; consult a CPA.
Condition & rehab AI · 13 photos
The home is in fair condition with some minor repairs and maintenance needed. It has potential for increased value with updates to the interior walls, flooring, and kitchen and bathroom fixtures.
Repairs flagged
- Minor Paint — Some wear visible on interior walls.
- Minor Flooring — Light scratches and scuffs on wooden flooring.
Value-add opportunities
- Both Paint the interior walls and replace the ceiling fan with a modern one — Fresh paint and a modern fan can enhance the home's appeal and functionality.
- Resale Replace the kitchen countertops with quartz or granite — Quartz or granite countertops can significantly increase the home's resale value.
- Resale Install a new bathroom vanity with a modern sink — A new vanity can improve the bathroom's appearance and functionality.
Renovation cost estimate screening
| Repair item | Severity | Est. cost |
|---|---|---|
| Paint · Some wear visible on interior walls. | Minor | $500–3,000 |
| Flooring · Light scratches and scuffs on wooden flooring. | Minor | $500–3,000 |
| Total estimated repair cost · 2 items | $1,000–6,000 |
Value-add ROI direction
- Both Paint the interior walls and replace the ceiling fan with a modern one — Fresh paint and a modern fan can enhance the home's appeal and functionality. ↑
- Resale Replace the kitchen countertops with quartz or granite — Quartz or granite countertops can significantly increase the home's resale value. ↑
- Resale Install a new bathroom vanity with a modern sink — A new vanity can improve the bathroom's appearance and functionality. ↑
ⓘ Cost ranges are severity-bucket heuristics (US national rule-of-thumb). Get contractor quotes + a written scope before underwriting a rehab budget.
Schools (NCES district)
- District
- Moseley
- NCES district ID
- 4020430
- Math proficiency
- 20% ▬ 0.00%
- Reading proficiency
- 20% ▬ 0.00%
- Median HH income
- $36,121
- Composite
- 19.83/100
- National rank
- #13893
- State rank
- #418 of 513 in OK
Livability — West Siloam Springs
- Score
- 61/100
- State rank
- #318
- US rank
- #18248
Category grades
Schools grade is shown separately in the Schools card above.
Census & demographics
- Census place
- West Siloam Springs, OK
- Population (ZIP)
- 2,110
Population outlook (Delaware County) Hauer SSP2
- Today (2025)
- 41,302 people
- By 2030
- 40,888 · -1.0%
- By 2040
- 39,802 · -3.6%
- By 2050
- 38,839 · -6.0%
- By 2075
- 37,438 · -9.4%
- By 2100
- 34,910 · -15.5%
Race, ethnicity, and origin ACS 2023
- Neighborhood character
- Diverse neighborhood (Simpson 0.66)
- Race & ethnicity
- White 58% Native American 24% Two or more races 10% Hispanic / Latino 6% Asian 3%
- Hispanic origin (detail)
- Mexican 5%
- Common ancestry
- Lithuanian 1% Slovak 1%
- Foreign-born
- 4% · Canada, Vietnam, South Korea
- Languages at home
- 94% English-only · Spanish 2% Vietnamese 1% Korean 1%
Political lean MEDSL · Delaware
- 2024 margin
- Solid R (+60.4) · D 19.2% · R 79.6% · Other 1.2%
- 2008→2024 swing
- -26.6pp toward R · 2008: -33.8pp · 2024: -60.4pp
- All cycles
- 2024: R+60.4 2020: R+58.5 2016: R+54.1 2012: R+41.3 2008: R+33.8
Not yet ingested
- Civics
- —
Market trends
- HPI YoY
- ▲ 9.73%
- Current HPI
- 355.9058
- Rent YoY
- —
- Metro
- —
- State GDP YoY
- ▲ 1.55%
- F500 in state
- 6
Industry mix (Fortune 500 HQ in OK)
| Industry | F500 HQs | Revenue |
|---|---|---|
| Energy | 3 | $48B |
|
||
Price history
+0.0% since first listed10 events — show timeline
- 2026-05-15 Pending — NWARMLS
- 2026-05-12 Delisted — NWARMLS
- 2026-05-04 Pending — NWARMLS
- 2026-04-20 Relisted — NWARMLS
- 2026-04-14 Pending — NWARMLS
- 2026-04-12 Listed $180,000 NWARMLS
- 2024-10-30 Listing Removed — MLSOK
- 2024-05-03 Listed $180,000 MLSOK
- 2024-04-22 Listing Removed — MLSOK
- 2023-10-10 Listed $180,000 MLSOK
Cash-flow waterfall
monthlySold comps — $/sqft
last 12 mo · ≤1 miLoading sold comps…