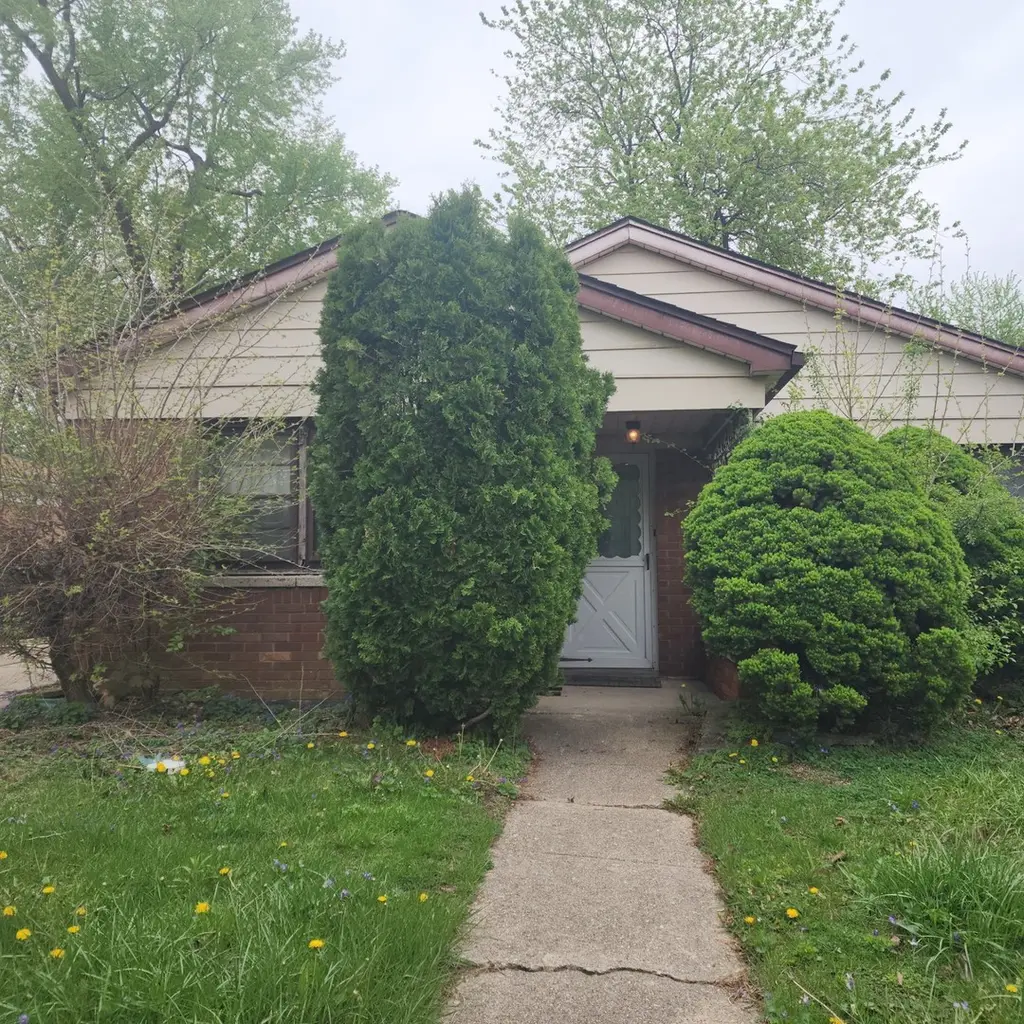
11619 S Sacramento Dr · Merrionette Park, IL
Flood risk 1/10 · Minimal
- FEMA flood zone
- X (unshaded)
- Chance of flooding over 30 yrs
- 0.0%
- Est. flood insurance / yr
- $473 – $860
Fire risk 1/10 · Minimal
- Est. fire insurance / yr
- $804 – $1,492
Heat risk 3/10 · Minor
- Hot days now (above 101°F)
- 7 days/yr
- Hot days in 30 yrs
- 15 days/yr
Wind risk 2/10 · Minimal
- Chance of severe wind over 30 yrs
- —
Air-quality risk 4/10 · Minor
- Unhealthy air days now
- 4 days/yr
- Unhealthy air days in 30 yrs
- 6 days/yr
Risk factors via First Street. Map © Google.
Why this score? — see what drove the C+ grade
The composite is a weighted blend of 9 inputs, each scored 0–100. Each bar is that input's sub-score; the figure is the points it added to the 100-point composite (weight × sub-score).
- Cash flow +21.8/30.0
- ARV discount +15.0/15.0
- DSCR +7.0/10.0
- 1% rule +5.9/10.0
- Livability +4.0/5.0
- Rent growth +2.5/5.0
- Condition / age +2.5/5.0
- Schools +1.6/10.0
- Appreciation +0.0/10.0
$185,000
🖨 Deal sheet 📄 Offer letter ✓ Due diligence
Listing remarks
HERE IS AN OPPORTUNITY TO OWN THIS BRICK RANCH IN QUIET SECTION OF MERRIONETTE PARK. THE HOUSE NEEDS UPDATING BUT THAT IS REFLECTED IN THE LIST PRICE. THE FURNACE AND HOT WATER HEATER ARE ABOUT 10 YEARS OLD. NICE SIZE ROOMS THROUGHOUT THE HOUSE; A TOTAL OF 1130 SQUARE FEET. THE DETACHED GARAGE IS ONLY A FEW MONTHS OLD AND HAS HARDLY BEEN USED. THE TAXES ARE $3106 AND CURRENTLY INCLUDE A HOMEOWNERS EXEMPTION ($982) AND A SENIOR EXEMPTION ($786). ELECTRIC FIREPLACE IN LIVING ROOM. THIS IS AN ESTATE SALE AND IS BEING SOLD "AS-IS". CASH OR STRONG CONVENTIONAL/REHAB LOANS ONLY.
Key facts
- Electric fireplace
- Brick ranch
- Detached garage
Tags
Property features AI
Finance
- Other: Parcel number available
- HOA & community: No master association fee required
Exterior
- Parking: Detached garage (garage owned); Side driveway; One total parking/garage space
- Utilities: Water service from Lake Michigan; Public sewer and storm sewer; Electric service with fuses
- Home design: Detached single-family ranch, one story; Fee simple ownership; Facing or entry direction not specified
- Construction: Brick construction; Asphalt roof; Concrete perimeter foundation; Built roughly 71–80 years ago; Built before 1978
- Exterior features: Lot dimensions approximately 42 x 150; Lot under 0.25 acre; Street lights, sidewalks, curbs, and paved streets; Park and tennis courts nearby; Served by commuter bus and train; school bus service
Interior
- Kitchen: Kitchen with eating area/table space (12 x 9); Refrigerator
- Bedrooms: Master bedroom on main level (13 x 11); Two additional main-level bedrooms (12 x 10 and 12 x 8)
- Flooring: Carpet in living room, master and two bedrooms; Vinyl flooring in kitchen and laundry
- Bathrooms: One full bathroom
- Heating & cooling: Natural gas heat
- Interior features: Five total rooms; Unfinished attic; Dining area combined with living room; Window treatments on all main rooms
- Laundry & utility: Main-level laundry (13 x 7) with gas dryer hookup, in-unit washer and dryer, and common-area access; Washer; Dryer
Neighborhood map
What this means for you Summary
Snapshot
- This is a 3-bed/1.0-bath single-family listed at $185k.
Deal economics
- At list price, monthly cash flow is $288 ($3k/yr) — positive.
- The deal already cash-flows at list — no discount required.
- Meets the 1% rule at list price ($2k rent vs $185k).
- Recommended offer: $182k (1.5% below list) — sets the bar for market timing.
Location & tenants
- Location reads 80/100 on livability (#104 in IL, #1,695 nationally) — a professional / high-income tenant draw. Strengths: crime A+, commute A+, cost of living A+; Watch: amenities D+, employment D+, schools F.
- Chsd 218 (suburban): math 14% / reading 20% proficiency, ranked #454 of 620 in IL (top 73%) — low school quality limits family demand, transient renter base, plan for 1-2y turnover.
- Market conditions: 43 active listings in the ZIP; 11 comparable units currently listed for rent nearby; rentals leasing fast (median 2d on market — plan ~1-2 weeks tenant-placement turnaround); 6,272 units permitted in Cook County in 2024 (4,658 in 5+ unit buildings).
- This rent runs 36% of the median local income ($67k/yr) — at the standard rent-burdened threshold; future hikes will face affordability resistance.
Forward outlook
- Local home prices are declining (-3.0%/yr); year-one equity from $1k of loan paydown is wiped out by about $6k of value loss. Plan a longer hold.
Negotiation context
- It's been on market 28 days — a 2% lower offer ($182k) is reasonable based on typical stale-listing flexibility.
Risks & watch-outs
- Watch-outs: built in 1953 — expect roof / HVAC / electrical / plumbing capex.
Questions for the listing agent
- Built in 1953 — when were the roof, HVAC, electrical panel, plumbing, and water heater last replaced?
- Is there a deadline driving the sale (1031 exchange, divorce, estate, relocation)? That informs how much negotiation room exists.
- Schools are F-rated, which usually means shorter tenancies and higher turnover. Who's the typical renter profile here, and what's been the actual vacancy rate?
- What's the average days-on-market for RENTAL listings here right now (not sales)? A rising rental-DOM trend means longer vacancies and softer asking-rent achievability than the comps imply.
- What's the recent tenant-quality profile in this submarket — average credit score on applications, eviction rate, late-payment / NSF rate, and stable-employment percentage? A property-management company in the area should have these aggregated.
- How much new for-sale + rental construction is in the pipeline within 1–3 miles? Heavy new supply typically softens prices + rents 12–24 months out; constrained supply supports both.
Investment metrics
- 1% rule
- 1.09% ✓
- Cap rate
- 8.16%
- Cash-on-cash
- 6.66%
- DSCR
- 1.30
- GRM
- 7.7
CMA / ARV
- ARV (median comp)
- $233,491
- List price
- $185,000
- Delta
- -20.77%
- Verdict
- UNDERPRICED
- Comps
- 20 within 1.0 mi
Show comp detail 12 sales within ~0.75 mi
| Address | Dist | Beds/Ba | Sqft | Sold | Price | $/sf | Match |
|---|---|---|---|---|---|---|---|
| 11619 S Sacramento Dr | 0.00mi | 3/1.0 | 1,130 (0%) | 0mo | $170,000 | $150 | 100 |
| 11214 S Sacramento Ave | 0.51mi | 3/1.0 | 1,136 (+0%) | 1mo | $290,000 | $255 | 74 |
| 11458 S Washtenaw Ave | 0.43mi | 3/2.0 | 1,199 (+6%) | 2mo | $318,000 | $265 | 64 |
| 11326 S Troy St | 0.40mi | 3/1.0 | 1,028 (-9%) | 3mo | $283,000 | $275 | 64 |
| 11214 S Sawyer Ave | 0.59mi | 3/2.0 | 1,100 (-3%) | 1mo | $400,000 | $364 | 63 |
| 3161 W Park Lane Dr | 0.23mi | 2/1.0 (-1) | 986 (-13%) | 3mo | $235,000 | $238 | 61 |
| 11419 S Fairfield Ave | 0.44mi | 4/2.0 (+1) | 1,246 (+10%) | 1mo | $340,000 | $273 | 52 |
| 11304 S Saint Louis Ave | 0.74mi | 3/2.0 | 1,188 (+5%) | 2mo | $405,000 | $341 | 51 |
| 3343 W 112th Pl | 0.64mi | 2/2.0 (-1) | 1,217 (+8%) | 1mo | $290,000 | $238 | 47 |
| 2560 W 119th St | 0.63mi | 4/2.0 (+1) | 1,029 (-9%) | 4mo | $310,000 | $301 | 44 |
| 3243 W 112th Pl | 0.56mi | 4/2.0 (+1) | 1,258 (+11%) | 4mo | $455,500 | $362 | 43 |
| 11249 S Homan Ave | 0.64mi | 3/3.0 | 1,286 (+14%) | 1mo | $470,000 | $365 | 38 |
Match score weights: distance 35% · size 25% · config 20% · recency 20%. Top-matched comps best support the ARV.
Projected returns pro-forma
-3.0% appreciation · 3.0% rent growth · sell at horizon
- IRR
- -6.0%
- Equity multiple
- 0.78×
- Total profit
- $-11,622
- Equity at exit
- $27,584
- IRR
- 3.6%
- Equity multiple
- 1.26×
- Total profit
- $13,640
- Equity at exit
- $15,995
Cash invested: $51,800 (down + closing). Projections, not guarantees.
Landlord ↔ Tenant lean methodology
- Overall (STATE)
- 43 Moderately Tenant-Leaning
- State Illinois
- 43 Moderately Tenant-Leaning · D+7
- County
- — inherits STATE
- City
- — inherits STATE
ZIP-level market 60803
- Home prices YoY
- -32.3%
- Active inventory
- 43
- Price-to-rent
- 7.7×
Monthly cashflow live
- Estimated rent
- $2,011 high interval (Pro) →
- Mortgage (P&I)
- −$970
- Tax from tax record
- −$254 /mo · $3,049/yr
- Insurance
- −$77
- HOA
- −$0
- Vacancy / Maint / Mgmt
- −$422
- Net cashflow
- $288
Break-even live
UW: 25.0% down · 7.5% · 30yr · 1.5% tax · 5.0% vac · 8.0% maint · 8.0% mgmt
Financing live
Cash to close
- Down payment
- $46,250
- Closing costs
- $5,550
- Reserves months
- —
- Total cash needed
- —
Loan-product check · same deal, 3 products live
Conventional
25% down · 7.5% · 30yr
- Down + closing
- —
- Monthly P&I
- —
- Monthly cashflow
- —
- DSCR
- —
- Eligible?
- —
Personal DTI + credit; lowest rate.
DSCR
20% down · 8.5% · 30yr
- Down + closing
- —
- Monthly P&I
- —
- Monthly cashflow
- —
- DSCR
- —
- Eligible?
- —
No personal income docs; deal must DSCR.
Hard money
10% down · 12.0% · 12mo
- Down + closing
- —
- Monthly P&I
- —
- Monthly cashflow
- —
- DSCR
- —
- Eligible?
- —
Short-term bridge; refi at stabilization.
Rent comps 11 comps
| Address | Beds | Baths | Sqft | Rent | $/sqft | DOM | Units | Dist |
|---|---|---|---|---|---|---|---|---|
| 3177 W 115th St Unit 3W Merrionette Park, IL | 2.0 | 1.0 | 900 | $1,600 | $1.78 | 1d | 1 | 0.24mi |
| 11706 S Artesian Ave Chicago, IL | 3.0 | 2.5 | 1299 | $3,400 | $2.62 | 1d | 1 | 0.71mi |
| 3621 W 119th St Alsip, IL | 1.0–2.0 | 1.0 | 800 | $1,525 | $1.91 | 1d | 4 | 0.86mi |
| 3700 W 119th St Unit 3700-3C Alsip, IL | 2.0 | 1.0 | 730 | $1,595 | $2.18 | 1d | 1 | 0.93mi |
| 2524 W 109th Pl Chicago, IL | 3.0 | 1.0 | 1350 | $2,600 | $1.93 | 1d | 1 | 1.05mi |
| 2336 W 122nd St Unit 2 Alsip, IL | 3.0 | 1.0 | 1100 | $1,900 | $1.73 | 7d | 1 | 1.06mi |
| 2336 122nd St Unit 2 Blue Island, IL | 3.0 | 1.0 | 1340 | $1,900 | $1.42 | 20d | 1 | 1.10mi |
| 2130 122nd St Blue Island, IL | 2.0 | 1.0 | 558 | $1,450 | $2.60 | 1d | 1 | 1.31mi |
| 12710 Elm St Unit 2B Blue Island, IL | 3.0 | 2.0 | 900 | $1,850 | $2.06 | 1d | 1 | 1.45mi |
| 11118 S Homewood Ave Chicago, IL | 2.0 | 1.0 | 850 | $2,650 | $3.12 | 1d | 3 | 1.46mi |
| 11720 S Kedvale Ave Alsip, IL | 3.0 | 1.0 | 1100 | $2,200 | $2.00 | 19d | 1 | 1.47mi |
Listing history 5 events
-
2026-05-15price $185,000 597-char remark
-
2026-05-05price $199,000 597-char remark
-
2026-04-23$210,000 Active 597-char remark
-
1983-04-28soldstatus $51,000
-
1983-02-01soldstatus $51,000
ⓘ Source: listings_history table (triggers on properties + properties_extension) + one-shot
backfill from property_details.listing_events for pre-trigger history.
Tax reassessment forecast IL · Partial reset (capped growth)
- Current annual tax
- $3,049 · $254/mo
- Projected year-2 tax
- $3,624 · $302/mo
- Expected delta
- +$575/yr (+$48/mo · 18.9%)
ⓘ Screening estimate from a state-policy table — verify with the county assessor before closing.
Climate risk First Street
- Flood 1/10 Low FEMA zone X (unshaded) · 0% chance over 30 yrs
- Wildfire 1/10 Low
- Heat 3/10 Moderate 7 d/yr ≥101°F today · 15 d/yr by 30 yrs out
- Wind 2/10 Low
- Air quality 4/10 Moderate 4 unhealthy d/yr today · 6 by 30 yrs out
Nearby sold comps map
Loading sold comps map…
Walkable amenities ~0.75 mi
Loading nearby amenities…
Taxation est. · year 1
- Rental income
- $24,134
- − Mortgage interest
- −$10,363
- − Property taxes
- −$3,049
- − Insurance
- −$925
- − Repairs & maintenance
- −$1,931
- − Management
- −$1,931
- − Depreciation
- −$5,382
- Taxable income
- $554
- Est. tax owed @ 24.0%
- −$133
- After-tax cash flow
- $3,317/yr
For passive investors: Depreciation is non-cash, so a rental often shows a tax loss while cash-flowing — sheltering income. Rental losses are passive: they offset passive income freely, and up to $25,000/yr can offset ordinary (W-2) income if you actively participate and your MAGI is under $100k (phasing out to $0 by $150k); unused losses carry forward. On sale, claimed depreciation is recaptured at up to 25%, and gains may owe capital-gains tax (a 1031 exchange can defer both). Figures are a year-1 estimate at your 24.0% rate — not tax advice; consult a CPA.
Schools (NCES district)
- District
- Chsd 218
- NCES district ID
- 1706540
- Math proficiency
- 14% ▼ -4.00%
- Reading proficiency
- 20% ▼ -1.00%
- Median HH income
- $57,166
- Composite
- 16.09/100
- National rank
- #9235
- State rank
- #454 of 620 in IL
Livability — Merrionette Park
- Score
- 80/100
- State rank
- #104
- US rank
- #1695
Category grades
Schools grade is shown separately in the Schools card above.
Census & demographics
- Census place
- Merrionette Park, IL
- County
- Cook County · 4,486,803 people
- Metro
- Chicago-Naperville-Elgin, IL-IN-WI
- Population (ZIP)
- 22,106
- Household income
- $67,014
- Rent vs Own
- Severe rent burden
- 683.0
Population outlook (Cook County) Hauer SSP2
- Today (2025)
- 5,347,519 people
- By 2030
- 5,357,703 · +0.2%
- By 2040
- 5,324,924 · -0.4%
- By 2050
- 5,230,762 · -2.2%
- By 2075
- 4,785,735 · -10.5%
- By 2100
- 4,188,836 · -21.7%
Race, ethnicity, and origin ACS 2023
- Neighborhood character
- Diverse neighborhood (Simpson 0.67)
- Race & ethnicity
- White 47% Hispanic / Latino 28% Black 19% Two or more races 11% Asian 2% Native American 1%
- Hispanic origin (detail)
- Mexican 25% Puerto Rican 1%
- Common ancestry
- Romanian 10% Iranian 1% Lithuanian 1%
- Foreign-born
- 10% · Canada, Vietnam
- Languages at home
- 77% English-only · Spanish 19% Russian/Polish/Slavic 1% Arabic 1%
Political lean MEDSL · Cook
- 2024 margin
- Solid D (+42.0) · D 70.4% · R 28.4% · Other 1.2%
- 2008→2024 swing
- -11.4pp toward R · 2008: 53.4pp · 2024: 42.0pp
- All cycles
- 2024: D+42.0 2020: D+50.3 2016: D+53.0 2012: D+49.4 2008: D+53.4
Not yet ingested
- Civics
- —
Market trends
- HPI YoY
- ▼ -110.48%
- Current HPI
- 231.175
- Rent YoY
- —
- Metro
- Chicago-Naperville-Elgin, IL-IN-WI
- State GDP YoY
- ▲ 1.59%
- F500 in state
- 60
Industry mix (Fortune 500 HQ in IL)
| Industry | F500 HQs | Revenue |
|---|---|---|
| Insurance | 4 | $201B |
|
||
| Consumer Goods | 4 | $87B |
|
||
| Industrial Machinery | 3 | $64B |
|
||
| Healthcare | 2 | $55B |
|
||
| Retail / Pharmacy | 1 | $148B |
|
||
| Agriculture / Food | 1 | $86B |
|
||
Price history
+233.3% since first listed7 events — show timeline
- 2026-06-11 Sold (MLS) $170,000 MRED as Distributed by MLS Grid
- 2026-05-21 Pending — MRED as Distributed by MLS Grid
- 2026-05-15 Price Changed $185,000 MRED as Distributed by MLS Grid
- 2026-05-05 Price Changed $199,000 MRED as Distributed by MLS Grid
- 2026-04-23 Listed $210,000 MRED as Distributed by MLS Grid
- 1983-04-28 Sold (Public Records) $51,000 Public Records
- 1983-02-01 Sold (Public Records) $51,000 Public Records
Property tax history
+1.7%/yrLatest (2023): $3,049 · +52.3% YoY. Source: county tax records.
Cash-flow waterfall
monthlySold comps — $/sqft
last 12 mo · ≤1 miLoading sold comps…