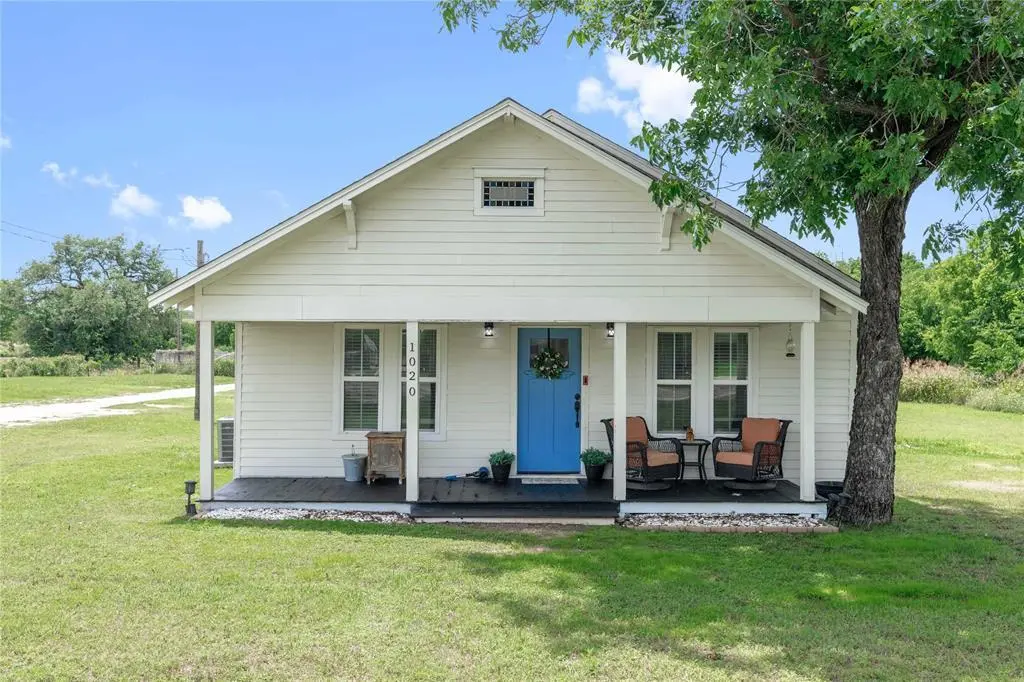
1020 Main St · Blanket, TX
Flood risk 4/10 · Minor
- FEMA flood zone
- X (unshaded)
- Chance of flooding over 30 yrs
- 0.22%
- Est. flood insurance / yr
- $507 – $1,088
Fire risk 6/10 · Moderate
- Est. fire insurance / yr
- $1,222 – $2,270
Heat risk 7/10 · Major
- Hot days now (above 105°F)
- 7 days/yr
- Hot days in 30 yrs
- 23 days/yr
Wind risk 6/10 · Moderate
- Chance of severe wind over 30 yrs
- 27.0%
Air-quality risk 1/10 · Minimal
- Unhealthy air days now
- 0 days/yr
- Unhealthy air days in 30 yrs
- 0 days/yr
Risk factors via First Street. Map © Google.
Why this score? — see what drove the D- grade
The composite is a weighted blend of 9 inputs, each scored 0–100. Each bar is that input's sub-score; the figure is the points it added to the 100-point composite (weight × sub-score).
- Cash flow +11.3/30.0
- Appreciation +6.1/10.0
- DSCR +3.3/10.0
- Livability +3.1/5.0
- ARV discount +3.0/15.0
- Schools +2.6/10.0
- Rent growth +2.5/5.0
- Condition / age +2.5/5.0
- 1% rule +2.4/10.0
$272,000
🖨 Deal sheet (PDF) 📄 Offer letter ✓ Due diligence
Listing remarks MLS
Beautiful, mid 1900's craftsman style home completely taken to the studs and redone. No detail was left out. This is a must see home!
Key facts
- Open-concept kitchen
- Large island
- Walk-in shower
Tags
Property features AI
Finance
- Other: Multi-parcel: Yes; Will not subdivide
- Financial info: Treat as clear loan type; No second mortgage
- HOA & community: No homeowners association
Exterior
- Parking: Covered parking for 2 vehicles; 2 carport spaces; Additional parking available
- Security: No smart home features
- Utilities: City sewer; Not in a municipal utility district
- Home design: Single-family residence; Residential property; One story; Property attached: Yes; Subdivision: Blanket O T; Facing direction not specified; Entry level not specified
- Construction: Year built not specified
- Exterior features: Corner lot; Acreage
Interior
- Kitchen: Dishwasher
- Bedrooms: 3 bedrooms (primary bedroom on level 1)
- Flooring: No flooring details listed
- Bathrooms: 2 full bathrooms
- Heating & cooling: Central heating (electric); Central air conditioning (electric)
- Interior features: Built-in features; One living area; Room count: 2
- Laundry & utility: No specific laundry details listed
Neighborhood map
What this means for you Summary
Snapshot
- This is a 3-bed/1.0-bath single-family listed at $272k.
Deal economics
- At list price, monthly cash flow is $-98 ($-1k/yr) — negative.
- To cash-flow at today's rent, offer at most $255k (6.3% below list).
- To meet the 1% rule (rent ≥ 1% of price), the offer needs to be $200k (26.5% below list).
- Recommended offer: $200k (26.5% below list) — sets the bar for 1% rule.
Location & tenants
- Location reads 61/100 on livability (#1,023 in TX) — a middle-class / working-renter tenant base. Strengths: cost of living A+, housing A+; Watch: health & safety D+, employment D, schools F.
- Blanket ISD (rural): math 20% / reading 35% proficiency, ranked #1,046 of 1,141 in TX (top 92%) — low school quality limits family demand, transient renter base, plan for 1-2y turnover.
- Market conditions: 33 active listings in the ZIP; 3 comparable units currently listed for rent nearby; rentals lingering (median 44d on market — plan ~5-8 weeks vacancy on turnover, expect pricing pressure); 100% of comp listings sitting > 30 days — soft ceiling on asking rent; 142 units permitted in Brown County in 2024 (0 in 5+ unit buildings).
Forward outlook
- In year one you build about $8k of equity ($2k loan paydown + $6k appreciation (2.1% local appreciation)).
- By year 5, paydown + projected appreciation supports a ~$33k cash-out refi (75% LTV) — recoverable capital for the next deal without selling this one.
Negotiation context
- It's been on market 22 days — a 2% lower offer ($268k) is reasonable based on typical stale-listing flexibility.
- 7 sale attempts since 10y ago with the ask held roughly flat each time — persistent listings suggest the price (not the market) is what's stuck; bring a comps-based counter.
Risks & watch-outs
- Climate carrying-cost: major wind risk, 27% chance of damaging wind over 30y; major wildfire risk; extreme-heat days projected 7→23/yr by 2055 (HVAC capex compounding) — expect insurance premiums to compound above CPI over the hold.
Questions for the listing agent
- What do current leases actually rent for vs. the listed asking? Can we see a recent rent roll and the last 12 months of T-12 income?
- Is there a deadline driving the sale (1031 exchange, divorce, estate, relocation)? That informs how much negotiation room exists.
- Schools are F-rated, which usually means shorter tenancies and higher turnover. Who's the typical renter profile here, and what's been the actual vacancy rate?
- Crime grade is F in this area — have there been break-ins, vandalism, or insurance claims at this property in the last 3 years? What carrier currently insures it and at what premium?
- The area grade is low — what's the realistic commute time and amenity access for the typical tenant pool here? Any planned neighborhood developments (good or bad) we should know about?
- What's the average days-on-market for RENTAL listings here right now (not sales)? A rising rental-DOM trend means longer vacancies and softer asking-rent achievability than the comps imply.
- What's the recent tenant-quality profile in this submarket — average credit score on applications, eviction rate, late-payment / NSF rate, and stable-employment percentage? A property-management company in the area should have these aggregated.
- How much new for-sale + rental construction is in the pipeline within 1–3 miles? Heavy new supply typically softens prices + rents 12–24 months out; constrained supply supports both.
Investment metrics
- 1% rule
- 0.74% ✗
- Cap rate
- 5.86%
- Cash-on-cash
- -1.54%
- DSCR
- 0.93
- GRM
- 11.3
CMA / ARV
- ARV (on-the-fly)
- $247,100
- Comps found
- 6
Show comp detail 6 sales within ~0.75 mi
| Address | Dist | Beds/Ba | Sqft | Sold | Price | $/sf | Match |
|---|---|---|---|---|---|---|---|
| 700 Avenue H | 0.15mi | 3/1.0 | 1,496 (+6%) | 5mo | $37,500 | $25 | 79 |
| 316 7th St | 0.53mi | 3/2.0 | 1,430 (+1%) | 4mo | $240,000 | $168 | 66 |
| 300 N Broadway | 0.33mi | 4/2.0 (+1) | 1,300 (-8%) | 11mo | $143,000 | $110 | 53 |
| 512 Fifth St | 0.36mi | 3/2.0 | 1,200 (-15%) | 8mo | $259,000 | $216 | 48 |
| 413 Fifth St | 0.41mi | 3/2.0 | 1,200 (-15%) | 18mo | $210,000 | $175 | 36 |
| 505 Ave B St | 0.61mi | 3/2.0 | 1,200 (-15%) | 18mo | $210,000 | $175 | 27 |
Match score weights: distance 35% · size 25% · config 20% · recency 20%. Top-matched comps best support the ARV.
Projected returns pro-forma
2.11% appreciation · 3.0% rent growth · sell at horizon
- IRR
- 3.4%
- Equity multiple
- 1.18×
- Total profit
- $13,897
- Equity at exit
- $108,947
- IRR
- 7.1%
- Equity multiple
- 1.98×
- Total profit
- $74,304
- Equity at exit
- $158,173
Cash invested: $76,160 (down + closing). Projections, not guarantees.
Landlord ↔ Tenant lean methodology
- Overall (STATE)
- 87 Strongly Landlord-Friendly
- State Texas
- 87 Strongly Landlord-Friendly · R+5
- County
- — inherits STATE
- City
- — inherits STATE
ZIP-level market 76432
- Home prices YoY
- 2.0%
- Active inventory
- 33
- Price-to-rent
- 11.3×
Monthly cashflow live
- Estimated rent
- $2,000 medium interval (Pro) →
- Mortgage (P&I)
- −$1,426
- Tax from tax record
- −$138 /mo · $1,655/yr
- Insurance
- −$113
- HOA
- −$0
- Vacancy / Maint / Mgmt
- −$420
- Net cashflow
- $-98
Break-even live
Sensitivity live
| Price | -10% $56 | -5% $-21 | +0% $-98 | +5% $-175 | +10% $-252 |
|---|---|---|---|---|---|
| Rent | -10% $-256 | -5% $-177 | +0% $-98 | +5% $-19 | +10% $60 |
| Rate | -1.0pp $39 | -0.5pp $-29 | base $-98 | +0.5pp $-168 | +1.0pp $-240 |
UW: 25.0% down · 7.5% · 30yr · 1.5% tax · 5.0% vac · 8.0% maint · 8.0% mgmt
Financing live
Cash to close
- Down payment
- $68,000
- Closing costs
- $8,160
- Reserves months
- —
- Total cash needed
- —
Loan-product check · same deal, 3 products live
Conventional
25% down · 7.5% · 30yr
- Down + closing
- —
- Monthly P&I
- —
- Monthly cashflow
- —
- DSCR
- —
- Eligible?
- —
Personal DTI + credit; lowest rate.
DSCR
20% down · 8.5% · 30yr
- Down + closing
- —
- Monthly P&I
- —
- Monthly cashflow
- —
- DSCR
- —
- Eligible?
- —
No personal income docs; deal must DSCR.
Hard money
10% down · 12.0% · 12mo
- Down + closing
- —
- Monthly P&I
- —
- Monthly cashflow
- —
- DSCR
- —
- Eligible?
- —
Short-term bridge; refi at stabilization.
Rent comps 3 comps
| Address | Beds | Baths | Sqft | Rent | $/sqft | DOM | Units | Dist |
|---|---|---|---|---|---|---|---|---|
| 413 5th St Blanket, TX | 3.0 | 2.0 | 1200 | $2,000 | $1.67 | 44d | 1 | 0.43mi |
| 409 5th St Blanket, TX | 3.0 | 2.0 | 1200 | $2,000 | $1.67 | 44d | 1 | 0.43mi |
| 200 Main St Blanket, TX | 3.0 | 2.0 | 1200 | $2,000 | $1.67 | 44d | 1 | 0.60mi |
Listing history 35 events
-
2026-06-21days on market $272,000 Active 22 DOM
-
2026-06-18days on market $272,000 Active 20 DOM
-
2026-06-17days on market $272,000 Active 19 DOM
-
2026-06-16days on market $272,000 Active 18 DOM
-
2026-06-15days on market $272,000 Active 17 DOM
-
2026-06-13days on market $272,000 Active 15 DOM
-
2026-06-12days on market $272,000 Active 14 DOM
-
2026-06-09days on market $272,000 Active 11 DOM
-
2026-06-09price $272,000 Active 10 DOM
-
2026-06-08days on market $282,500 Active 10 DOM
-
2026-06-08days on market $282,500 Active 9 DOM
-
2026-06-05days on market $282,500 Active 7 DOM
-
2026-06-03days on market $282,500 Active 5 DOM
-
2026-06-02days on market $282,500 Active 4 DOM
-
2026-06-01days on market $282,500 Active 3 DOM
-
2026-05-31days on market $282,500 Active 2 DOM
-
2026-05-28$282,500 Active
-
2022-09-19soldstatus Closed 133-char remark
Show marketing remark (133 chars)
Beautiful, mid 1900's craftsman style home completely taken to the studs and redone. No detail was left out. This is a must see home!
-
2022-07-09historical Active Contingent 133-char remark
Show marketing remark (133 chars)
Beautiful, mid 1900's craftsman style home completely taken to the studs and redone. No detail was left out. This is a must see home!
-
2022-07-06price $211,000 133-char remark
Show marketing remark (133 chars)
Beautiful, mid 1900's craftsman style home completely taken to the studs and redone. No detail was left out. This is a must see home!
-
2022-07-06status Active 133-char remark
Show marketing remark (133 chars)
Beautiful, mid 1900's craftsman style home completely taken to the studs and redone. No detail was left out. This is a must see home!
-
2022-04-22historical Active Contingent 133-char remark
Show marketing remark (133 chars)
Beautiful, mid 1900's craftsman style home completely taken to the studs and redone. No detail was left out. This is a must see home!
-
2022-04-21$205,000 Active 133-char remark
Show marketing remark (133 chars)
Beautiful, mid 1900's craftsman style home completely taken to the studs and redone. No detail was left out. This is a must see home!
-
2021-02-19historical
-
2020-07-11status Active
-
2020-05-17status Pending
-
2020-04-04price $59,500
-
2019-02-18$65,000 Active
-
2018-04-01historical
-
2017-03-31$28,500 Active
-
2017-03-01historical
-
2016-08-30$28,500 Active
-
2014-05-28soldstatus
-
2009-06-02soldstatus
-
1992-06-11soldstatus
ⓘ Source: listings_history table (triggers on properties + properties_extension) + one-shot
backfill from property_details.listing_events for pre-trigger history.
Tax reassessment forecast TX · Resets to sale price
- Current annual tax
- $1,655 · $138/mo
- Projected year-2 tax
- $4,978 · $415/mo
- Expected delta
- +$3,322/yr (+$277/mo · 200.7%)
ⓘ Screening estimate from a state-policy table — verify with the county assessor before closing.
Climate risk First Street
- Flood 4/10 Moderate FEMA zone X (unshaded) · 22% chance over 30 yrs
- Wildfire 6/10 Major
- Heat 7/10 Severe 7 d/yr ≥105°F today · 23 d/yr by 30 yrs out
- Wind 6/10 Major 27% chance of damaging wind over 30 yrs
- Air quality 1/10 Low 0 unhealthy d/yr today · 0 by 30 yrs out
Nearby sold comps map
Loading sold comps map…
Walkable amenities ~0.75 mi
Loading nearby amenities…
Taxation est. · year 1
- Rental income
- $24,000
- − Mortgage interest
- −$15,236
- − Property taxes
- −$1,655
- − Insurance
- −$1,360
- − Repairs & maintenance
- −$1,920
- − Management
- −$1,920
- − Depreciation
- −$7,913
- Taxable loss
- −$6,004
- Est. tax savings @ 24.0%
- +$1,441
- After-tax cash flow
- $269/yr
For passive investors: Depreciation is non-cash, so a rental often shows a tax loss while cash-flowing — sheltering income. Rental losses are passive: they offset passive income freely, and up to $25,000/yr can offset ordinary (W-2) income if you actively participate and your MAGI is under $100k (phasing out to $0 by $150k); unused losses carry forward. On sale, claimed depreciation is recaptured at up to 25%, and gains may owe capital-gains tax (a 1031 exchange can defer both). Figures are a year-1 estimate at your 24.0% rate — not tax advice; consult a CPA.
Schools (NCES district)
- District
- Blanket ISD
- NCES district ID
- 4810380
- Math proficiency
- 20% ▼ -10.00%
- Reading proficiency
- 35% ▼ -5.00%
- Median HH income
- $43,678
- Composite
- 26.43/100
- National rank
- #12649
- State rank
- #1046 of 1141 in TX
Livability — Blanket
- Score
- 61/100
- State rank
- #1023
- US rank
- #18174
Category grades
Schools grade is shown separately in the Schools card above.
Census & demographics
- Census place
- Blanket, TX
- Population (ZIP)
- 1,376
Population outlook (Brown County) Hauer SSP2
- Today (2025)
- 38,381 people
- By 2030
- 38,288 · -0.2%
- By 2040
- 38,120 · -0.7%
- By 2050
- 38,227 · -0.4%
- By 2075
- 39,362 · +2.6%
- By 2100
- 39,171 · +2.1%
Race, ethnicity, and origin ACS 2023
- Neighborhood character
- Predominantly White (77%)
- Race & ethnicity
- White 77% Hispanic / Latino 17% Two or more races 14%
- Hispanic origin (detail)
- Mexican 15%
- Common ancestry
- Italian 24% Slovak 2% Serbian 1%
- Foreign-born
- 5% · Canada
- Languages at home
- 86% English-only · Spanish 13%
Political lean MEDSL · Brown
- 2024 margin
- Solid R (+73.9) · D 12.7% · R 86.6%
- 2008→2024 swing
- -12.5pp toward R · 2008: -61.5pp · 2024: -73.9pp
- All cycles
- 2024: R+73.9 2020: R+72.6 2016: R+74.5 2012: R+71.7 2008: R+61.5
Not yet ingested
- Civics
- —
Market trends
- HPI YoY
- ▲ 2.11%
- Current HPI
- 107.4171
- Rent YoY
- —
- Metro
- —
- State GDP YoY
- ▲ 3.95%
- F500 in state
- 110
Industry mix (Fortune 500 HQ in TX)
| Industry | F500 HQs | Revenue |
|---|---|---|
| Energy | 16 | $1,198B |
|
||
| Technology | 5 | $198B |
|
||
| Engineering / Construction | 4 | $72B |
|
||
| Energy Services | 3 | $60B |
|
||
| Utilities | 3 | $41B |
|
||
| Healthcare | 2 | $330B |
|
||
Price history
+891.2% since first listed19 events — show timeline
- 2026-05-28 Listed $282,500 NTREIS
- 2022-09-19 Sold (MLS) — NTREIS
- 2022-07-09 Contingent — NTREIS
- 2022-07-06 Price Changed $211,000 NTREIS
- 2022-07-06 Relisted — NTREIS
- 2022-04-22 Contingent — NTREIS
- 2022-04-21 Listed $205,000 NTREIS
- 2021-02-19 Listing Removed — NTREIS
- 2020-07-11 Relisted — NTREIS
- 2020-05-17 Pending — NTREIS
- 2020-04-04 Price Changed $59,500 NTREIS
- 2019-02-18 Listed $65,000 NTREIS
- 2018-04-01 Listing Removed — NTREIS
- 2017-03-31 Listed $28,500 NTREIS
- 2017-03-01 Listing Removed — NTREIS
- 2016-08-30 Listed $28,500 NTREIS
- 2014-05-28 Sold (Public Records) — Public Records
- 2009-06-02 Sold (Public Records) — Public Records
- 1992-06-11 Sold (Public Records) — Public Records
Property tax history
+22.0%/yrLatest (2025): $1,655 · +7.5% YoY. Source: county tax records.
Cash-flow waterfall
monthlySold comps — $/sqft
last 12 mo · ≤1 miLoading sold comps…