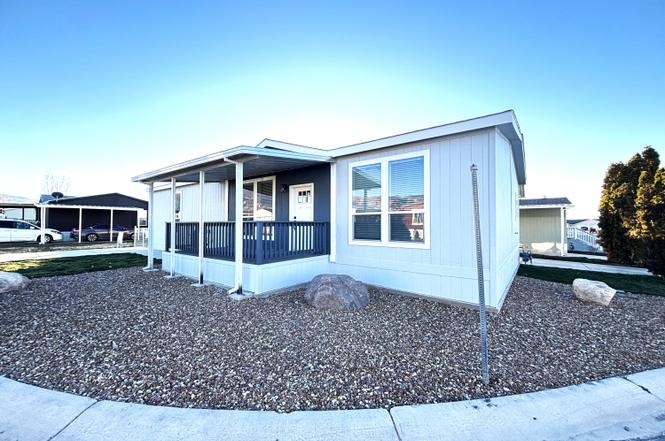
780 W 1125 N #114 · Cedar City, UT
Flood risk 6/10 · Moderate
- FEMA flood zone
- —
- Chance of flooding over 30 yrs
- 0.73%
- Est. flood insurance / yr
- —
Fire risk 5/10 · Moderate
- Est. fire insurance / yr
- $453 – $841
Heat risk 3/10 · Minor
- Hot days now (above 91°F)
- 7 days/yr
- Hot days in 30 yrs
- 22 days/yr
Wind risk 1/10 · Minimal
- Chance of severe wind over 30 yrs
- —
Air-quality risk 3/10 · Minor
- Unhealthy air days now
- 2 days/yr
- Unhealthy air days in 30 yrs
- 2 days/yr
Risk factors via First Street. Map © Google.
Why this score? — see what drove the D grade
The composite is a weighted blend of 9 inputs, each scored 0–100. Each bar is that input's sub-score; the figure is the points it added to the 100-point composite (weight × sub-score).
- Cash flow +12.4/30.0
- ARV discount +7.5/15.0
- Rent growth +3.8/5.0
- DSCR +3.7/10.0
- 1% rule +3.5/10.0
- Schools +3.5/10.0
- Livability +3.2/5.0
- Condition / age +2.5/5.0
- Appreciation +0.0/10.0
$195,000
🖨 Deal sheet (PDF) 📄 Offer letter ✓ Due diligence
Listing remarks
Welcome to this brand-new 2025 home in Canyon View Manufactured Home Park! This is a must see very large 1680 sqft. 3-bedroom, 2-bath manufactured home. Home Features 9' ceilings, large ceiling to floor windows, LED flat lights, all bedrooms are fan ready, forced air heating and cooling, walking closets and large master bedroom and bath. Fenced back yard with shed great for tools and extra storage. It's only 9 minutes to SUU and 7 minutes to downtown. The yard is fully fenced and already landscaped. Park rent is $350/month + $95/month for water, sewer, and trash. Simple, well-kept, and in a great spot—come take a look!
Key facts
- Walking closets
- Large master bedroom
- Fenced back yard
Tags
Neighborhood map
What this means for you Summary
Snapshot
- This is a 3-bed/2.0-bath single-family listed at $195k.
Deal economics
- At list price, monthly cash flow is $-31 ($-377/yr) — negative.
- To cash-flow at today's rent, offer at most $190k (2.3% below list).
- To meet the 1% rule (rent ≥ 1% of price), the offer needs to be $167k (14.6% below list).
- Recommended offer: $167k (14.6% below list) — sets the bar for 1% rule.
Location & tenants
- Location reads 64/100 on livability (#170 in UT) — a middle-class / working-renter tenant base. Strengths: cost of living A+, housing A+, crime A; Watch: employment D, amenities F, commute F.
- Iron District (town): math 40% / reading 44% proficiency, ranked #42 of 80 in UT (top 52%) — families likely to look elsewhere, expect single-tenant / working-renter base with shorter leases.
- Zoned schools: Cedar North School (math 46% / reading 41%, grade F, #260 of 585 statewide, top 46%, 636 students, 48% FRL); Canyon View Middle (math 32% / reading 46%, grade F, #79 of 138 statewide, top 58%, 989 students, 43% FRL); Canyon View High (math 27% / reading 42%, grade F, #95 of 171 statewide, top 61%, 1,123 students, 34% FRL) — zoned schools at 42% FRL track the district average.
- Market conditions: Rents rising fast (+5.0%/yr); 831 active listings in the ZIP; 655 units permitted in Iron County in 2024 (0 in 5+ unit buildings).
Forward outlook
- Local home prices are declining (-3.0%/yr); year-one equity from $1k of loan paydown is wiped out by about $6k of value loss. Plan a longer hold.
- Iron County population projected at +14% by 2050 — modest demand growth; plan on rents tracking national, not racing it.
Negotiation context
- It's been on market 123 days — a 12% lower offer ($172k) is reasonable based on typical stale-listing flexibility.
Risks & watch-outs
- Climate carrying-cost: major flood risk; moderate wildfire risk — expect insurance premiums to compound above CPI over the hold.
Questions for the listing agent
- What do current leases actually rent for vs. the listed asking? Can we see a recent rent roll and the last 12 months of T-12 income?
- It's been on market 123 days. Have you received any prior offers? Is the seller open to a 15% concession, seller financing, or rate buy-down credit?
- Why hasn't it sold? Are there any deal-killer items the seller is aware of (foundation, flood, title, zoning, code violations)?
- Is there a deadline driving the sale (1031 exchange, divorce, estate, relocation)? That informs how much negotiation room exists.
- The area grade is low — what's the realistic commute time and amenity access for the typical tenant pool here? Any planned neighborhood developments (good or bad) we should know about?
- What's the average days-on-market for RENTAL listings here right now (not sales)? A rising rental-DOM trend means longer vacancies and softer asking-rent achievability than the comps imply.
- What's the recent tenant-quality profile in this submarket — average credit score on applications, eviction rate, late-payment / NSF rate, and stable-employment percentage? A property-management company in the area should have these aggregated.
- How much new for-sale + rental construction is in the pipeline within 1–3 miles? Heavy new supply typically softens prices + rents 12–24 months out; constrained supply supports both.
Investment metrics
- 1% rule
- 0.85% ✗
- Cap rate
- 6.10%
- Cash-on-cash
- -0.69%
- DSCR
- 0.97
- GRM
- 9.8
CMA / ARV
No comps found within radius.
Projected returns pro-forma
-3.0% appreciation · 5.02% rent growth · sell at horizon
- IRR
- -15.2%
- Equity multiple
- 0.45×
- Total profit
- $-30,118
- Equity at exit
- $29,075
- IRR
- -3.5%
- Equity multiple
- 0.74×
- Total profit
- $-13,924
- Equity at exit
- $16,860
Cash invested: $54,600 (down + closing). Projections, not guarantees.
Landlord ↔ Tenant lean methodology
- Overall (STATE)
- 86 Strongly Landlord-Friendly
- State Utah
- 86 Strongly Landlord-Friendly · R+15
- County
- — inherits STATE
- City
- — inherits STATE
ZIP-level market 84721
- Rents YoY
- 5.0%
- Active inventory
- 831
- Price-to-rent
- 9.8×
Monthly cashflow live
- Estimated rent
- $1,666 medium interval (Pro) →
- Mortgage (P&I)
- −$1,023
- Tax est. 1.5%
- −$244 /mo · $2,925/yr
- Insurance
- −$81
- HOA
- −$0
- Vacancy / Maint / Mgmt
- −$350
- Net cashflow
- $-31
Break-even live
Sensitivity live
| Price | -10% $103 | -5% $36 | +0% $-31 | +5% $-99 | +10% $-166 |
|---|---|---|---|---|---|
| Rent | -10% $-163 | -5% $-97 | +0% $-31 | +5% $34 | +10% $100 |
| Rate | -1.0pp $67 | -0.5pp $18 | base $-31 | +0.5pp $-82 | +1.0pp $-133 |
UW: 25.0% down · 7.5% · 30yr · 1.5% tax · 5.0% vac · 8.0% maint · 8.0% mgmt
Financing live
Cash to close
- Down payment
- $48,750
- Closing costs
- $5,850
- Reserves months
- —
- Total cash needed
- —
Loan-product check · same deal, 3 products live
Conventional
25% down · 7.5% · 30yr
- Down + closing
- —
- Monthly P&I
- —
- Monthly cashflow
- —
- DSCR
- —
- Eligible?
- —
Personal DTI + credit; lowest rate.
DSCR
20% down · 8.5% · 30yr
- Down + closing
- —
- Monthly P&I
- —
- Monthly cashflow
- —
- DSCR
- —
- Eligible?
- —
No personal income docs; deal must DSCR.
Hard money
10% down · 12.0% · 12mo
- Down + closing
- —
- Monthly P&I
- —
- Monthly cashflow
- —
- DSCR
- —
- Eligible?
- —
Short-term bridge; refi at stabilization.
Listing history 2 events
-
2026-04-17status Pending
-
2025-12-15$195,000 Active
ⓘ Source: listings_history table (triggers on properties + properties_extension) + one-shot
backfill from property_details.listing_events for pre-trigger history.
Climate risk First Street
- Flood 6/10 Major 73% chance over 30 yrs
- Wildfire 5/10 Major
- Heat 3/10 Moderate 7 d/yr ≥91°F today · 22 d/yr by 30 yrs out
- Wind 1/10 Low
- Air quality 3/10 Moderate 2 unhealthy d/yr today · 2 by 30 yrs out
Nearby sold comps map
Loading sold comps map…
Walkable amenities ~0.75 mi
Loading nearby amenities…
Taxation est. · year 1
- Rental income
- $19,993
- − Mortgage interest
- −$10,923
- − Property taxes
- −$2,925
- − Insurance
- −$975
- − Repairs & maintenance
- −$1,599
- − Management
- −$1,599
- − Depreciation
- −$5,673
- Taxable loss
- −$3,701
- Est. tax savings @ 24.0%
- +$888
- After-tax cash flow
- $512/yr
For passive investors: Depreciation is non-cash, so a rental often shows a tax loss while cash-flowing — sheltering income. Rental losses are passive: they offset passive income freely, and up to $25,000/yr can offset ordinary (W-2) income if you actively participate and your MAGI is under $100k (phasing out to $0 by $150k); unused losses carry forward. On sale, claimed depreciation is recaptured at up to 25%, and gains may owe capital-gains tax (a 1031 exchange can defer both). Figures are a year-1 estimate at your 24.0% rate — not tax advice; consult a CPA.
Schools (NCES district)
- District
- Iron District
- NCES district ID
- 4900390
- Math proficiency
- 40% ▼ -9.00%
- Reading proficiency
- 44% ▼ -6.00%
- Median HH income
- $43,150
- Composite
- 35.49/100
- National rank
- #4922
- State rank
- #42 of 80 in UT
Livability — Cedar City
- Score
- 64/100
- State rank
- #170
- US rank
- #13398
Category grades
Schools grade is shown separately in the Schools card above.
Census & demographics
- Census place
- Cedar City, UT
- County
- Iron County · 56,349 people
- City population
- 56,349
- Metro
- Cedar City, UT
- Population (ZIP)
- 30,641
- Household income
- $67,299
- Rent vs Own
- Severe rent burden
- 736.0
Population outlook (Iron County) Hauer SSP2
- Today (2025)
- 53,029 people
- By 2030
- 55,084 · +3.9%
- By 2040
- 58,269 · +9.9%
- By 2050
- 60,462 · +14.0%
- By 2075
- 61,312 · +15.6%
- By 2100
- 57,973 · +9.3%
Race, ethnicity, and origin ACS 2023
- Neighborhood character
- Predominantly White (84%)
- Race & ethnicity
- White 84% Hispanic / Latino 12% Two or more races 6% Native American 1%
- Hispanic origin (detail)
- Mexican 10%
- Common ancestry
- Italian 6% Slovak 5% Portuguese 2%
- Foreign-born
- 3% · Canada, Jamaica
- Languages at home
- 92% English-only · Spanish 6%
Political lean MEDSL · Iron
- 2024 margin
- Solid R (+57.0) · D 20.4% · R 77.4% · Other 2.2%
- 2008→2024 swing
- -0.7pp no change · 2008: -56.3pp · 2024: -57.0pp
- All cycles
- 2024: R+57.0 2020: R+56.6 2016: R+51.6 2012: R+71.8 2008: R+56.3
Not yet ingested
- Civics
- —
Market trends
- HPI YoY
- ▼ -144.58%
- Current HPI
- 239.3105
- Rent YoY
- ▲ 5.02%
- Metro
- Cedar City, UT
- State GDP YoY
- ▲ 3.54%
- F500 in state
- 2
Industry mix (Fortune 500 HQ in UT)
| Industry | F500 HQs | Revenue |
|---|---|---|
| Financial Services | 1 | $3B |
|
||
Price history
2 events — show timeline
- 2026-04-17 Pending — ICBORMLS
- 2025-12-15 Listed $195,000 ICBORMLS
Cash-flow waterfall
monthlySold comps — $/sqft
last 12 mo · ≤1 miLoading sold comps…