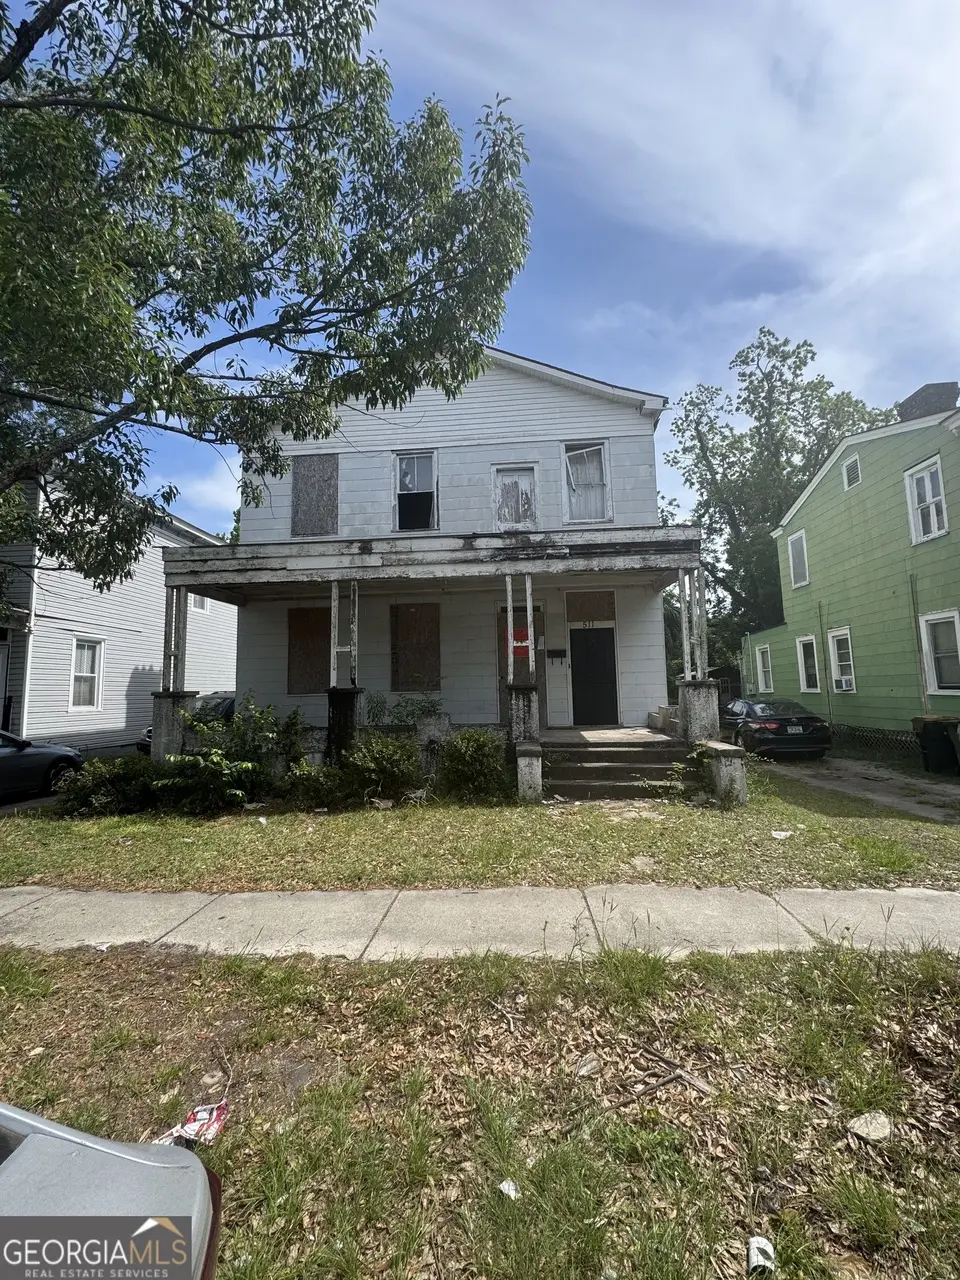
511 W 39th St · Savannah, GA
Flood risk 1/10 · Minimal
- FEMA flood zone
- X (unshaded)
- Chance of flooding over 30 yrs
- 0.0%
- Est. flood insurance / yr
- $507 – $1,088
Fire risk 3/10 · Minor
- Est. fire insurance / yr
- $963 – $1,789
Heat risk 10/10 · Severe
- Hot days now (above 108°F)
- 7 days/yr
- Hot days in 30 yrs
- 18 days/yr
Wind risk 9/10 · Severe
- Chance of severe wind over 30 yrs
- 99.0%
Air-quality risk 5/10 · Moderate
- Unhealthy air days now
- 7 days/yr
- Unhealthy air days in 30 yrs
- 8 days/yr
Risk factors via First Street. Map © Google.
Why this score? — see what drove the B- grade
The composite is a weighted blend of 9 inputs, each scored 0–100. Each bar is that input's sub-score; the figure is the points it added to the 100-point composite (weight × sub-score).
- Cash flow +30.0/30.0
- 1% rule +10.0/10.0
- DSCR +10.0/10.0
- ARV discount +7.5/15.0
- Livability +4.3/5.0
- Rent growth +2.5/5.0
- Condition / age +2.5/5.0
- Schools +2.0/10.0
- Appreciation +0.0/10.0
$129,900
🖨 Deal sheet 📄 Offer letter ✓ Due diligence
Listing remarks
Attention investors and DIY enthusiasts! Multiple exit strategies: finish this remodel then either flip, rent or move in! Home being sold as is.
Key facts
- 7,492 sq ft lot
- Built 1910
- Listed 21 days
Property features AI
Finance
- Other: Property listed As Is
- HOA & community: Association present with a fee of 525 (fee covers other items)
Exterior
- Parking: Off-street parking
- Utilities: Public water; Public sewer; Utilities described as other
- Home design: Single-family residence (house)
- Construction: Built in 1910
- Exterior features: Roof described as other; Construction materials described as other; Lot features described as other
Interior
- Kitchen: No appliances listed
- Bedrooms: Six bedrooms total, three on the main level
- Flooring: Flooring described as other
- Bathrooms: Two full bathrooms, one on the main level
- Heating & cooling: Heating provided (type listed as other); Central air conditioning
- Interior features: Two-level layout; Resale condition; No fireplaces
- Laundry & utility: Laundry features noted as other
Neighborhood map
What this means for you Summary
Snapshot
- This is a 5-bed/2.0-bath other listed at $130k.
Deal economics
- At list price, monthly cash flow is $1k ($17k/yr) — positive.
- The deal already cash-flows at list — no discount required.
- Meets the 1% rule at list price ($3k rent vs $130k).
- Recommended offer: $128k (1.5% below list) — sets the bar for market timing.
- Cap rate 19.4% vs local median 4.0% in Savannah — top-decile yield for the area; either an underpriced asset or a hidden risk that comps aren't pricing in. Stress-test before assuming the spread holds.
Location & tenants
- Location reads 86/100 on livability (#1 in GA, #397 nationally) — a professional / high-income tenant draw. Strengths: crime A+, amenities A+, commute A+; Watch: employment D.
- Savannah-Chatham County (urban): math 20% / reading 26% proficiency, ranked #134 of 174 in GA (top 77%) — low school quality limits family demand, transient renter base, plan for 1-2y turnover.
- Zoned schools: Beach High School (math 8% / reading 17%, grade F, #336 of 424 statewide, top 80%, 914 students, 79% FRL) — zoned schools average 79% FRL vs 59% district-wide (20 pts higher); higher-poverty schools than district average — tighter screening recommended.
- Market conditions: 76 active listings in the ZIP; 5 comparable units currently listed for rent nearby; rentals at typical pace (median 21d on market — plan ~3-4 weeks tenant-placement turnaround); lower-income renter base — watch delinquency; 2,694 units permitted in Chatham County in 2024 (973 in 5+ unit buildings).
- At $3,109/mo this rent would consume 101% of the median local household income ($37k/yr) (locally 613% of renters already pay >50% of income on rent) — very limited rent-growth headroom before tenants either downsize or default.
Forward outlook
- Local home prices are declining (-3.0%/yr); year-one equity from $898 of loan paydown is wiped out by about $4k of value loss. Plan a longer hold.
- Chatham County population projected at +33% by 2050 — long-run rental-demand tailwind backs the buy-and-hold thesis.
- At projected returns (-3.0% appreciation + 3.0% rent growth), your $36k cash investment doubles in ~3 years — after that, you're playing with house money.
Negotiation context
- It's been on market 21 days — a 2% lower offer ($128k) is reasonable based on typical stale-listing flexibility.
- Current owner paid $22k; list at $130k implies a 490% gain — meaningful room to come down on a strong offer.
Risks & watch-outs
- Watch-outs: built in 1910 — expect roof / HVAC / electrical / plumbing capex.
- Climate carrying-cost: severe wind risk, 99% chance of damaging wind over 30y; extreme-heat days projected 7→18/yr by 2055 (HVAC capex compounding) — expect insurance premiums to compound above CPI over the hold.
Questions for the listing agent
- Built in 1910 — when were the roof, HVAC, electrical panel, plumbing, and water heater last replaced?
- What does the HOA fee cover, when was the last increase, and are there any pending special assessments or reserve-fund shortfalls?
- Is there a deadline driving the sale (1031 exchange, divorce, estate, relocation)? That informs how much negotiation room exists.
- Schools are F-rated, which usually means shorter tenancies and higher turnover. Who's the typical renter profile here, and what's been the actual vacancy rate?
- What's the average days-on-market for RENTAL listings here right now (not sales)? A rising rental-DOM trend means longer vacancies and softer asking-rent achievability than the comps imply.
- What's the recent tenant-quality profile in this submarket — average credit score on applications, eviction rate, late-payment / NSF rate, and stable-employment percentage? A property-management company in the area should have these aggregated.
- How much new for-sale + rental construction is in the pipeline within 1–3 miles? Heavy new supply typically softens prices + rents 12–24 months out; constrained supply supports both.
Investment metrics
- 1% rule
- 2.39% ✓
- Cap rate
- 19.39%
- Cash-on-cash
- 46.77%
- DSCR
- 3.08
- GRM
- 3.5
CMA / ARV
No comps found within radius.
Projected returns pro-forma
-3.0% appreciation · 3.0% rent growth · sell at horizon
- IRR
- 44.1%
- Equity multiple
- 2.91×
- Total profit
- $69,371
- Equity at exit
- $19,369
- IRR
- 50.1%
- Equity multiple
- 5.87×
- Total profit
- $177,208
- Equity at exit
- $11,231
Cash invested: $36,372 (down + closing). Projections, not guarantees.
Landlord ↔ Tenant lean methodology
- Overall (STATE)
- 90 Strongly Landlord-Friendly
- State Georgia
- 90 Strongly Landlord-Friendly · R+3
- County
- — inherits STATE
- City
- — inherits STATE
ZIP-level market 31415
- Home prices YoY
- -21.4%
- Active inventory
- 76
- Price-to-rent
- 3.5×
Monthly cashflow live
- Estimated rent
- $3,109 medium interval (Pro) →
- Mortgage (P&I)
- −$681
- Tax from tax record
- −$260 /mo · $3,115/yr
- Insurance
- −$54
- HOA
- −$44
- Vacancy / Maint / Mgmt
- −$653
- Net cashflow
- $1,418
Break-even live
UW: 25.0% down · 7.5% · 30yr · 1.5% tax · 5.0% vac · 8.0% maint · 8.0% mgmt
Financing live
Cash to close
- Down payment
- $32,475
- Closing costs
- $3,897
- Reserves months
- —
- Total cash needed
- —
Loan-product check · same deal, 3 products live
Conventional
25% down · 7.5% · 30yr
- Down + closing
- —
- Monthly P&I
- —
- Monthly cashflow
- —
- DSCR
- —
- Eligible?
- —
Personal DTI + credit; lowest rate.
DSCR
20% down · 8.5% · 30yr
- Down + closing
- —
- Monthly P&I
- —
- Monthly cashflow
- —
- DSCR
- —
- Eligible?
- —
No personal income docs; deal must DSCR.
Hard money
10% down · 12.0% · 12mo
- Down + closing
- —
- Monthly P&I
- —
- Monthly cashflow
- —
- DSCR
- —
- Eligible?
- —
Short-term bridge; refi at stabilization.
Rent comps 5 comps
| Address | Beds | Baths | Sqft | Rent | $/sqft | DOM | Units | Dist |
|---|---|---|---|---|---|---|---|---|
| 637 E 39th St Savannah, GA | 4.0 | 3.0 | 2162 | $2,895 | $1.34 | 23d | 1 | 0.95mi |
| 524 E Duffy St Unit 1369217P Savannah, GA | 4.0 | 2.0 | 2152 | $5,801 | $2.70 | 23d | 1 | 1.01mi |
| 701 Maupas Ave Savannah, GA | 4.0 | 2.0 | 3000 | $3,500 | $1.17 | 13d | 1 | 1.03mi |
| 305 Alice St Unit 1244804P Savannah, GA | 4.0 | 4.5 | 1926 | $11,578 | $6.01 | 21d | 1 | 1.11mi |
| 809 E Henry St Savannah, GA | 5.0 | 2.0 | 3081 | $3,200 | $1.04 | 13d | 1 | 1.30mi |
HOA detail
- Monthly dues
- $44 · $528/yr
Listing history 18 events
-
2026-06-18days on market $129,900 Active 21 DOM
-
2026-06-17days on market $129,900 Active 20 DOM
-
2026-06-16days on market $129,900 Active 19 DOM
-
2026-06-15days on market $129,900 Active 18 DOM
-
2026-06-14days on market $129,900 Active 16 DOM
-
2026-06-13days on market $129,900 Active 15 DOM
-
2026-06-10days on market $129,900 Active 13 DOM
-
2026-06-09days on market $129,900 Active 12 DOM
-
2026-06-08statusdays on market $129,900 Active 11 DOM
-
2026-06-07pricedays on market $129,900 Price Change 10 DOM
-
2026-06-05pricestatusdays on market $149,900 Price Change 7 DOM
-
2026-06-03days on market $165,500 New 6 DOM
-
2026-06-02days on market $165,500 New 5 DOM
-
2026-06-01days on market $165,500 New 4 DOM
-
2026-05-31days on market $165,500 New 3 DOM
-
2026-05-30days on market $165,500 New 2 DOM
-
2026-05-28$165,500 New
-
1984-12-01soldstatus $22,000
ⓘ Source: listings_history table (triggers on properties + properties_extension) + one-shot
backfill from property_details.listing_events for pre-trigger history.
Tax reassessment forecast GA · Resets to sale price
- Current annual tax
- $3,115 · $260/mo
- Projected year-2 tax
- $3,115 · $260/mo
- Expected delta
- $0/yr ($0/mo · 0.0%)
ⓘ Screening estimate from a state-policy table — verify with the county assessor before closing.
Climate risk First Street
- Flood 1/10 Low FEMA zone X (unshaded) · 0% chance over 30 yrs
- Wildfire 3/10 Moderate
- Heat 10/10 Extreme 7 d/yr ≥108°F today · 18 d/yr by 30 yrs out
- Wind 9/10 Extreme 99% chance of damaging wind over 30 yrs
- Air quality 5/10 Major 7 unhealthy d/yr today · 8 by 30 yrs out
Nearby sold comps map
Loading sold comps map…
Walkable amenities ~0.75 mi
Loading nearby amenities…
Taxation est. · year 1
- Rental income
- $37,313
- − Mortgage interest
- −$7,276
- − Property taxes
- −$3,115
- − Insurance
- −$650
- − Repairs & maintenance
- −$2,985
- − Management
- −$2,985
- − HOA
- −$528
- − Depreciation
- −$3,779
- Taxable income
- $15,996
- Est. tax owed @ 24.0%
- −$3,839
- After-tax cash flow
- $13,172/yr
For passive investors: Depreciation is non-cash, so a rental often shows a tax loss while cash-flowing — sheltering income. Rental losses are passive: they offset passive income freely, and up to $25,000/yr can offset ordinary (W-2) income if you actively participate and your MAGI is under $100k (phasing out to $0 by $150k); unused losses carry forward. On sale, claimed depreciation is recaptured at up to 25%, and gains may owe capital-gains tax (a 1031 exchange can defer both). Figures are a year-1 estimate at your 24.0% rate — not tax advice; consult a CPA.
Schools (NCES district)
- District
- Savannah-Chatham County
- NCES district ID
- 1301020
- Math proficiency
- 20% ▼ -11.00%
- Reading proficiency
- 26% ▼ -5.00%
- Median HH income
- $47,443
- Composite
- 20.14/100
- National rank
- #8639
- State rank
- #134 of 174 in GA
Livability — Savannah
- Score
- 86/100
- State rank
- #1
- US rank
- #397
Category grades
Schools grade is shown separately in the Schools card above.
Census & demographics
- Census place
- Savannah, GA
- County
- Chatham County · 271,602 people
- City population
- 216,564
- Metro
- Savannah, GA
- Population (ZIP)
- 11,082
- Household income
- $37,109
- Rent vs Own
- Severe rent burden
- 613.0
Population outlook (Chatham County) Hauer SSP2
- Today (2025)
- 332,584 people
- By 2030
- 355,508 · +6.9%
- By 2040
- 400,030 · +20.3%
- By 2050
- 443,019 · +33.2%
- By 2075
- 534,579 · +60.7%
- By 2100
- 583,863 · +75.6%
Race, ethnicity, and origin ACS 2023
- Neighborhood character
- Predominantly Black (89%)
- Race & ethnicity
- Black 89% White 5% Hispanic / Latino 5% Two or more races 3%
- Foreign-born
- 2% · Canada
- Languages at home
- 95% English-only · Spanish 4%
Political lean MEDSL · Chatham
- 2024 margin
- D (+18.0) · D 58.6% · R 40.6%
- 2008→2024 swing
- +3.6pp toward D · 2008: 14.4pp · 2024: 18.0pp
- All cycles
- 2024: D+18.0 2020: D+18.8 2016: D+14.5 2012: D+12.0 2008: D+14.4
Not yet ingested
- Civics
- —
Market trends
- HPI YoY
- ▼ -55.36%
- Current HPI
- 203.0696
- Rent YoY
- —
- Metro
- Savannah, GA
- State GDP YoY
- ▲ 2.66%
- F500 in state
- 28
Industry mix (Fortune 500 HQ in GA)
| Industry | F500 HQs | Revenue |
|---|---|---|
| Paper / Packaging | 2 | $29B |
|
||
| Retail | 1 | $160B |
|
||
| Transportation / Logistics | 1 | $91B |
|
||
| Airlines | 1 | $62B |
|
||
| Consumer Goods | 1 | $47B |
|
||
| Utilities | 1 | $25B |
|
||
Price history
+652.3% since first listed2 events — show timeline
- 2026-05-28 Listed $165,500 GAMLS
- 1984-12-01 Sold (Public Records) $22,000 Public Records
Property tax history
+9.2%/yrLatest (2025): $3,115 · -19.7% YoY. Source: county tax records.
Cash-flow waterfall
monthlySold comps — $/sqft
last 12 mo · ≤1 miLoading sold comps…