 Triplex
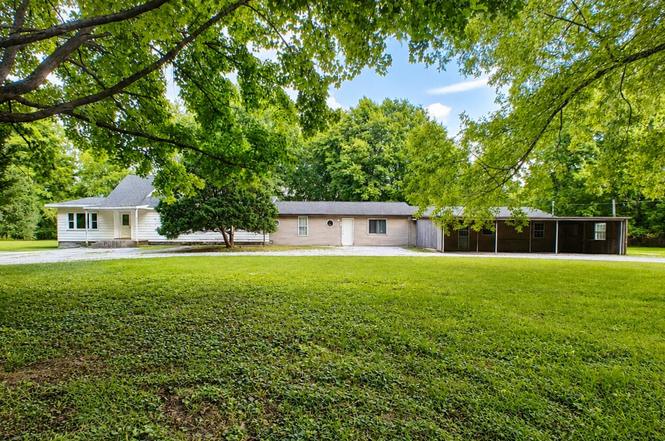
6290 S State Road 10 · Bass Lake, IN
Flood risk 4/10 · Minor
- FEMA flood zone
- X (unshaded)
- Chance of flooding over 30 yrs
- 0.2%
- Est. flood insurance / yr
- $507 – $1,088
Fire risk 1/10 · Minimal
- Est. fire insurance / yr
- $717 – $1,331
Heat risk 2/10 · Minimal
- Hot days now (above 100°F)
- 7 days/yr
- Hot days in 30 yrs
- 16 days/yr
Wind risk 2/10 · Minimal
- Chance of severe wind over 30 yrs
- —
Air-quality risk 3/10 · Minor
- Unhealthy air days now
- 2 days/yr
- Unhealthy air days in 30 yrs
- 3 days/yr
Risk factors via First Street. Map © Google.
Why this score? — see what drove the B- grade
The composite is a weighted blend of 9 inputs, each scored 0–100. Each bar is that input's sub-score; the figure is the points it added to the 100-point composite (weight × sub-score).
- Cash flow +30.0/30.0
- DSCR +10.0/10.0
- 1% rule +7.9/10.0
- ARV discount +7.5/15.0
- Livability +3.1/5.0
- Schools +2.6/10.0
- Rent growth +2.5/5.0
- Condition / age +2.5/5.0
- Appreciation +0.0/10.0
$419,900
🖨 Deal sheet 📄 Offer letter ✓ Due diligence
Multi-family units
County records classify this as Multi-Family (2-4 Unit). Listing-text estimate: 3 units. confirmed
Listing remarks
PROFITABLE 3-UNIT INVESTMENT PROPERTY AT BASS LAKE - Situated on nearly 3 acres, this property offers strong rental potential along with excellent recreational appeal. Residents and guests enjoy deeded Bass Lake access within walking distance. 3rd unit newly remodeled with new paint and flooring. Beautiful lawn for plenty of outdoor space and parking. S SR 10, Knox.
Key facts
- Nearly 3 acres
- Newly remodeled unit
- 2.84 acre lot
Tags
Property features AI
Finance
- Other: Assessor used for living area and lot size source; Property configured as a multi-unit building with 3 units (two 2-bed units, one 3-bed unit); Total of 14 rooms
Exterior
- Parking: Driveway; Off-street parking; Gravel parking
- Utilities: Natural gas connected; Electricity connected; Cable available; Well water; Public sewer
- Home design: One and one-half story structure; Built in 1945
- Construction: Asphalt shingle roof; Crawl space foundation
- Exterior features: Lake and rural views; Shed(s)
Interior
- Kitchen: No appliances included
- Bedrooms: Three 2-bedroom units and one 3-bedroom unit (property contains 3 total units: two 2-bed and one 3-bed)
- Flooring: Laminate; Vinyl; Tile
- Bathrooms: 4 full bathrooms
- Heating & cooling: Central heating (natural gas, forced air); Central air conditioning
- Interior features: Ceiling fans; Laminate counters
- Laundry & utility: Laundry room with washer hookup and gas dryer hookup
Neighborhood map
What this means for you Summary
Snapshot
- This is a 3 × 2-bed/1.3-bath units multifamily listed at $420k.
Deal economics
- At list price, monthly cash flow is $2k ($20k/yr) — positive. Per door: $550/mo.
- The deal already cash-flows at list — no discount required.
- Meets the 1% rule at list price ($5k rent vs $420k).
- Cap rate 11.0% vs local median 4.5% in Bass Lake — top-decile yield for the area; either an underpriced asset or a hidden risk that comps aren't pricing in. Stress-test before assuming the spread holds.
Location & tenants
- Location reads 61/100 on livability (#494 in IN) — a middle-class / working-renter tenant base. Strengths: crime A+, cost of living A+, housing A; Watch: employment C-, schools F, amenities F.
- Knox Community School Corporation (town): math 27% / reading 34% proficiency, ranked #242 of 301 in IN (top 80%) — families likely to look elsewhere, expect single-tenant / working-renter base with shorter leases.
- Market conditions: 146 active listings in the ZIP; 58 units permitted in Starke County in 2024 (0 in 5+ unit buildings).
Forward outlook
- Local home prices are declining (-3.0%/yr); year-one equity from $3k of loan paydown is wiped out by about $13k of value loss. Plan a longer hold.
- Starke County population projected at -23% by 2050 — secular population decline; favor cash flow + early exit over multi-decade hold.
- At projected returns (-3.0% appreciation + 3.0% rent growth), your $118k cash investment doubles in ~8 years — after that, you're playing with house money.
Negotiation context
- Only 3 days on market — expect competitive offers; lowballing is unlikely to land.
- 2 sale attempts since 22y ago with the ask held roughly flat each time — persistent listings suggest the price (not the market) is what's stuck; bring a comps-based counter.
Risks & watch-outs
- Watch-outs: built in 1945 — expect roof / HVAC / electrical / plumbing capex.
Questions for the listing agent
- Can we see the unit-by-unit rent roll, current vacancy, and any below-market leases? What's the average tenancy length?
- What capital expenditures (roof, boiler, parking lot, exteriors) have been made in the last 5 years, and what's planned in the next 2?
- Built in 1945 — when were the roof, HVAC, electrical panel, plumbing, and water heater last replaced?
- Is there a deadline driving the sale (1031 exchange, divorce, estate, relocation)? That informs how much negotiation room exists.
- Schools are F-rated, which usually means shorter tenancies and higher turnover. Who's the typical renter profile here, and what's been the actual vacancy rate?
- What's the average days-on-market for RENTAL listings here right now (not sales)? A rising rental-DOM trend means longer vacancies and softer asking-rent achievability than the comps imply.
- What's the recent tenant-quality profile in this submarket — average credit score on applications, eviction rate, late-payment / NSF rate, and stable-employment percentage? A property-management company in the area should have these aggregated.
- How much new apartment / multifamily construction is in the pipeline within 1–3 miles? Heavy new supply (>2% of stock underway) typically softens rents 12–24 months out; light construction supports rent growth.
Investment metrics
- 1% rule
- 1.29% ✓
- Cap rate
- 11.01%
- Cash-on-cash
- 16.83%
- DSCR
- 1.75
- GRM
- 6.5
CMA / ARV
No comps found within radius.
Projected returns pro-forma
-3.0% appreciation · 3.0% rent growth · sell at horizon
- IRR
- 8.0%
- Equity multiple
- 1.31×
- Total profit
- $36,881
- Equity at exit
- $62,608
- IRR
- 17.3%
- Equity multiple
- 2.42×
- Total profit
- $166,964
- Equity at exit
- $36,305
Cash invested: $117,572 (down + closing). Projections, not guarantees.
Landlord ↔ Tenant lean methodology
- Overall (STATE)
- 90 Strongly Landlord-Friendly
- State Indiana
- 90 Strongly Landlord-Friendly · R+11
- County
- — inherits STATE
- City
- — inherits STATE
ZIP-level market 46534
- Home prices YoY
- -19.2%
- Active inventory
- 146
- Price-to-rent
- 19.4×
Monthly cashflow live
- Estimated rent
- $5,402 medium interval (Pro) →
- Mortgage (P&I)
- −$2,202
- Tax from tax record
- −$242 /mo · $2,901/yr
- Insurance
- −$175
- HOA
- −$0
- Vacancy / Maint / Mgmt
- −$1,134
- Net cashflow
- $1,649
Break-even live
Sensitivity live
| Price | -10% $1,887 | -5% $1,768 | +0% $1,649 | +5% $1,530 | +10% $1,411 |
|---|---|---|---|---|---|
| Rent | -10% $1,222 | -5% $1,435 | +0% $1,649 | +5% $1,862 | +10% $2,076 |
| Rate | -1.0pp $1,860 | -0.5pp $1,756 | base $1,649 | +0.5pp $1,540 | +1.0pp $1,429 |
3-unit breakdown (identical units grouped — click to expand)
| Units | Beds | Baths | Est. rent |
|---|---|---|---|
| 3× units | 2 | 1.3 | $5,403 |
| #1 | 2 | 1.3 | $1,801 |
| #2 | 2 | 1.3 | $1,801 |
| #3 | 2 | 1.3 | $1,801 |
| Total (3 units) | $5,402 | ||
UW: 25.0% down · 7.5% · 30yr · 1.5% tax · 5.0% vac · 8.0% maint · 8.0% mgmt
Financing live
Cash to close
- Down payment
- $104,975
- Closing costs
- $12,597
- Reserves months
- —
- Total cash needed
- —
Loan-product check · same deal, 3 products live
Conventional
25% down · 7.5% · 30yr
- Down + closing
- —
- Monthly P&I
- —
- Monthly cashflow
- —
- DSCR
- —
- Eligible?
- —
Personal DTI + credit; lowest rate.
DSCR
20% down · 8.5% · 30yr
- Down + closing
- —
- Monthly P&I
- —
- Monthly cashflow
- —
- DSCR
- —
- Eligible?
- —
No personal income docs; deal must DSCR.
Hard money
10% down · 12.0% · 12mo
- Down + closing
- —
- Monthly P&I
- —
- Monthly cashflow
- —
- DSCR
- —
- Eligible?
- —
Short-term bridge; refi at stabilization.
Listing history 4 events
-
2026-06-19days on market $419,900 Active 3 DOM
-
2026-06-18days on market $419,900 Active 2 DOM
-
2026-06-17remarks 368-char remark
-
2026-06-17$419,900 Active 1 DOM
ⓘ Source: listings_history table (triggers on properties + properties_extension) + one-shot
backfill from property_details.listing_events for pre-trigger history.
Tax reassessment forecast IN · Partial reset (capped growth)
- Current annual tax
- $2,901 · $242/mo
- Projected year-2 tax
- $3,235 · $270/mo
- Expected delta
- +$334/yr (+$28/mo · 11.5%)
ⓘ Screening estimate from a state-policy table — verify with the county assessor before closing.
Climate risk First Street
- Flood 4/10 Moderate FEMA zone X (unshaded) · 20% chance over 30 yrs
- Wildfire 1/10 Low
- Heat 2/10 Low 7 d/yr ≥100°F today · 16 d/yr by 30 yrs out
- Wind 2/10 Low
- Air quality 3/10 Moderate 2 unhealthy d/yr today · 3 by 30 yrs out
Nearby sold comps map
Loading sold comps map…
Walkable amenities ~0.75 mi
Loading nearby amenities…
Taxation est. · year 1
- Rental income
- $64,824
- − Mortgage interest
- −$23,521
- − Property taxes
- −$2,901
- − Insurance
- −$2,100
- − Repairs & maintenance
- −$5,186
- − Management
- −$5,186
- − Depreciation
- −$12,215
- Taxable income
- $13,715
- Est. tax owed @ 24.0%
- −$3,292
- After-tax cash flow
- $16,494/yr
For passive investors: Depreciation is non-cash, so a rental often shows a tax loss while cash-flowing — sheltering income. Rental losses are passive: they offset passive income freely, and up to $25,000/yr can offset ordinary (W-2) income if you actively participate and your MAGI is under $100k (phasing out to $0 by $150k); unused losses carry forward. On sale, claimed depreciation is recaptured at up to 25%, and gains may owe capital-gains tax (a 1031 exchange can defer both). Figures are a year-1 estimate at your 24.0% rate — not tax advice; consult a CPA.
Schools (NCES district)
- District
- Knox Community School Corporation
- NCES district ID
- 1805340
- Math proficiency
- 27% ▼ -9.00%
- Reading proficiency
- 34% ▼ -8.00%
- Median HH income
- $39,955
- Composite
- 25.64/100
- National rank
- #7401
- State rank
- #242 of 301 in IN
Livability — Bass Lake
- Score
- 61/100
- State rank
- #494
- US rank
- #17594
Category grades
Schools grade is shown separately in the Schools card above.
Census & demographics
- Census place
- Bass Lake, IN
- Population (ZIP)
- 11,029
Population outlook (Starke County) Hauer SSP2
- Today (2025)
- 21,860 people
- By 2030
- 21,024 · -3.8%
- By 2040
- 19,041 · -12.9%
- By 2050
- 16,881 · -22.8%
- By 2075
- 11,880 · -45.7%
- By 2100
- 7,217 · -67.0%
Race, ethnicity, and origin ACS 2023
- Neighborhood character
- Predominantly White (92%)
- Race & ethnicity
- White 92% Hispanic / Latino 4% Two or more races 3%
- Common ancestry
- Romanian 5% Lithuanian 2% Slovak 2%
- Foreign-born
- 2% · Canada
- Languages at home
- 96% English-only · Spanish 2% Other Indo-European 2% German/W. Germanic 1%
Political lean MEDSL · Starke
- 2024 margin
- Solid R (+52.0) · D 23.2% · R 75.3% · Other 1.5%
- 2008→2024 swing
- -55.3pp toward R · 2008: 3.2pp · 2024: -52.0pp
- All cycles
- 2024: R+52.0 2020: R+46.8 2016: R+42.0 2012: R+10.6 2008: D+3.2
Not yet ingested
- Civics
- —
Market trends
- HPI YoY
- ▼ -58.15%
- Current HPI
- 244.2216
- Rent YoY
- —
- Metro
- —
- State GDP YoY
- ▲ 2.90%
- F500 in state
- 18
Industry mix (Fortune 500 HQ in IN)
| Industry | F500 HQs | Revenue |
|---|---|---|
| Industrial Machinery | 2 | $37B |
|
||
| Healthcare | 1 | $177B |
|
||
| Pharmaceuticals | 1 | $45B |
|
||
| Metals / Steel | 1 | $18B |
|
||
| Agriculture | 1 | $17B |
|
||
| Packaging | 1 | $12B |
|
||
Price history
+133.4% since first listed2 events — show timeline
- 2026-06-16 Listed $419,900 NIRA MLS as Distributed by MLS Grid
- 2004-08-09 Listed $179,900 NIRA MLS as Distributed by MLS Grid
Property tax history
+2.5%/yrLatest (2024): $2,901 · -6.6% YoY. Source: county tax records.
Cash-flow waterfall
monthlySold comps — $/sqft
last 12 mo · ≤1 miLoading sold comps…