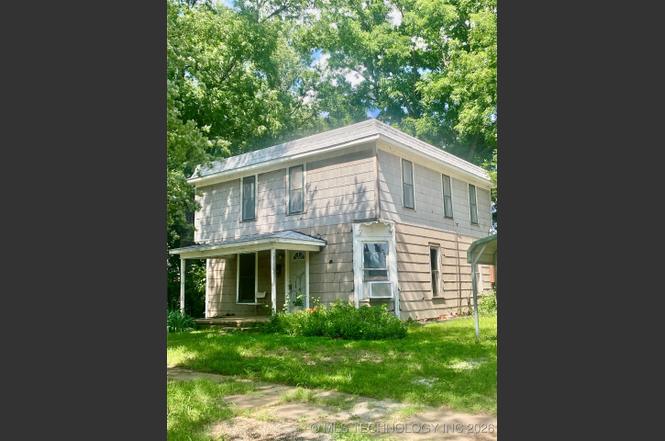
103 S Dunlap St · Cleveland, OK
Flood risk 1/10 · Minimal
- FEMA flood zone
- —
- Chance of flooding over 30 yrs
- 0.0%
- Est. flood insurance / yr
- —
Fire risk 5/10 · Moderate
- Est. fire insurance / yr
- $2,463 – $4,575
Heat risk 6/10 · Moderate
- Hot days now (above 110°F)
- 7 days/yr
- Hot days in 30 yrs
- 20 days/yr
Wind risk 2/10 · Minimal
- Chance of severe wind over 30 yrs
- 4.0%
Air-quality risk 2/10 · Minimal
- Unhealthy air days now
- 0 days/yr
- Unhealthy air days in 30 yrs
- 1 days/yr
Risk factors via First Street. Map © Google.
Why this score? — see what drove the B+ grade
The composite is a weighted blend of 9 inputs, each scored 0–100. Each bar is that input's sub-score; the figure is the points it added to the 100-point composite (weight × sub-score).
- Cash flow +30.0/30.0
- 1% rule +10.0/10.0
- DSCR +10.0/10.0
- Appreciation +10.0/10.0
- ARV discount +7.5/15.0
- Livability +3.4/5.0
- Rent growth +2.5/5.0
- Condition / age +2.5/5.0
- Schools +1.8/10.0
$69,500
🖨 Deal sheet (PDF) 📄 Offer letter ✓ Due diligence
Listing remarks
Historical five bedroom one bathroom home is ready for your renovations and updates. Unique two story home located on the quiet side of Keystone Lake in the city of Cleveland, Oklahoma. Nearby public hunting and fishing provide the lake life you've been dreaming of. Updated roof and huge layout, five spacious bedrooms, additional features include a storage shed near the fully fenced backyard and an in ground storm shelter. Turn this in to your next dream home or this could make a great duplex rental with a few upgrades. The boat ramp on Keystone Lake is less than one mile away, and only a thrity minute drive to Tulsa. Call or click the listing agent and book your private showing today!
Key facts
- Covered carport area
- Two expansive lots
- Ample parking
Tags
Property features AI
Finance
- HOA & community: Gutters noted as a community feature
Exterior
- Parking: Detached garage; 2-car garage spaces; Carport; RV access/parking; Boat parking; On-site storage
- Security: Storm shelter
- Utilities: Public water; Public sewer; Electricity available; Natural gas available; Cable available; Phone available
- Home design: Two-story home; Faces southwest; Crawlspace foundation
- Construction: Wood frame construction; Asphalt/fiberglass roof
- Exterior features: Covered porch; Rain gutters; Shed/storage; Chain-link fence; Storm shelter
Interior
- Kitchen: Kitchen with breakfast nook
- Bedrooms: One bedroom on the first floor; Four bedrooms on the second floor
- Flooring: Carpet; Hardwood; Laminate; Plywood; Tile
- Bathrooms: One full bathroom (hall bath with bathtub)
- Heating & cooling: Gas heating; Window air conditioning units
- Interior features: Wood-frame windows; Other interior features
- Laundry & utility: Gas dryer hookup; Electric water heater
Neighborhood map
What this means for you Summary
Snapshot
- This is a 3-bed/1.0-bath single-family listed at $70k.
Deal economics
- At list price, monthly cash flow is $878 ($11k/yr) — positive.
- The deal already cash-flows at list — no discount required.
- Meets the 1% rule at list price ($2k rent vs $70k).
- Recommended offer: $61k (12.0% below list) — sets the bar for market timing.
- Cap rate 21.4% vs local median 6.6% in Cleveland — top-decile yield for the area; either an underpriced asset or a hidden risk that comps aren't pricing in. Stress-test before assuming the spread holds.
Location & tenants
- Location reads 67/100 on livability (#93 in OK) — a middle-class / working-renter tenant base. Strengths: cost of living A+, housing A+; Watch: crime C-, employment C-, amenities F.
- Cleveland (town): math 21% / reading 19% proficiency, ranked #169 of 270 in OK (top 63%) — low school quality limits family demand, transient renter base, plan for 1-2y turnover.
- Zoned schools: Cleveland Primary Es (411 students, 0% FRL); Cleveland Ms (math 17% / reading 14%, grade F, #215 of 345 statewide, top 63%, 410 students, 0% FRL); Cleveland Hs (math 17% / reading 27%, grade F, #222 of 447 statewide, top 52%, 483 students, 0% FRL) — zoned schools average 0% FRL vs 56% district-wide (56 pts lower); this property's tenant base skews higher-income than the district average.
- Market conditions: 90 active listings in the ZIP; 3 units permitted in Pawnee County in 2024 (0 in 5+ unit buildings).
Forward outlook
- In year one you build about $7k of equity ($481 loan paydown + $7k appreciation (10.0% local appreciation)).
- Pawnee County population projected to shrink 4% by 2050 — rents likely to lag national; underwrite the cash flow, not the appreciation.
- At projected returns (10.0% appreciation + 3.0% rent growth), your $19k cash investment doubles in ~2 years — after that, you're playing with house money.
- By year 5, paydown + projected appreciation supports a ~$35k cash-out refi (75% LTV) — recoverable capital for the next deal without selling this one.
Negotiation context
- It's been on market 353 days — a 12% lower offer ($61k) is reasonable based on typical stale-listing flexibility.
Risks & watch-outs
- Watch-outs: built in 1920 — expect roof / HVAC / electrical / plumbing capex.
- Climate carrying-cost: moderate wildfire risk; extreme-heat days projected 7→20/yr by 2055 (HVAC capex compounding) — expect insurance premiums to compound above CPI over the hold.
Questions for the listing agent
- It's been on market 353 days. Have you received any prior offers? Is the seller open to a 12% concession, seller financing, or rate buy-down credit?
- Built in 1920 — when were the roof, HVAC, electrical panel, plumbing, and water heater last replaced?
- Why hasn't it sold? Are there any deal-killer items the seller is aware of (foundation, flood, title, zoning, code violations)?
- Is there a deadline driving the sale (1031 exchange, divorce, estate, relocation)? That informs how much negotiation room exists.
- Schools are D-rated, which usually means shorter tenancies and higher turnover. Who's the typical renter profile here, and what's been the actual vacancy rate?
- What's the average days-on-market for RENTAL listings here right now (not sales)? A rising rental-DOM trend means longer vacancies and softer asking-rent achievability than the comps imply.
- What's the recent tenant-quality profile in this submarket — average credit score on applications, eviction rate, late-payment / NSF rate, and stable-employment percentage? A property-management company in the area should have these aggregated.
- How much new for-sale + rental construction is in the pipeline within 1–3 miles? Heavy new supply typically softens prices + rents 12–24 months out; constrained supply supports both.
Investment metrics
- 1% rule
- 2.39% ✓
- Cap rate
- 21.45%
- Cash-on-cash
- 54.13%
- DSCR
- 3.41
- GRM
- 3.5
CMA / ARV
- ARV (on-the-fly)
- $212,160
- Comps found
- 9
Show comp detail 9 sales within ~0.75 mi
| Address | Dist | Beds/Ba | Sqft | Sold | Price | $/sf | Match |
|---|---|---|---|---|---|---|---|
| 512 Cherokee St | 0.51mi | 4/1.5 (+1) | 2,112 (+4%) | 1mo | $179,500 | $85 | 63 |
| 204 N Dunlap St | 0.14mi | 4/2.0 (+1) | 2,228 (+9%) | 9mo | $87,930 | $39 | 62 |
| 306 N Division St | 0.34mi | 3/2.0 | 2,240 (+10%) | 10mo | $235,000 | $105 | 56 |
| 205 E Cherokee St | 0.06mi | 4/2.0 (+1) | 1,804 (-12%) | 21mo | $60,000 | $33 | 52 |
| 711 N Broadway St | 0.54mi | 3/2.0 | 1,901 (-7%) | 12mo | $198,000 | $104 | 49 |
| 514 W Wichita Ave | 0.57mi | 3/1.5 | 1,824 (-11%) | 7mo | $92,000 | $50 | 48 |
| 500 W Delaware St | 0.46mi | 3/2.5 | 1,860 (-9%) | 13mo | $205,000 | $110 | 47 |
| 309 W Kaw Ave | 0.66mi | 3/2.0 | 1,862 (-9%) | 11mo | $220,000 | $118 | 42 |
| 604 N D Ave | 0.64mi | 3/2.0 | 1,923 (-6%) | 20mo | $208,500 | $108 | 40 |
Match score weights: distance 35% · size 25% · config 20% · recency 20%. Top-matched comps best support the ARV.
Projected returns pro-forma
10.0% appreciation · 3.0% rent growth · sell at horizon
- IRR
- 67.1%
- Equity multiple
- 5.82×
- Total profit
- $93,756
- Equity at exit
- $62,611
- IRR
- 60.8%
- Equity multiple
- 12.93×
- Total profit
- $232,124
- Equity at exit
- $135,023
Cash invested: $19,460 (down + closing). Projections, not guarantees.
Landlord ↔ Tenant lean methodology
- Overall (STATE)
- 83 Strongly Landlord-Friendly
- State Oklahoma
- 83 Strongly Landlord-Friendly · R+20
- County
- — inherits STATE
- City
- — inherits STATE
ZIP-level market 74020
- Home prices YoY
- 6.9%
- Active inventory
- 90
- Price-to-rent
- 3.5×
Monthly cashflow live
- Estimated rent
- $1,660 medium interval (Pro) →
- Mortgage (P&I)
- −$364
- Tax from tax record
- −$40 /mo · $486/yr
- Insurance
- −$29
- HOA
- −$0
- Vacancy / Maint / Mgmt
- −$349
- Net cashflow
- $878
Break-even live
Sensitivity live
| Price | -10% $917 | -5% $897 | +0% $878 | +5% $858 | +10% $838 |
|---|---|---|---|---|---|
| Rent | -10% $747 | -5% $812 | +0% $878 | +5% $943 | +10% $1,009 |
| Rate | -1.0pp $913 | -0.5pp $895 | base $878 | +0.5pp $860 | +1.0pp $841 |
UW: 25.0% down · 7.5% · 30yr · 1.5% tax · 5.0% vac · 8.0% maint · 8.0% mgmt
Financing live
Cash to close
- Down payment
- $17,375
- Closing costs
- $2,085
- Reserves months
- —
- Total cash needed
- —
Loan-product check · same deal, 3 products live
Conventional
25% down · 7.5% · 30yr
- Down + closing
- —
- Monthly P&I
- —
- Monthly cashflow
- —
- DSCR
- —
- Eligible?
- —
Personal DTI + credit; lowest rate.
DSCR
20% down · 8.5% · 30yr
- Down + closing
- —
- Monthly P&I
- —
- Monthly cashflow
- —
- DSCR
- —
- Eligible?
- —
No personal income docs; deal must DSCR.
Hard money
10% down · 12.0% · 12mo
- Down + closing
- —
- Monthly P&I
- —
- Monthly cashflow
- —
- DSCR
- —
- Eligible?
- —
Short-term bridge; refi at stabilization.
Listing history 21 events
-
2026-06-21days on market $69,500 Active 353 DOM
-
2026-06-18days on market $69,500 Active 350 DOM
-
2026-06-17days on market $69,500 Active 349 DOM
-
2026-06-16days on market $69,500 Active 348 DOM
-
2026-06-15days on market $69,500 Active 347 DOM
-
2026-06-13days on market $69,500 Active 345 DOM
-
2026-06-10days on market $69,500 Active 342 DOM
-
2026-06-09days on market $69,500 Active 341 DOM
-
2026-06-08days on market $69,500 Active 340 DOM
-
2026-06-07days on market $69,500 Active 339 DOM
-
2026-06-03days on market $69,500 Active 335 DOM
-
2026-06-02days on market $69,500 Active 334 DOM
-
2026-06-01days on market $69,500 Active 333 DOM
-
2026-05-31days on market $69,500 Active 332 DOM
-
2026-05-02price $69,500
-
2026-03-15price $77,500
-
2026-02-08price $82,500
-
2025-11-20price $87,500
-
2025-10-02price $91,500
-
2025-08-02price $94,000
-
2025-07-03$99,000 Active
ⓘ Source: listings_history table (triggers on properties + properties_extension) + one-shot
backfill from property_details.listing_events for pre-trigger history.
Tax reassessment forecast OK · Resets to sale price
- Current annual tax
- $486 · $40/mo
- Projected year-2 tax
- $626 · $52/mo
- Expected delta
- +$140/yr (+$12/mo · 28.7%)
ⓘ Screening estimate from a state-policy table — verify with the county assessor before closing.
Climate risk First Street
- Flood 1/10 Low 0% chance over 30 yrs
- Wildfire 5/10 Major
- Heat 6/10 Major 7 d/yr ≥110°F today · 20 d/yr by 30 yrs out
- Wind 2/10 Low 4% chance of damaging wind over 30 yrs
- Air quality 2/10 Low 0 unhealthy d/yr today · 1 by 30 yrs out
Nearby sold comps map
Loading sold comps map…
Walkable amenities ~0.75 mi
Loading nearby amenities…
Taxation est. · year 1
- Rental income
- $19,925
- − Mortgage interest
- −$3,893
- − Property taxes
- −$486
- − Insurance
- −$348
- − Repairs & maintenance
- −$1,594
- − Management
- −$1,594
- − Depreciation
- −$2,022
- Taxable income
- $9,989
- Est. tax owed @ 24.0%
- −$2,397
- After-tax cash flow
- $8,136/yr
For passive investors: Depreciation is non-cash, so a rental often shows a tax loss while cash-flowing — sheltering income. Rental losses are passive: they offset passive income freely, and up to $25,000/yr can offset ordinary (W-2) income if you actively participate and your MAGI is under $100k (phasing out to $0 by $150k); unused losses carry forward. On sale, claimed depreciation is recaptured at up to 25%, and gains may owe capital-gains tax (a 1031 exchange can defer both). Figures are a year-1 estimate at your 24.0% rate — not tax advice; consult a CPA.
Schools (NCES district)
- District
- Cleveland
- NCES district ID
- 4008040
- Math proficiency
- 21% ▼ -6.00%
- Reading proficiency
- 19% ▼ -11.00%
- Median HH income
- $45,642
- Composite
- 17.52/100
- National rank
- #9049
- State rank
- #169 of 270 in OK
Livability — Cleveland
- Score
- 67/100
- State rank
- #93
- US rank
- #10844
Category grades
Schools grade is shown separately in the Schools card above.
Census & demographics
- Census place
- Cleveland, OK
- Population (ZIP)
- 7,365
Population outlook (Pawnee County) Hauer SSP2
- Today (2025)
- 16,219 people
- By 2030
- 16,028 · -1.2%
- By 2040
- 15,724 · -3.1%
- By 2050
- 15,563 · -4.0%
- By 2075
- 15,905 · -1.9%
- By 2100
- 16,058 · -1.0%
Race, ethnicity, and origin ACS 2023
- Neighborhood character
- Predominantly White (77%)
- Race & ethnicity
- White 77% Two or more races 12% Native American 6% Hispanic / Latino 4% Black 1%
- Common ancestry
- Slovak 2% Lithuanian 2% Iranian 1%
- Foreign-born
- 1% · Canada
- Languages at home
- 96% English-only · Spanish 2% Other Asian/Pacific 1%
Political lean MEDSL · Pawnee
- 2024 margin
- Solid R (+58.9) · D 19.7% · R 78.6% · Other 1.7%
- 2008→2024 swing
- -21.4pp toward R · 2008: -37.4pp · 2024: -58.9pp
- All cycles
- 2024: R+58.9 2020: R+57.5 2016: R+53.2 2012: R+40.0 2008: R+37.4
Not yet ingested
- Civics
- —
Market trends
- HPI YoY
- ▲ 14.01%
- Current HPI
- 218.04
- Rent YoY
- —
- Metro
- —
- State GDP YoY
- ▲ 1.55%
- F500 in state
- 6
Industry mix (Fortune 500 HQ in OK)
| Industry | F500 HQs | Revenue |
|---|---|---|
| Energy | 3 | $48B |
|
||
Price history
-29.8% since first listed7 events — show timeline
- 2026-05-02 Price Changed $69,500 MLS Technology, Inc.
- 2026-03-15 Price Changed $77,500 MLS Technology, Inc.
- 2026-02-08 Price Changed $82,500 MLS Technology, Inc.
- 2025-11-20 Price Changed $87,500 MLS Technology, Inc.
- 2025-10-02 Price Changed $91,500 MLS Technology, Inc.
- 2025-08-02 Price Changed $94,000 MLS Technology, Inc.
- 2025-07-03 Listed $99,000 MLS Technology, Inc.
Property tax history
+2.3%/yrLatest (2025): $486 · +0.4% YoY. Source: county tax records.
Cash-flow waterfall
monthlySold comps — $/sqft
last 12 mo · ≤1 miLoading sold comps…