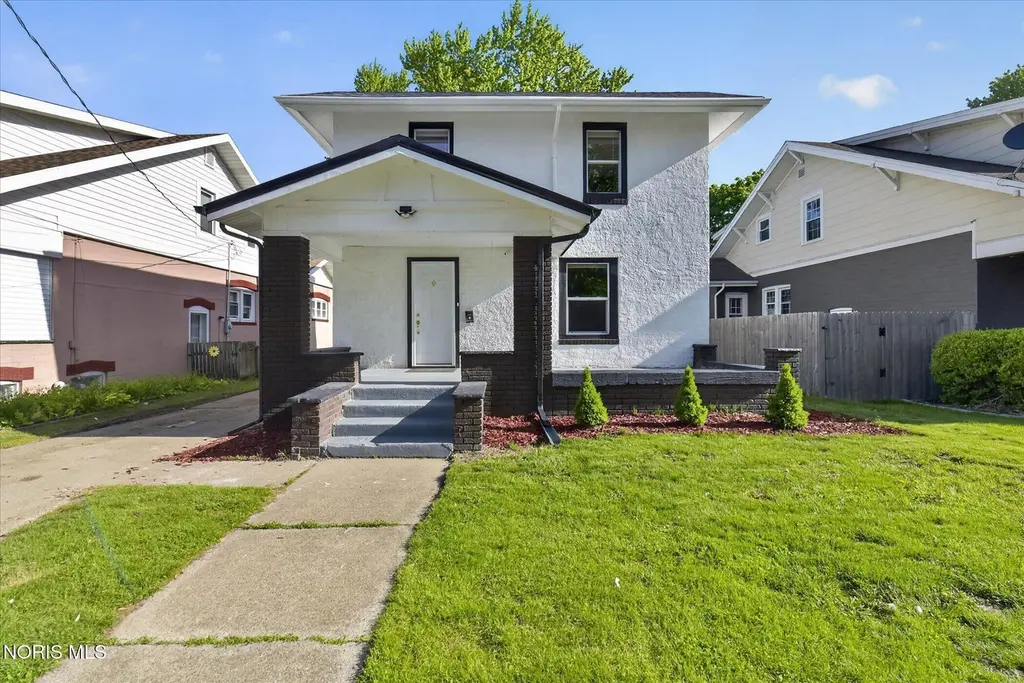
116 Yeager St · Napoleon, OH
Flood risk 1/10 · Minimal
- FEMA flood zone
- X
- Chance of flooding over 30 yrs
- 0.0%
- Est. flood insurance / yr
- $473 – $860
Fire risk 1/10 · Minimal
- Est. fire insurance / yr
- $713 – $1,323
Heat risk 3/10 · Minor
- Hot days now (above 99°F)
- 7 days/yr
- Hot days in 30 yrs
- 17 days/yr
Wind risk 2/10 · Minimal
- Chance of severe wind over 30 yrs
- —
Air-quality risk 2/10 · Minimal
- Unhealthy air days now
- 1 days/yr
- Unhealthy air days in 30 yrs
- 2 days/yr
Risk factors via First Street. Map © Google.
Why this score? — see what drove the C+ grade
The composite is a weighted blend of 9 inputs, each scored 0–100. Each bar is that input's sub-score; the figure is the points it added to the 100-point composite (weight × sub-score).
- Cash flow +23.0/30.0
- ARV discount +15.0/15.0
- DSCR +7.4/10.0
- Schools +5.6/10.0
- 1% rule +5.3/10.0
- Livability +3.5/5.0
- Rent growth +2.5/5.0
- Condition / age +2.5/5.0
- Appreciation +0.0/10.0
$125,000
🖨 Deal sheet 📄 Offer letter ✓ Due diligence
Listing remarks
Stop worrying about what's behind the walls. This 3-bed home is the definition of "sturdy bones" with every major system overhauled. We skipped the fluff and invested where it matters: a brand-new roof, new furnace, and tankless water heater. The guts are rock solid with upgraded 200-amp electrical and all new water lines, plus a new mini-split for modern comfort. Finished with fresh exterior paint, this house is a mechanical powerhouse ready for your cosmetic touch. It's not a palace, but it's built to last and the expensive work is done. Grab a solid deal today!
Key facts
- 4,356 sq ft lot
- 2 parking spots
- Built 1926
Property features AI
Exterior
- Parking: Concrete parking for 2 vehicles
- Utilities: Electricity connected (200+ amp service); Natural gas connected; Public water; Public sewer
- Home design: Single-family residence (house); Two levels / 2 stories; Not attached, no common walls
- Construction: Brick and stucco exterior; Block foundation; Shingle roof; Built in public records
- Exterior features: Front porch; Asphalt city street frontage
Interior
- Kitchen: Electric range connection; Refrigerator
- Bedrooms: Bedroom 2 on upper level (13 x 8); Bedroom 3 on upper level (10 x 12)
- Flooring: Carpet; Vinyl
- Bathrooms: 1 full bathroom
- Heating & cooling: Forced air heating; Mini-split heating and cooling
- Interior features: Cove ceilings; Crown molding; Built-in features; Double-pane windows with screens; Has basement (block foundation)
- Laundry & utility: Main-level laundry; Washer; Dryer; Water heater
Neighborhood map
What this means for you Summary
Snapshot
- This is a 3-bed/1.5-bath single-family listed at $125k.
Deal economics
- At list price, monthly cash flow is $222 ($3k/yr) — positive.
- The deal already cash-flows at list — no discount required.
- Meets the 1% rule at list price ($1k rent vs $125k).
- Recommended offer: $123k (1.5% below list) — sets the bar for market timing.
- Cap rate 8.4% vs local median 3.8% in Napoleon — top-decile yield for the area; either an underpriced asset or a hidden risk that comps aren't pricing in. Stress-test before assuming the spread holds.
Location & tenants
- Location reads 70/100 on livability (#484 in OH) — a middle-class / working-renter tenant base. Strengths: cost of living A+, housing A+; Watch: employment D+, amenities F, commute F.
- Napoleon Area City (town): math 62% / reading 69% proficiency, ranked #208 of 656 in OH (top 32%) — acceptable for families but not a draw, mixed tenant base, ~2y average lease.
- Zoned schools: Napoleon Elementary School (math 75% / reading 74%, grade A, #272 of 1,584 statewide, top 19%, 975 students, 37% FRL); Napoleon Junior/Senior High School (math 49% / reading 64%, grade C, #291 of 781 statewide, top 37%, 787 students, 30% FRL).
- Market conditions: 49 active listings in the ZIP; solid renter incomes; 18 units permitted in Henry County in 2024 (0 in 5+ unit buildings).
Forward outlook
- Local home prices are declining (-3.0%/yr); year-one equity from $864 of loan paydown is wiped out by about $4k of value loss. Plan a longer hold.
- Henry County population projected at -14% by 2050 — secular population decline; favor cash flow + early exit over multi-decade hold.
Negotiation context
- It's been on market 29 days — a 2% lower offer ($123k) is reasonable based on typical stale-listing flexibility.
Risks & watch-outs
- Watch-outs: built in 1926 — expect roof / HVAC / electrical / plumbing capex.
Questions for the listing agent
- Built in 1926 — when were the roof, HVAC, electrical panel, plumbing, and water heater last replaced?
- Is there a deadline driving the sale (1031 exchange, divorce, estate, relocation)? That informs how much negotiation room exists.
- Schools are B-rated — typically a magnet for longer-tenancy family renters. What's the average tenant stay here, and is there a school-zone premium baked into asking?
- What's the average days-on-market for RENTAL listings here right now (not sales)? A rising rental-DOM trend means longer vacancies and softer asking-rent achievability than the comps imply.
- What's the recent tenant-quality profile in this submarket — average credit score on applications, eviction rate, late-payment / NSF rate, and stable-employment percentage? A property-management company in the area should have these aggregated.
- How much new for-sale + rental construction is in the pipeline within 1–3 miles? Heavy new supply typically softens prices + rents 12–24 months out; constrained supply supports both.
Investment metrics
- 1% rule
- 1.03% ✓
- Cap rate
- 8.43%
- Cash-on-cash
- 7.61%
- DSCR
- 1.34
- GRM
- 8.1
CMA / ARV
- ARV (median comp)
- $152,048
- List price
- $125,000
- Delta
- -17.79%
- Verdict
- UNDERPRICED
- Comps
- 20 within 1.0 mi
Show comp detail 12 sales within ~0.75 mi
| Address | Dist | Beds/Ba | Sqft | Sold | Price | $/sf | Match |
|---|---|---|---|---|---|---|---|
| 116 Yeager St | 0.00mi | 3/1.0 | 1,624 (0%) | 0mo | $140,000 | $86 | 98 |
| 1204 Detroit Ave | 0.06mi | 3/1.0 | 1,414 (-13%) | 3mo | $145,000 | $103 | 72 |
| 338 Carey St | 0.30mi | 4/1.0 (+1) | 1,704 (+5%) | 2mo | $136,634 | $80 | 69 |
| 1037 Dodd St | 0.14mi | 3/3.0 | 1,785 (+10%) | 2mo | $203,000 | $114 | 69 |
| 1122 Ohio St | 0.35mi | 3/2.0 | 1,514 (-7%) | 7mo | $180,000 | $119 | 64 |
| 764 Clairmont Ave | 0.47mi | 3/2.0 | 1,500 (-8%) | 2mo | $330,000 | $220 | 62 |
| 1309 Lagrange St | 0.46mi | 3/2.0 | 1,506 (-7%) | 5mo | $215,000 | $143 | 61 |
| 324 Carey St | 0.28mi | 3/2.0 | 1,382 (-15%) | 4mo | $99,900 | $72 | 57 |
| 342 W Clinton St | 0.42mi | 3/2.0 | 1,440 (-11%) | 7mo | $154,000 | $107 | 54 |
| 229 Kolbe St | 0.31mi | 4/2.0 (+1) | 1,849 (+14%) | 3mo | $130,000 | $70 | 53 |
| 1435 Oakdale Dr | 0.60mi | 4/2.0 (+1) | 1,530 (-6%) | 5mo | $240,000 | $157 | 51 |
| 725 Sheffield Ave | 0.68mi | 3/1.0 | 1,472 (-9%) | 7mo | $73,700 | $50 | 44 |
Match score weights: distance 35% · size 25% · config 20% · recency 20%. Top-matched comps best support the ARV.
Projected returns pro-forma
-3.0% appreciation · 3.0% rent growth · sell at horizon
- IRR
- -4.7%
- Equity multiple
- 0.82×
- Total profit
- $-6,132
- Equity at exit
- $18,638
- IRR
- 5.0%
- Equity multiple
- 1.37×
- Total profit
- $12,784
- Equity at exit
- $10,808
Cash invested: $35,000 (down + closing). Projections, not guarantees.
Landlord ↔ Tenant lean methodology
- Overall (STATE)
- 73 Landlord-Friendly
- State Ohio
- 73 Landlord-Friendly · R+6
- County
- — inherits STATE
- City
- — inherits STATE
ZIP-level market 43545
- Home prices YoY
- -19.6%
- Active inventory
- 49
- Price-to-rent
- 8.1×
Monthly cashflow live
- Estimated rent
- $1,289 medium interval (Pro) →
- Mortgage (P&I)
- −$656
- Tax from tax record
- −$88 /mo · $1,061/yr
- Insurance
- −$52
- HOA
- −$0
- Vacancy / Maint / Mgmt
- −$271
- Net cashflow
- $222
Break-even live
UW: 25.0% down · 7.5% · 30yr · 1.5% tax · 5.0% vac · 8.0% maint · 8.0% mgmt
Financing live
Cash to close
- Down payment
- $31,250
- Closing costs
- $3,750
- Reserves months
- —
- Total cash needed
- —
Loan-product check · same deal, 3 products live
Conventional
25% down · 7.5% · 30yr
- Down + closing
- —
- Monthly P&I
- —
- Monthly cashflow
- —
- DSCR
- —
- Eligible?
- —
Personal DTI + credit; lowest rate.
DSCR
20% down · 8.5% · 30yr
- Down + closing
- —
- Monthly P&I
- —
- Monthly cashflow
- —
- DSCR
- —
- Eligible?
- —
No personal income docs; deal must DSCR.
Hard money
10% down · 12.0% · 12mo
- Down + closing
- —
- Monthly P&I
- —
- Monthly cashflow
- —
- DSCR
- —
- Eligible?
- —
Short-term bridge; refi at stabilization.
Listing history 6 events
-
2026-06-02statusdays on market $125,000 Pending 29 DOM
-
2026-06-01days on market $125,000 Contingent 28 DOM
-
2026-05-31days on market $125,000 Contingent 27 DOM
-
2026-05-07historical Contingent 580-char remark
-
2026-05-04$125,000 Active 580-char remark
-
2026-04-29historical $125,000 580-char remark
ⓘ Source: listings_history table (triggers on properties + properties_extension) + one-shot
backfill from property_details.listing_events for pre-trigger history.
Tax reassessment forecast OH · Partial reset (capped growth)
- Current annual tax
- $1,061 · $88/mo
- Projected year-2 tax
- $1,505 · $125/mo
- Expected delta
- +$445/yr (+$37/mo · 41.9%)
ⓘ Screening estimate from a state-policy table — verify with the county assessor before closing.
Climate risk First Street
- Flood 1/10 Low FEMA zone X · 0% chance over 30 yrs
- Wildfire 1/10 Low
- Heat 3/10 Moderate 7 d/yr ≥99°F today · 17 d/yr by 30 yrs out
- Wind 2/10 Low
- Air quality 2/10 Low 1 unhealthy d/yr today · 2 by 30 yrs out
Nearby sold comps map
Loading sold comps map…
Walkable amenities ~0.75 mi
Loading nearby amenities…
Taxation est. · year 1
- Rental income
- $15,464
- − Mortgage interest
- −$7,002
- − Property taxes
- −$1,061
- − Insurance
- −$625
- − Repairs & maintenance
- −$1,237
- − Management
- −$1,237
- − Depreciation
- −$3,636
- Taxable income
- $666
- Est. tax owed @ 24.0%
- −$160
- After-tax cash flow
- $2,505/yr
For passive investors: Depreciation is non-cash, so a rental often shows a tax loss while cash-flowing — sheltering income. Rental losses are passive: they offset passive income freely, and up to $25,000/yr can offset ordinary (W-2) income if you actively participate and your MAGI is under $100k (phasing out to $0 by $150k); unused losses carry forward. On sale, claimed depreciation is recaptured at up to 25%, and gains may owe capital-gains tax (a 1031 exchange can defer both). Figures are a year-1 estimate at your 24.0% rate — not tax advice; consult a CPA.
Schools (NCES district)
- District
- Napoleon Area City
- NCES district ID
- 3904443
- Math proficiency
- 62% ▼ -14.00%
- Reading proficiency
- 69% ▼ -4.00%
- Median HH income
- $49,144
- Composite
- 55.53/100
- National rank
- #1243
- State rank
- #208 of 656 in OH
Livability — Napoleon
- Score
- 70/100
- State rank
- #484
- US rank
- #8082
Category grades
Schools grade is shown separately in the Schools card above.
Census & demographics
- Census place
- Napoleon, OH
- County
- Henry · 27,211 people
- City population
- 14,388
- Population (ZIP)
- 14,388
- Household income
- $78,165
- Rent vs Own
- Severe rent burden
- 4.0
Population outlook (Henry County) Hauer SSP2
- Today (2025)
- 27,204 people
- By 2030
- 26,657 · -2.0%
- By 2040
- 25,149 · -7.6%
- By 2050
- 23,361 · -14.1%
- By 2075
- 20,409 · -25.0%
- By 2100
- 18,199 · -33.1%
Race, ethnicity, and origin ACS 2023
- Neighborhood character
- Predominantly White (88%)
- Race & ethnicity
- White 88% Hispanic / Latino 6% Two or more races 4%
- Hispanic origin (detail)
- Mexican 4%
- Common ancestry
- Lithuanian 3% Slovak 2% Romanian 1%
- Foreign-born
- 2% · Canada
- Languages at home
- 95% English-only · Spanish 3% German/W. Germanic 1% Other Indo-European 1%
Political lean MEDSL · Henry
- 2024 margin
- Solid R (+46.7) · D 26.2% · R 72.9%
- 2008→2024 swing
- -33.8pp toward R · 2008: -12.9pp · 2024: -46.7pp
- All cycles
- 2024: R+46.7 2020: R+43.5 2016: R+39.8 2012: R+18.6 2008: R+12.9
Not yet ingested
- Civics
- —
Market trends
- HPI YoY
- ▼ -51.90%
- Current HPI
- 212.3599
- Rent YoY
- —
- Metro
- —
- State GDP YoY
- ▲ 1.98%
- F500 in state
- 48
Industry mix (Fortune 500 HQ in OH)
| Industry | F500 HQs | Revenue |
|---|---|---|
| Insurance | 3 | $145B |
|
||
| Industrial Machinery | 3 | $49B |
|
||
| Financial Services | 3 | $24B |
|
||
| Consumer Goods | 2 | $93B |
|
||
| Aerospace / Defense | 2 | $47B |
|
||
| Utilities | 2 | $33B |
|
||
Price history
+12.0% since first listed6 events — show timeline
- 2026-06-09 Sold (Public Records) $140,000 Public Records
- 2026-06-04 Sold (MLS) $140,000 NORIS
- 2026-06-02 Pending — NORIS
- 2026-05-07 Contingent — NORIS
- 2026-05-04 Listed $125,000 NORIS
- 2026-04-29 Coming Soon $125,000 NORIS
Property tax history
-3.9%/yrLatest (2025): $1,061 · -0.1% YoY. Source: county tax records.
Cash-flow waterfall
monthlySold comps — $/sqft
last 12 mo · ≤1 miLoading sold comps…