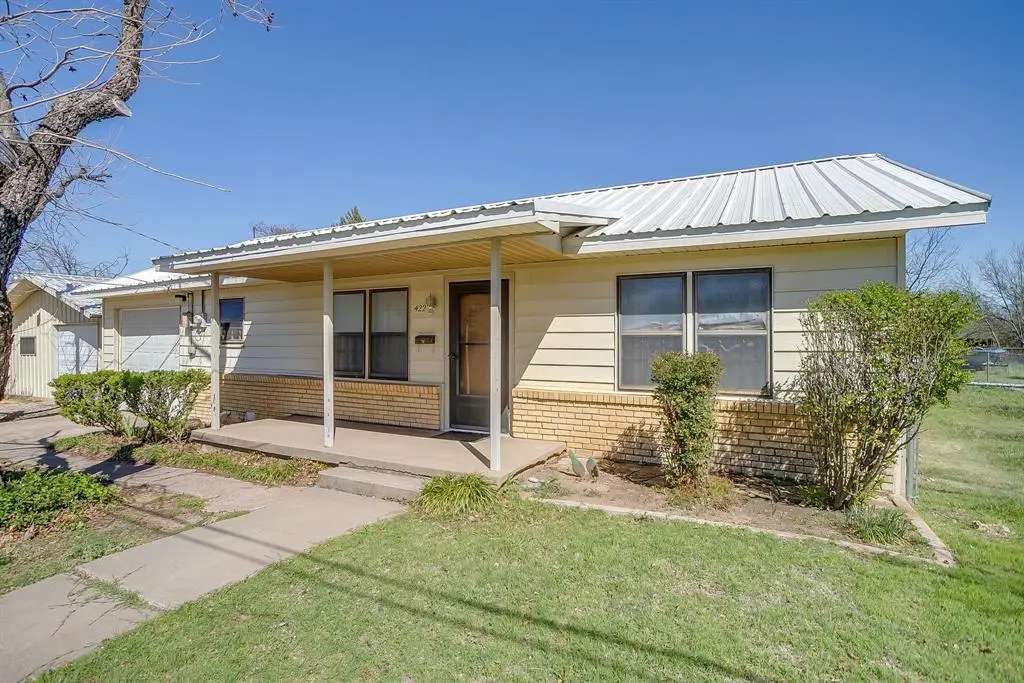
422 N 3rd St · Jacksboro, TX
Flood risk 1/10 · Minimal
- FEMA flood zone
- X (unshaded)
- Chance of flooding over 30 yrs
- 0.0%
- Est. flood insurance / yr
- $507 – $1,088
Fire risk 7/10 · Major
- Est. fire insurance / yr
- $1,222 – $2,270
Heat risk 7/10 · Major
- Hot days now (above 108°F)
- 7 days/yr
- Hot days in 30 yrs
- 21 days/yr
Wind risk 4/10 · Minor
- Chance of severe wind over 30 yrs
- 13.0%
Air-quality risk 2/10 · Minimal
- Unhealthy air days now
- 0 days/yr
- Unhealthy air days in 30 yrs
- 1 days/yr
Risk factors via First Street. Map © Google.
Why this score? — see what drove the D- grade
The composite is a weighted blend of 9 inputs, each scored 0–100. Each bar is that input's sub-score; the figure is the points it added to the 100-point composite (weight × sub-score).
- Cash flow +12.1/30.0
- Appreciation +4.3/10.0
- 1% rule +4.2/10.0
- DSCR +3.6/10.0
- Schools +3.6/10.0
- Livability +3.2/5.0
- Rent growth +2.5/5.0
- Condition / age +2.5/5.0
- ARV discount +0.0/15.0
$187,000
🖨 Deal sheet (PDF) 📄 Offer letter ✓ Due diligence
Listing remarks
Welcome to a truly one-of-a-kind property that perfectly blends comfortable everyday living with unparalleled privacy and preparedness. Situated on a generous corner lot, this fantastic 3-bedroom, 2.5-bathroom home boasts a massive, open-concept living area that serves as the true heart of the home—providing ample room for entertaining family and friends. Step outside into your own private retreat. The perimeter is fully secured by a heavy-duty metal privacy fence, offering low-maintenance durability and total peace of mind. For the hobbyist, mechanic, or anyone needing extra workspace, the large detached garage and workshop is an absolute dream. But what truly sets this property apar
Key facts
- Underground bunker
- Corner lot
- 0.41 acre lot
Tags
Neighborhood map
What this means for you Summary
Snapshot
- This is a 3-bed/2.5-bath single-family listed at $187k.
Deal economics
- At list price, monthly cash flow is $-42 ($-501/yr) — negative.
- To cash-flow at today's rent, offer at most $180k (3.9% below list).
- To meet the 1% rule (rent ≥ 1% of price), the offer needs to be $171k (8.5% below list).
- Recommended offer: $171k (8.5% below list) — sets the bar for 1% rule.
- Cap rate 6.0% vs local median 4.0% in Jacksboro — top-decile yield for the area; either an underpriced asset or a hidden risk that comps aren't pricing in. Stress-test before assuming the spread holds.
Location & tenants
- Location reads 64/100 on livability (#753 in TX) — a middle-class / working-renter tenant base. Strengths: cost of living A+, housing A+, crime A; Watch: health & safety C-, amenities F, commute F.
- Jacksboro ISD (town): math 42% / reading 42% proficiency, ranked #337 of 826 in TX (top 41%) — families likely to look elsewhere, expect single-tenant / working-renter base with shorter leases.
- Zoned schools: Jacksboro El (math 39% / reading 36%, grade F, #1,744 of 4,322 statewide, top 41%, 497 students, 68% FRL) — zoned schools average 68% FRL vs 44% district-wide (23 pts higher); higher-poverty schools than district average — tighter screening recommended.
- Market conditions: 124 active listings in the ZIP; 3 comparable units currently listed for rent nearby; rentals lingering (median 45d on market — plan ~5-8 weeks vacancy on turnover, expect pricing pressure); 67% of comp listings sitting > 30 days — soft ceiling on asking rent; 10 units permitted in Jack County in 2024 (0 in 5+ unit buildings).
Forward outlook
- Local home prices are declining (-1.3%/yr); year-one equity from $1k of loan paydown is wiped out by about $2k of value loss. Plan a longer hold.
Negotiation context
- It's been on market 18 days — a 2% lower offer ($184k) is reasonable based on typical stale-listing flexibility.
Risks & watch-outs
- Watch-outs: built in 1950 — expect roof / HVAC / electrical / plumbing capex.
- Climate carrying-cost: major wildfire risk; extreme-heat days projected 7→21/yr by 2055 (HVAC capex compounding) — expect insurance premiums to compound above CPI over the hold.
Questions for the listing agent
- What do current leases actually rent for vs. the listed asking? Can we see a recent rent roll and the last 12 months of T-12 income?
- Built in 1950 — when were the roof, HVAC, electrical panel, plumbing, and water heater last replaced?
- Is there a deadline driving the sale (1031 exchange, divorce, estate, relocation)? That informs how much negotiation room exists.
- Schools are F-rated, which usually means shorter tenancies and higher turnover. Who's the typical renter profile here, and what's been the actual vacancy rate?
- The area grade is low — what's the realistic commute time and amenity access for the typical tenant pool here? Any planned neighborhood developments (good or bad) we should know about?
- What's the average days-on-market for RENTAL listings here right now (not sales)? A rising rental-DOM trend means longer vacancies and softer asking-rent achievability than the comps imply.
- What's the recent tenant-quality profile in this submarket — average credit score on applications, eviction rate, late-payment / NSF rate, and stable-employment percentage? A property-management company in the area should have these aggregated.
- How much new for-sale + rental construction is in the pipeline within 1–3 miles? Heavy new supply typically softens prices + rents 12–24 months out; constrained supply supports both.
Investment metrics
- 1% rule
- 0.92% ✗
- Cap rate
- 6.02%
- Cash-on-cash
- -0.96%
- DSCR
- 0.96
- GRM
- 9.1
CMA / ARV
- ARV (on-the-fly)
- $160,392
- Comps found
- 11
Show comp detail 11 sales within ~0.75 mi
| Address | Dist | Beds/Ba | Sqft | Sold | Price | $/sf | Match |
|---|---|---|---|---|---|---|---|
| 509 Henderson | 0.43mi | 3/1.5 | 1,244 (-5%) | 2mo | $35,000 | $28 | 66 |
| 304 Moore St | 0.33mi | 2/1.0 (-1) | 1,357 (+4%) | 1mo | $205,000 | $151 | 66 |
| 518 6th Pl | 0.34mi | 2/2.0 (-1) | 1,308 (+0%) | 17mo | $179,900 | $138 | 63 |
| 314 N 3rd St | 0.13mi | 2/1.0 (-1) | 1,224 (-6%) | 18mo | $117,500 | $96 | 58 |
| 1015 W Archer St | 0.50mi | 3/— | 1,400 (+7%) | 9mo | $75,000 | $54 | 57 |
| 410 N Knox St | 0.41mi | 3/2.0 | 1,253 (-4%) | 20mo | $215,000 | $172 | 56 |
| 700 N Knox St | 0.37mi | 4/2.0 (+1) | 1,396 (+7%) | 13mo | $203,000 | $145 | 54 |
| 416 N Knox St | 0.40mi | 3/1.0 | 1,236 (-5%) | 16mo | $140,000 | $113 | 53 |
| 621 W Pine St | 0.46mi | 3/1.0 | 1,218 (-7%) | 20mo | $149,900 | $123 | 45 |
| 314 Oakwood Ave | 0.71mi | 3/2.0 | 1,452 (+11%) | 2mo | $249,000 | $171 | 44 |
| 1107 W Archer St | 0.58mi | 2/1.0 (-1) | 1,200 (-8%) | 9mo | $79,900 | $67 | 41 |
Match score weights: distance 35% · size 25% · config 20% · recency 20%. Top-matched comps best support the ARV.
Projected returns pro-forma
-1.32% appreciation · 3.0% rent growth · sell at horizon
- IRR
- -8.8%
- Equity multiple
- 0.63×
- Total profit
- $-19,378
- Equity at exit
- $42,240
- IRR
- -1.6%
- Equity multiple
- 0.86×
- Total profit
- $-7,478
- Equity at exit
- $41,929
Cash invested: $52,360 (down + closing). Projections, not guarantees.
Landlord ↔ Tenant lean methodology
- Overall (STATE)
- 87 Strongly Landlord-Friendly
- State Texas
- 87 Strongly Landlord-Friendly · R+5
- County
- — inherits STATE
- City
- — inherits STATE
ZIP-level market 76458
- Home prices YoY
- -0.7%
- Active inventory
- 124
- Price-to-rent
- 9.1×
Monthly cashflow live
- Estimated rent
- $1,711 medium interval (Pro) →
- Mortgage (P&I)
- −$981
- Tax from tax record
- −$335 /mo · $4,022/yr
- Insurance
- −$78
- HOA
- −$0
- Vacancy / Maint / Mgmt
- −$359
- Net cashflow
- $-42
Break-even live
Sensitivity live
| Price | -10% $64 | -5% $11 | +0% $-42 | +5% $-95 | +10% $-148 |
|---|---|---|---|---|---|
| Rent | -10% $-177 | -5% $-109 | +0% $-42 | +5% $26 | +10% $93 |
| Rate | -1.0pp $52 | -0.5pp $6 | base $-42 | +0.5pp $-90 | +1.0pp $-140 |
UW: 25.0% down · 7.5% · 30yr · 1.5% tax · 5.0% vac · 8.0% maint · 8.0% mgmt
Financing live
Cash to close
- Down payment
- $46,750
- Closing costs
- $5,610
- Reserves months
- —
- Total cash needed
- —
Loan-product check · same deal, 3 products live
Conventional
25% down · 7.5% · 30yr
- Down + closing
- —
- Monthly P&I
- —
- Monthly cashflow
- —
- DSCR
- —
- Eligible?
- —
Personal DTI + credit; lowest rate.
DSCR
20% down · 8.5% · 30yr
- Down + closing
- —
- Monthly P&I
- —
- Monthly cashflow
- —
- DSCR
- —
- Eligible?
- —
No personal income docs; deal must DSCR.
Hard money
10% down · 12.0% · 12mo
- Down + closing
- —
- Monthly P&I
- —
- Monthly cashflow
- —
- DSCR
- —
- Eligible?
- —
Short-term bridge; refi at stabilization.
Rent comps 3 comps
| Address | Beds | Baths | Sqft | Rent | $/sqft | DOM | Units | Dist |
|---|---|---|---|---|---|---|---|---|
| 320 N 2nd St Jacksboro, TX | 3.0 | 2.0 | 1356 | $1,700 | $1.25 | 44d | 1 | 0.15mi |
| 205 Lacewell St Jacksboro, TX | 3.0 | 2.0 | 1548 | $2,000 | $1.29 | 21d | 1 | 1.20mi |
| 147 Hillcrest St Jacksboro, TX | 3.0 | 2.0 | 1741 | $1,500 | $0.86 | 44d | 1 | 1.22mi |
Listing history 4 events
-
2026-04-10status Pending
-
2026-03-31historical Active Option Contract
-
2026-03-09$187,000 Active
-
1988-10-25soldstatus
ⓘ Source: listings_history table (triggers on properties + properties_extension) + one-shot
backfill from property_details.listing_events for pre-trigger history.
Tax reassessment forecast TX · Resets to sale price
- Current annual tax
- $4,022 · $335/mo
- Projected year-2 tax
- $4,022 · $335/mo
- Expected delta
- $0/yr ($0/mo · 0.0%)
ⓘ Screening estimate from a state-policy table — verify with the county assessor before closing.
Climate risk First Street
- Flood 1/10 Low FEMA zone X (unshaded) · 0% chance over 30 yrs
- Wildfire 7/10 Severe
- Heat 7/10 Severe 7 d/yr ≥108°F today · 21 d/yr by 30 yrs out
- Wind 4/10 Moderate 13% chance of damaging wind over 30 yrs
- Air quality 2/10 Low 0 unhealthy d/yr today · 1 by 30 yrs out
Nearby sold comps map
Loading sold comps map…
Walkable amenities ~0.75 mi
Loading nearby amenities…
Taxation est. · year 1
- Rental income
- $20,536
- − Mortgage interest
- −$10,475
- − Property taxes
- −$4,022
- − Insurance
- −$935
- − Repairs & maintenance
- −$1,643
- − Management
- −$1,643
- − Depreciation
- −$5,440
- Taxable loss
- −$3,621
- Est. tax savings @ 24.0%
- +$869
- After-tax cash flow
- $368/yr
For passive investors: Depreciation is non-cash, so a rental often shows a tax loss while cash-flowing — sheltering income. Rental losses are passive: they offset passive income freely, and up to $25,000/yr can offset ordinary (W-2) income if you actively participate and your MAGI is under $100k (phasing out to $0 by $150k); unused losses carry forward. On sale, claimed depreciation is recaptured at up to 25%, and gains may owe capital-gains tax (a 1031 exchange can defer both). Figures are a year-1 estimate at your 24.0% rate — not tax advice; consult a CPA.
Schools (NCES district)
- District
- Jacksboro ISD
- NCES district ID
- 4824530
- Math proficiency
- 42% ▼ -3.00%
- Reading proficiency
- 42% ▬ 0.00%
- Median HH income
- $47,739
- Composite
- 35.94/100
- National rank
- #4802
- State rank
- #337 of 826 in TX
Livability — Jacksboro
- Score
- 64/100
- State rank
- #753
- US rank
- #13881
Category grades
Schools grade is shown separately in the Schools card above.
Census & demographics
- Census place
- Jacksboro, TX
- Population (ZIP)
- 6,103
Population outlook (Jack County) Hauer SSP2
- Today (2025)
- 8,560 people
- By 2030
- 8,423 · -1.6%
- By 2040
- 8,433 · -1.5%
- By 2050
- 8,605 · +0.5%
- By 2075
- 9,047 · +5.7%
- By 2100
- 8,844 · +3.3%
Race, ethnicity, and origin ACS 2023
- Neighborhood character
- Predominantly White (70%)
- Race & ethnicity
- White 70% Hispanic / Latino 23% Two or more races 7% Black 5%
- Hispanic origin (detail)
- Mexican 20%
- Common ancestry
- Italian 2% Lithuanian 2% Slovak 1%
- Foreign-born
- 6% · Canada
- Languages at home
- 83% English-only · Spanish 16%
Political lean MEDSL · Jack
- 2024 margin
- Solid R (+82.3) · D 8.6% · R 90.9%
- 2008→2024 swing
- -14.2pp toward R · 2008: -68.1pp · 2024: -82.3pp
- All cycles
- 2024: R+82.3 2020: R+81.6 2016: R+79.6 2012: R+78.3 2008: R+68.1
Not yet ingested
- Civics
- —
Market trends
- HPI YoY
- ▼ -1.32%
- Current HPI
- 202.1533
- Rent YoY
- —
- Metro
- —
- State GDP YoY
- ▲ 3.95%
- F500 in state
- 110
Industry mix (Fortune 500 HQ in TX)
| Industry | F500 HQs | Revenue |
|---|---|---|
| Energy | 16 | $1,198B |
|
||
| Technology | 5 | $198B |
|
||
| Engineering / Construction | 4 | $72B |
|
||
| Energy Services | 3 | $60B |
|
||
| Utilities | 3 | $41B |
|
||
| Healthcare | 2 | $330B |
|
||
Price history
4 events — show timeline
- 2026-04-10 Pending — NTREIS
- 2026-03-31 Contingent — NTREIS
- 2026-03-09 Listed $187,000 NTREIS
- 1988-10-25 Sold (Public Records) — Public Records
Property tax history
+12.5%/yrLatest (2025): $4,022 · +159.2% YoY. Source: county tax records.
Cash-flow waterfall
monthlySold comps — $/sqft
last 12 mo · ≤1 miLoading sold comps…