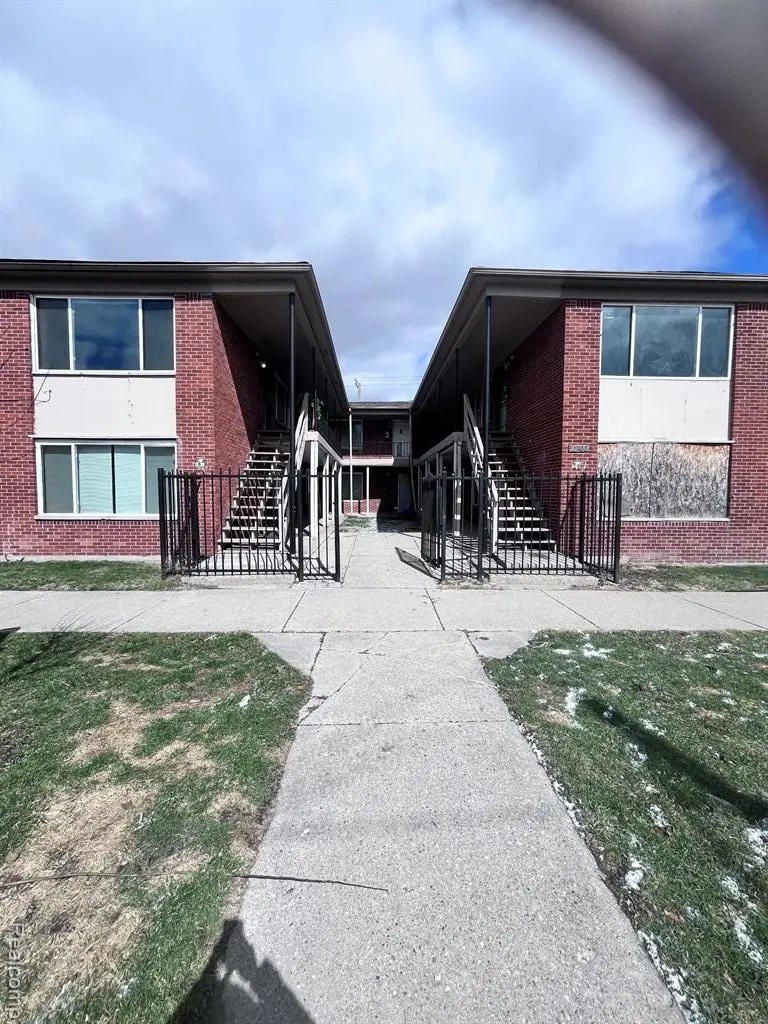
 16-Plex
10400 Whittier St · Detroit, MI
Flood risk 6/10 · Moderate
- FEMA flood zone
- X (unshaded)
- Chance of flooding over 30 yrs
- 0.68%
- Est. flood insurance / yr
- $473 – $860
Fire risk 1/10 · Minimal
- Est. fire insurance / yr
- $784 – $1,456
Heat risk 3/10 · Minor
- Hot days now (above 95°F)
- 7 days/yr
- Hot days in 30 yrs
- 15 days/yr
Wind risk 2/10 · Minimal
- Chance of severe wind over 30 yrs
- —
Air-quality risk 3/10 · Minor
- Unhealthy air days now
- 2 days/yr
- Unhealthy air days in 30 yrs
- 5 days/yr
Risk factors via First Street. Map © Google.
Why this score? — see what drove the B- grade
The composite is a weighted blend of 9 inputs, each scored 0–100. Each bar is that input's sub-score; the figure is the points it added to the 100-point composite (weight × sub-score).
- Cash flow +30.0/30.0
- 1% rule +10.0/10.0
- DSCR +10.0/10.0
- ARV discount +7.5/15.0
- Livability +3.7/5.0
- Rent growth +2.7/5.0
- Condition / age +2.5/5.0
- Schools +1.3/10.0
- Appreciation +0.0/10.0
$500,000
🖨 Deal sheet 📄 Offer letter ✓ Due diligence
Multi-family units
County records classify this as Multi-Family (5+ Unit). Listing-text estimate: 16 units. confirmed
5+ unit building — per-unit beds/baths from public records are typically unavailable; the breakdown below (if shown) is an estimate from the listing text.
Listing remarks MLS
Value-add multifamily investment opportunity located at 10400 Whittier in Detroit. This 16-unit apartment building features a desirable unit mix of 14 one-bedroom units and 2 two-bedroom units. Currently approximately 40% occupied, the property offers significant upside through renovations, lease-up, improved operations, and rent stabilization. Ideal opportunity for an investor looking to add value and increase cash flow in Detroit's multifamily market. Property needs rehab and is being sold as-is. Buyer to verify all information, including unit count, occupancy, rents, expenses, and city requirements.
Key facts
- Property needs rehab
- Significant upside
- Improved operations
Tags
Property features AI
Finance
- Other: Zoned for multi-family
- Financial info: Annual taxes reported
Exterior
- Utilities: Public water; Sewer available
- Home design: Multi-family residential income property; Two stories
- Construction: Brick construction; Slab foundation; Built area approximately 10,222 square feet
- Exterior features: Paved road access; Pets allowed with breed and size restrictions
Interior
- Bathrooms: 16 full bathrooms
- Heating & cooling: Baseboard heating; Electric heating; No central cooling
- Interior features: Baseboard and electric heating
Neighborhood map
What this means for you Summary
Snapshot
- This is a 14×1bd/1ba + 2×2bd/1ba units multifamily listed at $500k.
Deal economics
- At list price, monthly cash flow is $9k ($108k/yr) — positive. Per door: $564/mo.
- The deal already cash-flows at list — no discount required.
- Meets the 1% rule at list price ($16k rent vs $500k).
- Recommended offer: $492k (1.5% below list) — sets the bar for market timing.
- Cap rate 27.9% vs local median 10.2% in Detroit — top-decile yield for the area; either an underpriced asset or a hidden risk that comps aren't pricing in. Stress-test before assuming the spread holds.
Location & tenants
- Location reads 73/100 on livability (#218 in MI) — a middle-class / working-renter tenant base. Strengths: amenities A+, commute A+, cost of living A+; Watch: schools F, crime F, employment F.
- Detroit Public Schools Community District (urban): math 10% / reading 24% proficiency, ranked #499 of 540 in MI (top 92%) — low school quality limits family demand, transient renter base, plan for 1-2y turnover; 90% free/reduced lunch — lower-income household profile, screen leases tightly.
- Market conditions: Rents flat; 484 active listings in the ZIP; lower-income renter base — watch delinquency; 2,639 units permitted in Wayne County in 2024 (1,216 in 5+ unit buildings).
- At $15,795/mo this rent would consume 423% of the median local household income ($45k/yr) (locally 2515% of renters already pay >50% of income on rent) — very limited rent-growth headroom before tenants either downsize or default.
Forward outlook
- Local home prices are declining (-3.0%/yr); year-one equity from $3k of loan paydown is wiped out by about $15k of value loss. Plan a longer hold.
- Wayne County population projected at -17% by 2050 — secular population decline; favor cash flow + early exit over multi-decade hold.
- At projected returns (-3.0% appreciation + 0.7% rent growth), your $140k cash investment doubles in ~2 years — after that, you're playing with house money.
Negotiation context
- It's been on market 28 days — a 2% lower offer ($492k) is reasonable based on typical stale-listing flexibility.
- 6 sale attempts since 9y ago with the ask held roughly flat each time — persistent listings suggest the price (not the market) is what's stuck; bring a comps-based counter.
Risks & watch-outs
- Watch-outs: built in 1958 — expect roof / HVAC / electrical / plumbing capex.
- Climate carrying-cost: major flood risk — expect insurance premiums to compound above CPI over the hold.
Questions for the listing agent
- Can we see the unit-by-unit rent roll, current vacancy, and any below-market leases? What's the average tenancy length?
- What capital expenditures (roof, boiler, parking lot, exteriors) have been made in the last 5 years, and what's planned in the next 2?
- Built in 1958 — when were the roof, HVAC, electrical panel, plumbing, and water heater last replaced?
- Is there a deadline driving the sale (1031 exchange, divorce, estate, relocation)? That informs how much negotiation room exists.
- Schools are F-rated, which usually means shorter tenancies and higher turnover. Who's the typical renter profile here, and what's been the actual vacancy rate?
- Crime grade is F in this area — have there been break-ins, vandalism, or insurance claims at this property in the last 3 years? What carrier currently insures it and at what premium?
- What's the average days-on-market for RENTAL listings here right now (not sales)? A rising rental-DOM trend means longer vacancies and softer asking-rent achievability than the comps imply.
- What's the recent tenant-quality profile in this submarket — average credit score on applications, eviction rate, late-payment / NSF rate, and stable-employment percentage? A property-management company in the area should have these aggregated.
- How much new apartment / multifamily construction is in the pipeline within 1–3 miles? Heavy new supply (>2% of stock underway) typically softens rents 12–24 months out; light construction supports rent growth.
Investment metrics
- 1% rule
- 3.16% ✓
- Cap rate
- 27.95%
- Cash-on-cash
- 77.34%
- DSCR
- 4.44
- GRM
- 2.6
CMA / ARV
No comps found within radius.
Projected returns pro-forma
-3.0% appreciation · 0.73% rent growth · sell at horizon
- IRR
- 74.8%
- Equity multiple
- 4.28×
- Total profit
- $458,597
- Equity at exit
- $74,552
- IRR
- 77.9%
- Equity multiple
- 8.16×
- Total profit
- $1,001,952
- Equity at exit
- $43,231
Cash invested: $140,000 (down + closing). Projections, not guarantees.
Landlord ↔ Tenant lean methodology
- Overall (STATE)
- 62 Landlord-Friendly
- State Michigan
- 62 Landlord-Friendly · EVEN
- County
- — inherits STATE
- City
- — inherits STATE
ZIP-level market 48224
- Rents YoY
- 0.7%
- Active inventory
- 484
- Price-to-rent
- 42.5×
Monthly cashflow live
- Estimated rent
- $15,795 high interval (Pro) →
- Mortgage (P&I)
- −$2,622
- Tax est. 1.5%
- −$625 /mo · $7,500/yr
- Insurance
- −$208
- HOA
- −$0
- Vacancy / Maint / Mgmt
- −$3,317
- Net cashflow
- $9,023
Break-even live
16-unit breakdown (identical units grouped — click to expand)
| Units | Beds | Baths | Est. rent |
|---|---|---|---|
| 14× units | 1 | 1 | $13,720 |
| #1 | 1 | 1 | $980 |
| #2 | 1 | 1 | $980 |
| #3 | 1 | 1 | $980 |
| #4 | 1 | 1 | $980 |
| #5 | 1 | 1 | $980 |
| #6 | 1 | 1 | $980 |
| #7 | 1 | 1 | $980 |
| #8 | 1 | 1 | $980 |
| #9 | 1 | 1 | $980 |
| #10 | 1 | 1 | $980 |
| #11 | 1 | 1 | $980 |
| #12 | 1 | 1 | $980 |
| #13 | 1 | 1 | $980 |
| #14 | 1 | 1 | $980 |
| 2× units | 2 | 1 | $2,078 |
| #15 | 2 | 1 | $1,039 |
| #16 | 2 | 1 | $1,039 |
| Total (16 units) | $15,795 | ||
UW: 25.0% down · 7.5% · 30yr · 1.5% tax · 5.0% vac · 8.0% maint · 8.0% mgmt
Financing live
Cash to close
- Down payment
- $125,000
- Closing costs
- $15,000
- Reserves months
- —
- Total cash needed
- —
Loan-product check · same deal, 3 products live
Conventional
25% down · 7.5% · 30yr
- Down + closing
- —
- Monthly P&I
- —
- Monthly cashflow
- —
- DSCR
- —
- Eligible?
- —
Personal DTI + credit; lowest rate.
DSCR
20% down · 8.5% · 30yr
- Down + closing
- —
- Monthly P&I
- —
- Monthly cashflow
- —
- DSCR
- —
- Eligible?
- —
No personal income docs; deal must DSCR.
Hard money
10% down · 12.0% · 12mo
- Down + closing
- —
- Monthly P&I
- —
- Monthly cashflow
- —
- DSCR
- —
- Eligible?
- —
Short-term bridge; refi at stabilization.
Listing history 24 events
-
2026-06-18days on market $500,000 Active 28 DOM
-
2026-06-17days on market $500,000 Active 27 DOM
-
2026-06-15days on market $500,000 Active 25 DOM
-
2026-06-13days on market $500,000 Active 23 DOM
-
2026-06-13days on market $500,000 Active 22 DOM
-
2026-06-09days on market $500,000 Active 19 DOM
-
2026-06-08days on market $500,000 Active 18 DOM
-
2026-06-07days on market $500,000 Active 17 DOM
-
2026-06-04days on market $500,000 Active 14 DOM
-
2026-06-03days on market $500,000 Active 13 DOM
-
2026-06-02days on market $500,000 Active 12 DOM
-
2026-06-01days on market $500,000 Active 11 DOM
-
2026-05-31days on market $500,000 Active 10 DOM
-
2026-05-21$500,000 Active
Show marketing remark (609 chars)
Value-add multifamily investment opportunity located at 10400 Whittier in Detroit. This 16-unit apartment building features a desirable unit mix of 14 one-bedroom units and 2 two-bedroom units. Currently approximately 40% occupied, the property offers significant upside through renovations, lease-up, improved operations, and rent stabilization. Ideal opportunity for an investor looking to add value and increase cash flow in Detroit's multifamily market. Property needs rehab and is being sold as-is. Buyer to verify all information, including unit count, occupancy, rents, expenses, and city requirements.
-
2026-05-21$500,000 Active 609-char remark
Show marketing remark (609 chars)
Value-add multifamily investment opportunity located at 10400 Whittier in Detroit. This 16-unit apartment building features a desirable unit mix of 14 one-bedroom units and 2 two-bedroom units. Currently approximately 40% occupied, the property offers significant upside through renovations, lease-up, improved operations, and rent stabilization. Ideal opportunity for an investor looking to add value and increase cash flow in Detroit's multifamily market. Property needs rehab and is being sold as-is. Buyer to verify all information, including unit count, occupancy, rents, expenses, and city requirements.
-
2022-09-21soldstatus $660,000 Closed 214-char remark
Show marketing remark (214 chars)
16 unit apartment complex for sale! Vacant. Rent ready. 2 two bed units, 14 one bed units. Private entrances! Large units. Updated. Make your offer today and full units with either cash or sec8 tenants right away.
-
2022-09-21soldstatus $660,000
Show marketing remark (214 chars)
16 unit apartment complex for sale! Vacant. Rent ready. 2 two bed units, 14 one bed units. Private entrances! Large units. Updated. Make your offer today and full units with either cash or sec8 tenants right away.
-
2022-08-26status Pending 214-char remark
Show marketing remark (214 chars)
16 unit apartment complex for sale! Vacant. Rent ready. 2 two bed units, 14 one bed units. Private entrances! Large units. Updated. Make your offer today and full units with either cash or sec8 tenants right away.
-
2022-08-26status Active 214-char remark
Show marketing remark (214 chars)
16 unit apartment complex for sale! Vacant. Rent ready. 2 two bed units, 14 one bed units. Private entrances! Large units. Updated. Make your offer today and full units with either cash or sec8 tenants right away.
-
2022-07-15historical 214-char remark
Show marketing remark (214 chars)
16 unit apartment complex for sale! Vacant. Rent ready. 2 two bed units, 14 one bed units. Private entrances! Large units. Updated. Make your offer today and full units with either cash or sec8 tenants right away.
-
2022-05-14$800,000 Active 214-char remark
Show marketing remark (214 chars)
16 unit apartment complex for sale! Vacant. Rent ready. 2 two bed units, 14 one bed units. Private entrances! Large units. Updated. Make your offer today and full units with either cash or sec8 tenants right away.
-
2022-05-14$800,000
Show marketing remark (214 chars)
16 unit apartment complex for sale! Vacant. Rent ready. 2 two bed units, 14 one bed units. Private entrances! Large units. Updated. Make your offer today and full units with either cash or sec8 tenants right away.
-
2018-01-16soldstatus $300,000
-
2017-09-11$340,000
ⓘ Source: listings_history table (triggers on properties + properties_extension) + one-shot
backfill from property_details.listing_events for pre-trigger history.
Climate risk First Street
- Flood 6/10 Major FEMA zone X (unshaded) · 68% chance over 30 yrs
- Wildfire 1/10 Low
- Heat 3/10 Moderate 7 d/yr ≥95°F today · 15 d/yr by 30 yrs out
- Wind 2/10 Low
- Air quality 3/10 Moderate 2 unhealthy d/yr today · 5 by 30 yrs out
Nearby sold comps map
Loading sold comps map…
Walkable amenities ~0.75 mi
Loading nearby amenities…
Taxation est. · year 1
- Rental income
- $189,540
- − Mortgage interest
- −$28,008
- − Property taxes
- −$7,500
- − Insurance
- −$2,500
- − Repairs & maintenance
- −$15,163
- − Management
- −$15,163
- − Depreciation
- −$14,545
- Taxable income
- $106,660
- Est. tax owed @ 24.0%
- −$25,598
- After-tax cash flow
- $82,673/yr
For passive investors: Depreciation is non-cash, so a rental often shows a tax loss while cash-flowing — sheltering income. Rental losses are passive: they offset passive income freely, and up to $25,000/yr can offset ordinary (W-2) income if you actively participate and your MAGI is under $100k (phasing out to $0 by $150k); unused losses carry forward. On sale, claimed depreciation is recaptured at up to 25%, and gains may owe capital-gains tax (a 1031 exchange can defer both). Figures are a year-1 estimate at your 24.0% rate — not tax advice; consult a CPA.
Schools (NCES district)
- District
- Detroit Public Schools Community District
- NCES district ID
- 2601103
- Math proficiency
- 10% ▼ -2.00%
- Reading proficiency
- 24% ▲ 6.00%
- Median HH income
- $25,815
- Composite
- 13.06/100
- National rank
- #9564
- State rank
- #499 of 540 in MI
Livability — Detroit
- Score
- 73/100
- State rank
- #218
- US rank
- #5427
Category grades
Schools grade is shown separately in the Schools card above.
Census & demographics
- Census place
- Detroit, MI
- County
- Wayne County · 1,562,939 people
- City population
- 572,865
- Metro
- Detroit-Warren-Dearborn, MI
- Population (ZIP)
- 39,668
- Household income
- $44,856
- Rent vs Own
- Severe rent burden
- 2515.0
Population outlook (Wayne County) Hauer SSP2
- Today (2025)
- 1,675,273 people
- By 2030
- 1,620,300 · -3.3%
- By 2040
- 1,502,341 · -10.3%
- By 2050
- 1,384,039 · -17.4%
- By 2075
- 1,124,592 · -32.9%
- By 2100
- 881,193 · -47.4%
Race, ethnicity, and origin ACS 2023
- Neighborhood character
- Predominantly Black (88%)
- Race & ethnicity
- Black 88% White 8% Two or more races 3% Hispanic / Latino 1%
- Common ancestry
- Iranian 1% Romanian 1% Lithuanian 1%
- Foreign-born
- 1%
- Languages at home
- 97% English-only · Spanish 2%
Political lean MEDSL · Wayne
- 2024 margin
- Strong D (+29.0) · D 62.7% · R 33.7% · Other 3.6%
- 2008→2024 swing
- -20.5pp toward R · 2008: 49.5pp · 2024: 29.0pp
- All cycles
- 2024: D+29.0 2020: D+38.1 2016: D+37.3 2012: D+46.9 2008: D+49.5
Not yet ingested
- Civics
- —
Market trends
- HPI YoY
- ▼ -226.38%
- Current HPI
- 161.886
- Rent YoY
- ▲ 0.73%
- Metro
- Detroit-Warren-Dearborn, MI
- State GDP YoY
- ▲ 1.37%
- F500 in state
- 28
Industry mix (Fortune 500 HQ in MI)
| Industry | F500 HQs | Revenue |
|---|---|---|
| Automotive Parts | 3 | $48B |
|
||
| Automotive | 2 | $372B |
|
||
| Chemicals | 1 | $45B |
|
||
| Automotive Retail | 1 | $29B |
|
||
| Healthcare / Medical Devices | 1 | $23B |
|
||
| Automotive Technology | 1 | $20B |
|
||
Price history
+47.1% since first listed11 events — show timeline
- 2026-05-21 Listed $500,000 MiRealSource-MiMLS
- 2026-05-21 Listed $500,000 REALCOMP
- 2022-09-21 Sold (MLS) $660,000 REALCOMP
- 2022-09-21 Sold (MLS) $660,000 MiRealSource-MiMLS
- 2022-08-26 Pending — MiRealSource-MiMLS
- 2022-08-26 Relisted — MiRealSource-MiMLS
- 2022-07-15 Listing Removed — MiRealSource-MiMLS
- 2022-05-14 Listed $800,000 REALCOMP
- 2022-05-14 Listed $800,000 MiRealSource-MiMLS
- 2018-01-16 Sold (MLS) $300,000 MiRealSource-MiMLS
- 2017-09-11 Listed $340,000 MiRealSource-MiMLS
Cash-flow waterfall
monthlySold comps — $/sqft
last 12 mo · ≤1 miLoading sold comps…