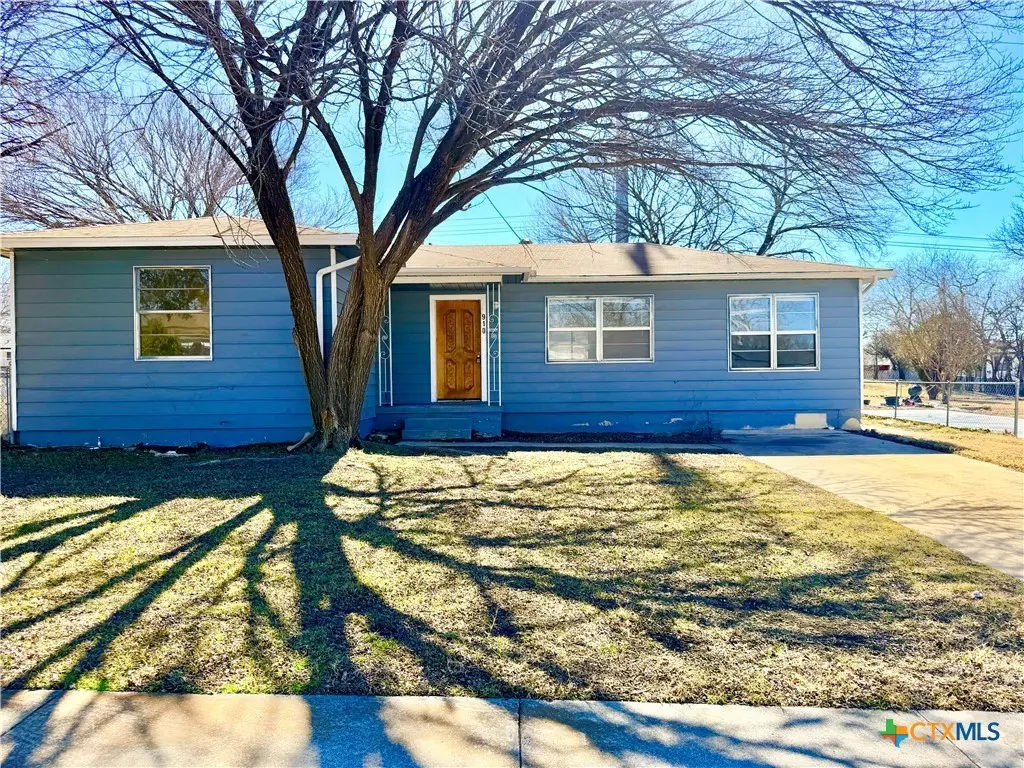
910 Leonhard St · Copperas Cove, TX
Flood risk 1/10 · Minimal
- FEMA flood zone
- X (unshaded)
- Chance of flooding over 30 yrs
- 0.0%
- Est. flood insurance / yr
- $507 – $1,088
Fire risk 5/10 · Moderate
- Est. fire insurance / yr
- $1,222 – $2,270
Heat risk 7/10 · Major
- Hot days now (above 106°F)
- 7 days/yr
- Hot days in 30 yrs
- 23 days/yr
Wind risk 6/10 · Moderate
- Chance of severe wind over 30 yrs
- 55.0%
Air-quality risk 1/10 · Minimal
- Unhealthy air days now
- 0 days/yr
- Unhealthy air days in 30 yrs
- 0 days/yr
Risk factors via First Street. Map © Google.
Why this score? — see what drove the C+ grade
The composite is a weighted blend of 9 inputs, each scored 0–100. Each bar is that input's sub-score; the figure is the points it added to the 100-point composite (weight × sub-score).
- Cash flow +21.9/30.0
- ARV discount +15.0/15.0
- DSCR +7.0/10.0
- 1% rule +6.0/10.0
- Schools +3.6/10.0
- Livability +3.2/5.0
- Condition / age +2.5/5.0
- Rent growth +2.4/5.0
- Appreciation +0.0/10.0
$125,000
🖨 Deal sheet (PDF) 📄 Offer letter ✓ Due diligence
Listing remarks
Refreshed 4 Bed 1 Bath Home For Sale in Copperas Cove, Texas. Will sell for 2.15 Bitcoin! Seller Financing available with just $3,500 down plus ~$2000 closing cost. You could buy this home with your tax return! Monthly payments $1,021.46/mo - tour this beautiful four bedroom one bathroom home today and make it your own! It has all new carpet, a central HVAC, large yard with three bedrooms and one large bonus room, making four rooms and one bathroom. With nice appliances provided in the kitchen, the washer and dryer hook up is available.
Key facts
- 0.26 acre lot
- Built 1975
- Listed 35 days
Property features AI
Exterior
- Parking: Asphalt road access
- Utilities: Public water; Public sewer; Water available
- Home design: Single-story home; Resale property; Pillar/post/pier foundation
- Construction: Composition/shingle roof; Construction details referenced in remarks; Year built per assessor
- Exterior features: Chain link fencing; Exterior details noted in remarks
Interior
- Kitchen: Microwave; Range; Some gas appliances
- Bedrooms: One bedroom on the main level
- Flooring: Carpet; Laminate
- Bathrooms: One full bathroom
- Heating & cooling: Central heating; Central air conditioning
- Interior features: Carpet and laminate flooring; Additional interior features noted in remarks
- Laundry & utility: Washer hookup
Neighborhood map
What this means for you Summary
Snapshot
- This is a 4-bed/1.0-bath single-family listed at $125k.
Deal economics
- At list price, monthly cash flow is $197 ($2k/yr) — positive.
- The deal already cash-flows at list — no discount required.
- Meets the 1% rule at list price ($1k rent vs $125k).
- Recommended offer: $121k (3.0% below list) — sets the bar for market timing.
- Cap rate 8.2% vs local median 3.4% in Copperas Cove — top-decile yield for the area; either an underpriced asset or a hidden risk that comps aren't pricing in. Stress-test before assuming the spread holds.
Location & tenants
- Location reads 65/100 on livability (#706 in TX) — a middle-class / working-renter tenant base. Strengths: cost of living A+, housing A+; Watch: schools C-, employment D+, amenities F.
- Copperas Cove ISD (suburban): math 41% / reading 42% proficiency, ranked #340 of 826 in TX (top 41%) — families likely to look elsewhere, expect single-tenant / working-renter base with shorter leases.
- Market conditions: Rents soft (-0.2%/yr); 608 active listings in the ZIP; 40 comparable units currently listed for rent nearby; rentals lingering (median 45d on market — plan ~5-8 weeks vacancy on turnover, expect pricing pressure); 52% of comp listings sitting > 30 days — soft ceiling on asking rent; 386 units permitted in Coryell County in 2024 (0 in 5+ unit buildings).
Forward outlook
- Local home prices are declining (-3.0%/yr); year-one equity from $864 of loan paydown is wiped out by about $4k of value loss. Plan a longer hold.
Negotiation context
- It's been on market 35 days — a 3% lower offer ($121k) is reasonable based on typical stale-listing flexibility.
- 3 sale attempts since 22y ago with the ask held roughly flat each time — persistent listings suggest the price (not the market) is what's stuck; bring a comps-based counter.
Risks & watch-outs
- Climate carrying-cost: major wind risk, 55% chance of damaging wind over 30y; moderate wildfire risk; extreme-heat days projected 7→23/yr by 2055 (HVAC capex compounding) — expect insurance premiums to compound above CPI over the hold.
Questions for the listing agent
- It's been on market 35 days. Have you received any prior offers? Is the seller open to a 3% concession, seller financing, or rate buy-down credit?
- Built in 1975 — when were the roof, HVAC, electrical panel, plumbing, and water heater last replaced?
- Is there a deadline driving the sale (1031 exchange, divorce, estate, relocation)? That informs how much negotiation room exists.
- What's the average days-on-market for RENTAL listings here right now (not sales)? A rising rental-DOM trend means longer vacancies and softer asking-rent achievability than the comps imply.
- What's the recent tenant-quality profile in this submarket — average credit score on applications, eviction rate, late-payment / NSF rate, and stable-employment percentage? A property-management company in the area should have these aggregated.
- How much new for-sale + rental construction is in the pipeline within 1–3 miles? Heavy new supply typically softens prices + rents 12–24 months out; constrained supply supports both.
Investment metrics
- 1% rule
- 1.10% ✓
- Cap rate
- 8.19%
- Cash-on-cash
- 6.76%
- DSCR
- 1.30
- GRM
- 7.6
CMA / ARV
- ARV (median comp)
- $162,250
- List price
- $125,000
- Delta
- -22.96%
- Verdict
- UNDERPRICED
- Comps
- 20 within 1.0 mi
Show comp detail 12 sales within ~0.75 mi
| Address | Dist | Beds/Ba | Sqft | Sold | Price | $/sf | Match |
|---|---|---|---|---|---|---|---|
| 910 Leonhard St | 0.00mi | 4/1.0 | 1,287 (0%) | 1mo | $125,000 | $97 | 100 |
| 1303 Little St | 0.21mi | 3/2.0 (-1) | 1,258 (-2%) | 1mo | $175,000 | $139 | 77 |
| 815 Shady Ln | 0.12mi | 3/1.5 (-1) | 1,404 (+9%) | 6mo | $92,500 | $66 | 67 |
| 914 Edwards St | 0.19mi | 3/2.0 (-1) | 1,149 (-11%) | 3mo | $179,800 | $156 | 61 |
| 2206 Phyllis Dr | 0.71mi | 3/2.0 (-1) | 1,300 (+1%) | 1mo | $191,000 | $147 | 55 |
| 505 Curry Ave | 0.54mi | 3/1.5 (-1) | 1,338 (+4%) | 8mo | $77,000 | $58 | 54 |
| 708 Shady Ln | 0.20mi | 3/1.5 (-1) | 1,104 (-14%) | 8mo | $107,500 | $97 | 53 |
| 315 Ash St | 0.59mi | 3/1.5 (-1) | 1,353 (+5%) | 7mo | $92,500 | $68 | 51 |
| 1709 Pleasant Ln | 0.56mi | 3/2.0 (-1) | 1,429 (+11%) | 0mo | $187,500 | $131 | 46 |
| 707 S 5th St | 0.57mi | 3/1.0 (-1) | 1,112 (-14%) | 1mo | $116,000 | $104 | 45 |
| 1002 S 7th St | 0.57mi | 3/2.0 (-1) | 1,122 (-13%) | 4mo | $62,000 | $55 | 39 |
| 1211 S 13th St | 0.70mi | 3/2.0 (-1) | 1,118 (-13%) | 4mo | $117,000 | $105 | 34 |
Match score weights: distance 35% · size 25% · config 20% · recency 20%. Top-matched comps best support the ARV.
Projected returns pro-forma
-3.0% appreciation · 0.0% rent growth · sell at horizon
- IRR
- -9.4%
- Equity multiple
- 0.67×
- Total profit
- $-11,683
- Equity at exit
- $18,638
- IRR
- -4.7%
- Equity multiple
- 0.73×
- Total profit
- $-9,386
- Equity at exit
- $10,808
Cash invested: $35,000 (down + closing). Projections, not guarantees.
Landlord ↔ Tenant lean methodology
- Overall (STATE)
- 87 Strongly Landlord-Friendly
- State Texas
- 87 Strongly Landlord-Friendly · R+5
- County
- — inherits STATE
- City
- — inherits STATE
ZIP-level market 76522
- Home prices YoY
- -22.4%
- Rents YoY
- -0.2%
- Active inventory
- 608
- Price-to-rent
- 7.6×
Monthly cashflow live
- Estimated rent
- $1,370 high interval (Pro) →
- Mortgage (P&I)
- −$656
- Tax from tax record
- −$177 /mo · $2,129/yr
- Insurance
- −$52
- HOA
- −$0
- Vacancy / Maint / Mgmt
- −$288
- Net cashflow
- $197
Break-even live
Sensitivity live
| Price | -10% $268 | -5% $232 | +0% $197 | +5% $162 | +10% $126 |
|---|---|---|---|---|---|
| Rent | -10% $89 | -5% $143 | +0% $197 | +5% $251 | +10% $305 |
| Rate | -1.0pp $260 | -0.5pp $229 | base $197 | +0.5pp $165 | +1.0pp $132 |
UW: 25.0% down · 7.5% · 30yr · 1.5% tax · 5.0% vac · 8.0% maint · 8.0% mgmt
Financing live
Cash to close
- Down payment
- $31,250
- Closing costs
- $3,750
- Reserves months
- —
- Total cash needed
- —
Loan-product check · same deal, 3 products live
Conventional
25% down · 7.5% · 30yr
- Down + closing
- —
- Monthly P&I
- —
- Monthly cashflow
- —
- DSCR
- —
- Eligible?
- —
Personal DTI + credit; lowest rate.
DSCR
20% down · 8.5% · 30yr
- Down + closing
- —
- Monthly P&I
- —
- Monthly cashflow
- —
- DSCR
- —
- Eligible?
- —
No personal income docs; deal must DSCR.
Hard money
10% down · 12.0% · 12mo
- Down + closing
- —
- Monthly P&I
- —
- Monthly cashflow
- —
- DSCR
- —
- Eligible?
- —
Short-term bridge; refi at stabilization.
Rent comps 40 comps
| Address | Beds | Baths | Sqft | Rent | $/sqft | DOM | Units | Dist |
|---|---|---|---|---|---|---|---|---|
| 914 Chalk St Copperas Cove, TX | 3.0 | 2.0 | 1107 | $1,200 | $1.08 | 24d | 1 | 0.05mi |
| 1202 S FM 116 Copperas Cove, TX | 1.0–3.0 | 1.0–2.0 | 922 | $1,560 | $1.69 | 15d | 12 | 0.36mi |
| 1010 Georgetown Rd Copperas Cove, TX | 3.0 | 1.0 | 1018 | $995 | $0.98 | 45d | 1 | 0.42mi |
| 1202 S 3rd St Copperas Cove, TX | 3.0 | 2.0 | 1056 | $1,175 | $1.11 | 45d | 1 | 0.44mi |
| 902 Lynn Ln Copperas Cove, TX | 3.0 | 2.0 | 1661 | $1,600 | $0.96 | 15d | 1 | 0.45mi |
| 1004 S 3rd St Copperas Cove, TX | 3.0 | 1.0 | 940 | $950 | $1.01 | 24d | 1 | 0.47mi |
| 904 Mary St Copperas Cove, TX | 3.0 | 2.0 | 1041 | $1,052 | $1.01 | 45d | 1 | 0.50mi |
| 808 Mary St Copperas Cove, TX | 3.0 | 1.0 | 1028 | $1,300 | $1.26 | 45d | 1 | 0.52mi |
| 1204 S 7th St Copperas Cove, TX | 3.0 | 2.0 | 1202 | $1,295 | $1.08 | 45d | 1 | 0.55mi |
| 1201 S 9th St Copperas Cove, TX | 3.0 | 2.0 | 1172 | $1,100 | $0.94 | 24d | 1 | 0.58mi |
| 607 Curry Ave Copperas Cove, TX | 3.0 | 1.5 | 1192 | $935 | $0.78 | 24d | 1 | 0.59mi |
| 1005 S 11th St Copperas Cove, TX | 4.0 | 2.0 | 1236 | $1,090 | $0.88 | 45d | 1 | 0.64mi |
| 1816 S FM 116 Unit A Copperas Cove, TX | 3.0 | 2.0 | 1058 | $1,150 | $1.09 | 15d | 1 | 0.68mi |
| 1904 Pleasant Ln Copperas Cove, TX | 3.0 | 2.0 | 1352 | $1,400 | $1.04 | 45d | 1 | 0.68mi |
| 1902 Patricia St Copperas Cove, TX | 5.0 | 2.0 | 1520 | $1,545 | $1.02 | 15d | 1 | 0.68mi |
| 903 Curry Ave Copperas Cove, TX | 3.0 | 2.5 | 1285 | $1,200 | $0.93 | 24d | 1 | 0.72mi |
| 303 Margaret Lee St Copperas Cove, TX | 3.0 | 1.0 | 1124 | $915 | $0.81 | 15d | 1 | 0.73mi |
| 1005 Phil Ave Copperas Cove, TX | 3.0 | 1.0 | 1026 | $1,025 | $1.00 | 45d | 1 | 0.74mi |
| 915 S 15th St Copperas Cove, TX | 3.0 | 2.0 | 1008 | $850 | $0.84 | 15d | 1 | 0.76mi |
| 1102 Creek St Copperas Cove, TX | 4.0 | 2.5 | 1834 | $1,675 | $0.91 | 45d | 1 | 0.76mi |
| 202 Margaret Lee St Copperas Cove, TX | 5.0 | 2.0 | 1558 | $1,525 | $0.98 | 15d | 1 | 0.77mi |
| 604 S 11th St Copperas Cove, TX | 3.0 | 2.0 | 1119 | $1,300 | $1.16 | 45d | 1 | 0.78mi |
| 403 S 7th St Copperas Cove, TX | 3.0 | 1.0 | 910 | $1,100 | $1.21 | 45d | 1 | 0.79mi |
| 408 Allen St Copperas Cove, TX | 3.0 | 1.0 | 1300 | $1,095 | $0.84 | 24d | 1 | 0.82mi |
| 1005 S 19th St Copperas Cove, TX | 3.0 | 1.5 | 1356 | $1,100 | $0.81 | 45d | 1 | 0.86mi |
| 502 S 9th St Copperas Cove, TX | 3.0 | 1.5 | 1479 | $1,150 | $0.78 | 45d | 1 | 0.86mi |
| 1208 S 19th St Copperas Cove, TX | 3.0 | 1.5 | 1010 | $1,525 | $1.51 | 24d | 1 | 0.87mi |
| 917 Whirlaway Dr Copperas Cove, TX | 3.0 | 2.0 | 1300 | $1,500 | $1.15 | 45d | 1 | 0.88mi |
| 1613 Miranda Ave Copperas Cove, TX | 3.0 | 2.0 | 1630 | $1,395 | $0.86 | 24d | 1 | 0.93mi |
| 1006 S 21st St Copperas Cove, TX | 4.0 | 2.0 | 1445 | $1,100 | $0.76 | 45d | 1 | 0.94mi |
| 518 Kate St Copperas Cove, TX | 4.0 | 1.5 | 1302 | $1,595 | $1.23 | 45d | 1 | 0.94mi |
| 412 West Avenue C Unit C Copperas Cove, TX | 3.0 | 2.0 | 1343 | $1,600 | $1.19 | 22d | 1 | 0.94mi |
| 414 West Avenue C Unit C Copperas Cove, TX | 3.0 | 2.0 | 1343 | $1,600 | $1.19 | 45d | 1 | 0.95mi |
| 1107 Tyler Dr Copperas Cove, TX | 3.0 | 2.0 | 1409 | $1,500 | $1.06 | 45d | 1 | 0.95mi |
| 924 Northern Dancer Dr Copperas Cove, TX | 4.0 | 2.0 | 1610 | $1,650 | $1.02 | 45d | 1 | 0.95mi |
| 1002 Northern Dancer Dr Copperas Cove, TX | 4.0 | 2.0 | 1605 | $1,750 | $1.09 | 45d | 1 | 0.96mi |
| 1003 E Robertson Ave Copperas Cove, TX | 3.0 | 2.0 | 1042 | $1,150 | $1.10 | 24d | 1 | 0.98mi |
| 507 Kate St Copperas Cove, TX | 3.0 | 2.0 | 1280 | $1,295 | $1.01 | 24d | 1 | 0.99mi |
| 1302 S 23rd St Copperas Cove, TX | 4.0 | 1.5 | 1453 | $1,320 | $0.91 | 45d | 1 | 1.00mi |
| 509 West Avenue B Copperas Cove, TX | 3.0 | 2.0 | 1339 | $1,175 | $0.88 | 24d | 1 | 1.01mi |
Listing history 12 events
-
2026-06-03days on market $125,000 Active 35 DOM
-
2026-06-02days on market $125,000 Active 34 DOM
-
2026-06-01days on market $125,000 Active 33 DOM
-
2026-05-31days on market $125,000 Active 32 DOM
-
2026-05-30days on market $125,000 Active 31 DOM
-
2026-04-29$125,000 Active 542-char remark
-
2026-03-02historical
-
2026-02-06$125,000 Active
-
2023-09-22soldstatus
-
2021-07-23soldstatus
-
2004-12-26historical
-
2004-06-26$43,000
ⓘ Source: listings_history table (triggers on properties + properties_extension) + one-shot
backfill from property_details.listing_events for pre-trigger history.
Tax reassessment forecast TX · Resets to sale price
- Current annual tax
- $2,129 · $177/mo
- Projected year-2 tax
- $2,288 · $191/mo
- Expected delta
- +$159/yr (+$13/mo · 7.4%)
ⓘ Screening estimate from a state-policy table — verify with the county assessor before closing.
Climate risk First Street
- Flood 1/10 Low FEMA zone X (unshaded) · 0% chance over 30 yrs
- Wildfire 5/10 Major
- Heat 7/10 Severe 7 d/yr ≥106°F today · 23 d/yr by 30 yrs out
- Wind 6/10 Major 55% chance of damaging wind over 30 yrs
- Air quality 1/10 Low 0 unhealthy d/yr today · 0 by 30 yrs out
Nearby sold comps map
Loading sold comps map…
Walkable amenities ~0.75 mi
Loading nearby amenities…
Taxation est. · year 1
- Rental income
- $16,437
- − Mortgage interest
- −$7,002
- − Property taxes
- −$2,129
- − Insurance
- −$625
- − Repairs & maintenance
- −$1,315
- − Management
- −$1,315
- − Depreciation
- −$3,636
- Taxable income
- $415
- Est. tax owed @ 24.0%
- −$100
- After-tax cash flow
- $2,266/yr
For passive investors: Depreciation is non-cash, so a rental often shows a tax loss while cash-flowing — sheltering income. Rental losses are passive: they offset passive income freely, and up to $25,000/yr can offset ordinary (W-2) income if you actively participate and your MAGI is under $100k (phasing out to $0 by $150k); unused losses carry forward. On sale, claimed depreciation is recaptured at up to 25%, and gains may owe capital-gains tax (a 1031 exchange can defer both). Figures are a year-1 estimate at your 24.0% rate — not tax advice; consult a CPA.
Schools (NCES district)
- District
- Copperas Cove ISD
- NCES district ID
- 4815240
- Math proficiency
- 41% ▼ -6.00%
- Reading proficiency
- 42% ▼ -2.00%
- Median HH income
- $51,072
- Composite
- 35.85/100
- National rank
- #4822
- State rank
- #340 of 826 in TX
Livability — Copperas Cove
- Score
- 65/100
- State rank
- #706
- US rank
- #13158
Category grades
Schools grade is shown separately in the Schools card above.
Census & demographics
- Census place
- Copperas Cove, TX
- County
- Coryell County · 61,053 people
- City population
- 42,118
- Metro
- Killeen-Temple, TX
- Population (ZIP)
- 42,118
- Household income
- $72,206
- Rent vs Own
- Severe rent burden
- 1019.0
Population outlook (Coryell County) Hauer SSP2
- Today (2025)
- 75,485 people
- By 2030
- 75,627 · +0.2%
- By 2040
- 74,898 · -0.8%
- By 2050
- 74,221 · -1.7%
- By 2075
- 72,688 · -3.7%
- By 2100
- 66,862 · -11.4%
Race, ethnicity, and origin ACS 2023
- Neighborhood character
- Diverse neighborhood (Simpson 0.66)
- Race & ethnicity
- White 53% Hispanic / Latino 21% Two or more races 20% Black 14% Asian 2%
- Hispanic origin (detail)
- Mexican 11% Puerto Rican 6%
- Common ancestry
- Romanian 2% Italian 2% Lithuanian 2%
- Foreign-born
- 7% · Canada, South Korea
- Languages at home
- 85% English-only · Spanish 10% German/W. Germanic 2% Other Asian/Pacific 1%
Political lean MEDSL · Coryell
- 2024 margin
- Solid R (+40.7) · D 29.1% · R 69.8% · Other 1.1%
- 2008→2024 swing
- -13.8pp toward R · 2008: -26.9pp · 2024: -40.7pp
- All cycles
- 2024: R+40.7 2020: R+33.5 2016: R+39.5 2012: R+36.6 2008: R+26.9
Not yet ingested
- Civics
- —
Market trends
- HPI YoY
- ▼ -53.11%
- Current HPI
- 183.9452
- Rent YoY
- ▼ -0.25%
- Metro
- Killeen-Temple, TX
- State GDP YoY
- ▲ 3.95%
- F500 in state
- 110
Industry mix (Fortune 500 HQ in TX)
| Industry | F500 HQs | Revenue |
|---|---|---|
| Energy | 16 | $1,198B |
|
||
| Technology | 5 | $198B |
|
||
| Engineering / Construction | 4 | $72B |
|
||
| Energy Services | 3 | $60B |
|
||
| Utilities | 3 | $41B |
|
||
| Healthcare | 2 | $330B |
|
||
Price history
+190.7% since first listed9 events — show timeline
- 2026-06-03 Pending — CTXMLS
- 2026-06-03 Sold (MLS) $125,000 CTXMLS
- 2026-04-29 Listed $125,000 CTXMLS
- 2026-03-02 Listing Removed — CTXMLS
- 2026-02-06 Listed $125,000 CTXMLS
- 2023-09-22 Sold (Public Records) — Public Records
- 2021-07-23 Sold (Public Records) — Public Records
- 2004-12-26 Listing Removed — CTXMLS
- 2004-06-26 Listed $43,000 CTXMLS
Property tax history
+4.2%/yrLatest (2025): $2,129 · +2.7% YoY. Source: county tax records.
Cash-flow waterfall
monthlySold comps — $/sqft
last 12 mo · ≤1 miLoading sold comps…