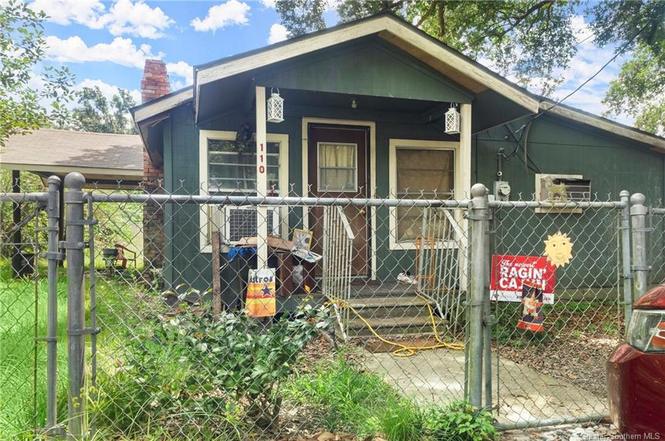
110 N 12th St N · Oberlin, LA
Flood risk 4/10 · Minor
- FEMA flood zone
- X (unshaded)
- Chance of flooding over 30 yrs
- 0.22%
- Est. flood insurance / yr
- $507 – $1,088
Fire risk 4/10 · Minor
- Est. fire insurance / yr
- $1,269 – $2,357
Heat risk 8/10 · Major
- Hot days now (above 111°F)
- 7 days/yr
- Hot days in 30 yrs
- 20 days/yr
Wind risk 9/10 · Severe
- Chance of severe wind over 30 yrs
- 99.0%
Air-quality risk 1/10 · Minimal
- Unhealthy air days now
- 0 days/yr
- Unhealthy air days in 30 yrs
- 0 days/yr
Risk factors via First Street. Map © Google.
Why this score? — see what drove the B grade
The composite is a weighted blend of 9 inputs, each scored 0–100. Each bar is that input's sub-score; the figure is the points it added to the 100-point composite (weight × sub-score).
- Cash flow +30.0/30.0
- 1% rule +10.0/10.0
- DSCR +10.0/10.0
- ARV discount +7.5/15.0
- Livability +3.0/5.0
- Schools +2.8/10.0
- Rent growth +2.5/5.0
- Condition / age +2.5/5.0
- Appreciation +2.0/10.0
$50,000
🖨 Deal sheet 📄 Offer letter ✓ Due diligence
Listing remarks
* * Investment Opportunity: Well-Maintained with Rental Income and Expansion Potential * * Discover a fantastic investment opportunity with this charming home, offering both immediate rental income and additional income potential. This property features 3-bedrooms, 2-bathroom, and provides comfortable living space to those currently occupying it. * * Current Income: * * $650 per month in rental income Home is well-maintained including a cozy living area, functional kitchen, and comfortable bedrooms. The property is situated in a desirable location with easy access to local amenities, and key business areas. This presents a unique chance to secure a property with reliable income while
Key facts
- Built 1972
- Listed 305 days
Property features AI
Finance
- Other: Directions: North on Hwy 165, right on 6th Avenue, left on 12th — property on the right
- Financial info: Each unit currently shows $650 rent
Exterior
- Utilities: Public water; Public sewer
- Home design: Residential income property configured as apartments; Single-story building
- Exterior features: City lot; Irregular lot shape; 0.22-acre lot
Interior
- Bedrooms: Each unit has 3 bedrooms
- Bathrooms: Each unit has 2 bathrooms
- Interior features: Two 3-bedroom, 2-bath apartment units (each unfurnished)
Neighborhood map
What this means for you Summary
Snapshot
- This is a 6-bed/4.0-bath townhouse listed at $50k.
Deal economics
- At list price, monthly cash flow is $579 ($7k/yr) — positive.
- The deal already cash-flows at list — no discount required.
- Meets the 1% rule at list price ($1k rent vs $50k).
- Recommended offer: $44k (12.0% below list) — sets the bar for market timing.
Location & tenants
- Location reads 60/100 on livability (#250 in LA) — a middle-class / working-renter tenant base. Strengths: cost of living A+, crime B; Watch: amenities F, commute F, employment F.
- Allen Parish (rural): math 26% / reading 42% proficiency, ranked #36 of 98 in LA (top 37%) — families likely to look elsewhere, expect single-tenant / working-renter base with shorter leases.
- Market conditions: 22 active listings in the ZIP; 46 units permitted in Allen Parish in 2024 (0 in 5+ unit buildings).
Forward outlook
- Local home prices are declining (-3.0%/yr); year-one equity from $346 of loan paydown is wiped out by about $2k of value loss. Plan a longer hold.
- Allen County population projected to shrink 8% by 2050 — rents likely to lag national; underwrite the cash flow, not the appreciation.
- At projected returns (-3.0% appreciation + 3.0% rent growth), your $14k cash investment doubles in ~3 years — after that, you're playing with house money.
Negotiation context
- It's been on market 305 days — a 12% lower offer ($44k) is reasonable based on typical stale-listing flexibility.
- 2 sale attempts since 2y ago with the ask held roughly flat each time — persistent listings suggest the price (not the market) is what's stuck; bring a comps-based counter.
Risks & watch-outs
- Climate carrying-cost: severe wind risk, 99% chance of damaging wind over 30y; extreme-heat days projected 7→20/yr by 2055 (HVAC capex compounding) — expect insurance premiums to compound above CPI over the hold.
Questions for the listing agent
- It's been on market 305 days. Have you received any prior offers? Is the seller open to a 12% concession, seller financing, or rate buy-down credit?
- Built in 1972 — when were the roof, HVAC, electrical panel, plumbing, and water heater last replaced?
- Why hasn't it sold? Are there any deal-killer items the seller is aware of (foundation, flood, title, zoning, code violations)?
- Is there a deadline driving the sale (1031 exchange, divorce, estate, relocation)? That informs how much negotiation room exists.
- Schools are B-rated — typically a magnet for longer-tenancy family renters. What's the average tenant stay here, and is there a school-zone premium baked into asking?
- What's the average days-on-market for RENTAL listings here right now (not sales)? A rising rental-DOM trend means longer vacancies and softer asking-rent achievability than the comps imply.
- What's the recent tenant-quality profile in this submarket — average credit score on applications, eviction rate, late-payment / NSF rate, and stable-employment percentage? A property-management company in the area should have these aggregated.
- How much new for-sale + rental construction is in the pipeline within 1–3 miles? Heavy new supply typically softens prices + rents 12–24 months out; constrained supply supports both.
Investment metrics
- 1% rule
- 2.34% ✓
- Cap rate
- 20.20%
- Cash-on-cash
- 49.67%
- DSCR
- 3.21
- GRM
- 3.6
CMA / ARV
No comps found within radius.
Projected returns pro-forma
-3.0% appreciation · 3.0% rent growth · sell at horizon
- IRR
- 47.3%
- Equity multiple
- 3.06×
- Total profit
- $28,823
- Equity at exit
- $7,455
- IRR
- 53.0%
- Equity multiple
- 6.19×
- Total profit
- $72,694
- Equity at exit
- $4,323
Cash invested: $14,000 (down + closing). Projections, not guarantees.
Landlord ↔ Tenant lean methodology
- Overall (STATE)
- 90 Strongly Landlord-Friendly
- State Louisiana
- 90 Strongly Landlord-Friendly · R+12
- County
- — inherits STATE
- City
- — inherits STATE
ZIP-level market 70655
- Home prices YoY
- -6.2%
- Active inventory
- 22
- Price-to-rent
- 3.6×
Monthly cashflow live
- Estimated rent
- $1,171 medium interval (Pro) →
- Mortgage (P&I)
- −$262
- Tax est. 1.5%
- −$62 /mo · $750/yr
- Insurance
- −$21
- HOA
- −$0
- Vacancy / Maint / Mgmt
- −$246
- Net cashflow
- $579
Break-even live
UW: 25.0% down · 7.5% · 30yr · 1.5% tax · 5.0% vac · 8.0% maint · 8.0% mgmt
Financing live
Cash to close
- Down payment
- $12,500
- Closing costs
- $1,500
- Reserves months
- —
- Total cash needed
- —
Loan-product check · same deal, 3 products live
Conventional
25% down · 7.5% · 30yr
- Down + closing
- —
- Monthly P&I
- —
- Monthly cashflow
- —
- DSCR
- —
- Eligible?
- —
Personal DTI + credit; lowest rate.
DSCR
20% down · 8.5% · 30yr
- Down + closing
- —
- Monthly P&I
- —
- Monthly cashflow
- —
- DSCR
- —
- Eligible?
- —
No personal income docs; deal must DSCR.
Hard money
10% down · 12.0% · 12mo
- Down + closing
- —
- Monthly P&I
- —
- Monthly cashflow
- —
- DSCR
- —
- Eligible?
- —
Short-term bridge; refi at stabilization.
Listing history 18 events
-
2026-06-18days on market $50,000 Active 305 DOM
-
2026-06-17days on market $50,000 Active 304 DOM
-
2026-06-16days on market $50,000 Active 303 DOM
-
2026-06-15days on market $50,000 Active 302 DOM
-
2026-06-13days on market $50,000 Active 300 DOM
-
2026-06-12days on market $50,000 Active 299 DOM
-
2026-06-09days on market $50,000 Active 296 DOM
-
2026-06-08days on market $50,000 Active 295 DOM
-
2026-06-07days on market $50,000 Active 294 DOM
-
2026-06-07days on market $50,000 Active 293 DOM
-
2026-06-04days on market $50,000 Active 290 DOM
-
2026-06-02days on market $50,000 Active 289 DOM
-
2026-06-01days on market $50,000 Active 288 DOM
-
2026-05-31days on market $50,000 Active 287 DOM
-
2026-05-31days on market $50,000 Active 286 DOM
-
2025-09-18status Active
-
2025-09-06status Pending
-
2024-08-17$50,000 Active
ⓘ Source: listings_history table (triggers on properties + properties_extension) + one-shot
backfill from property_details.listing_events for pre-trigger history.
Climate risk First Street
- Flood 4/10 Moderate FEMA zone X (unshaded) · 22% chance over 30 yrs
- Wildfire 4/10 Moderate
- Heat 8/10 Severe 7 d/yr ≥111°F today · 20 d/yr by 30 yrs out
- Wind 9/10 Extreme 99% chance of damaging wind over 30 yrs
- Air quality 1/10 Low 0 unhealthy d/yr today · 0 by 30 yrs out
Nearby sold comps map
Loading sold comps map…
Walkable amenities ~0.75 mi
Loading nearby amenities…
Taxation est. · year 1
- Rental income
- $14,051
- − Mortgage interest
- −$2,801
- − Property taxes
- −$750
- − Insurance
- −$250
- − Repairs & maintenance
- −$1,124
- − Management
- −$1,124
- − Depreciation
- −$1,455
- Taxable income
- $6,547
- Est. tax owed @ 24.0%
- −$1,571
- After-tax cash flow
- $5,382/yr
For passive investors: Depreciation is non-cash, so a rental often shows a tax loss while cash-flowing — sheltering income. Rental losses are passive: they offset passive income freely, and up to $25,000/yr can offset ordinary (W-2) income if you actively participate and your MAGI is under $100k (phasing out to $0 by $150k); unused losses carry forward. On sale, claimed depreciation is recaptured at up to 25%, and gains may owe capital-gains tax (a 1031 exchange can defer both). Figures are a year-1 estimate at your 24.0% rate — not tax advice; consult a CPA.
Schools (NCES district)
- District
- Allen Parish
- NCES district ID
- 2200060
- Math proficiency
- 26% ▼ -46.00%
- Reading proficiency
- 42% ▼ -39.00%
- Median HH income
- $39,440
- Composite
- 28.45/100
- National rank
- #6751
- State rank
- #36 of 98 in LA
Livability — Oberlin
- Score
- 60/100
- State rank
- #250
- US rank
- #18808
Category grades
Schools grade is shown separately in the Schools card above.
Census & demographics
- Census place
- Oberlin, LA
- Population (ZIP)
- 2,892
Population outlook (Allen County) Hauer SSP2
- Today (2025)
- 25,056 people
- By 2030
- 24,668 · -1.5%
- By 2040
- 23,964 · -4.4%
- By 2050
- 23,166 · -7.5%
- By 2075
- 21,285 · -15.1%
- By 2100
- 15,904 · -36.5%
Race, ethnicity, and origin ACS 2023
- Neighborhood character
- Predominantly White (67%)
- Race & ethnicity
- White 67% Black 30% Hispanic / Latino 2%
- Common ancestry
- Lithuanian 17%
- Foreign-born
- 2% · Canada
- Languages at home
- 88% English-only · French/Haitian/Cajun 9% Spanish 3%
Political lean MEDSL · Allen
- 2024 margin
- Solid R (+61.0) · D 19.0% · R 80.0%
- 2008→2024 swing
- -24.7pp toward R · 2008: -36.4pp · 2024: -61.0pp
- All cycles
- 2024: R+61.0 2020: R+55.7 2016: R+51.5 2012: R+41.7 2008: R+36.4
Not yet ingested
- Civics
- —
Market trends
- HPI YoY
- ▼ -5.92%
- Current HPI
- 90.2641
- Rent YoY
- —
- Metro
- —
- State GDP YoY
- ▲ 3.29%
- F500 in state
- 10
Industry mix (Fortune 500 HQ in LA)
| Industry | F500 HQs | Revenue |
|---|---|---|
| Telecommunications | 2 | $23B |
|
||
| Utilities | 1 | $12B |
|
||
| Wholesale / Distribution | 1 | $5B |
|
||
| Advertising | 1 | $2B |
|
||
Price history
3 events — show timeline
- 2025-09-18 Relisted — SWLAR
- 2025-09-06 Pending — SWLAR
- 2024-08-17 Listed $50,000 SWLAR
Cash-flow waterfall
monthlySold comps — $/sqft
last 12 mo · ≤1 miLoading sold comps…