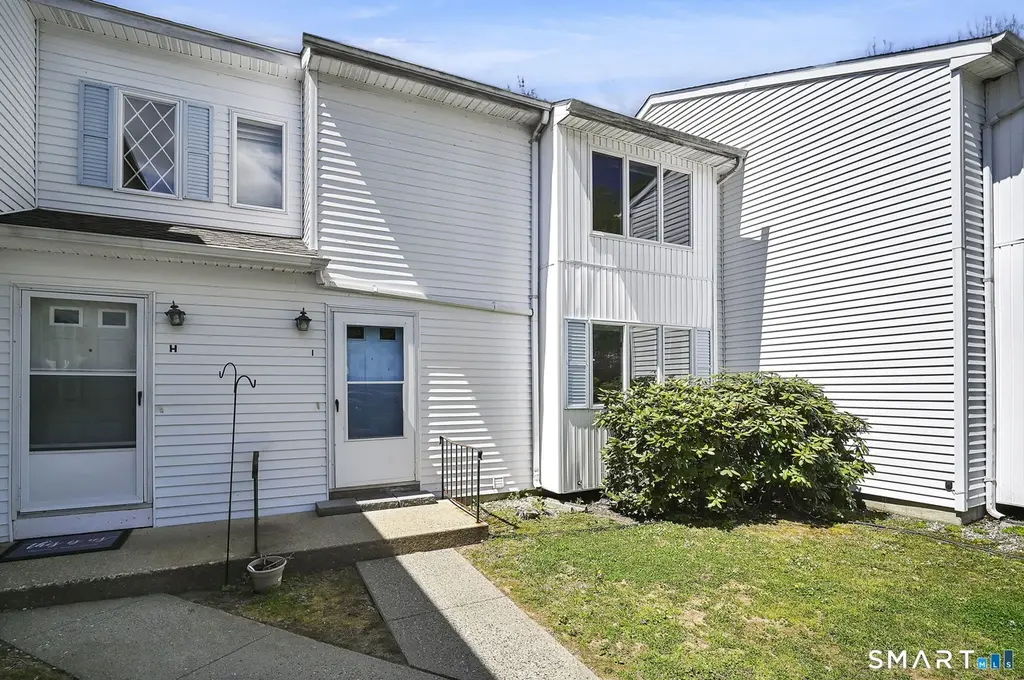
122 W Main St Unit I · Stafford, CT
Flood risk 1/10 · Minimal
- FEMA flood zone
- X
- Chance of flooding over 30 yrs
- 0.0%
- Est. flood insurance / yr
- $507 – $1,088
Fire risk 1/10 · Minimal
- Est. fire insurance / yr
- $829 – $1,539
Heat risk 4/10 · Minor
- Hot days now (above 93°F)
- 7 days/yr
- Hot days in 30 yrs
- 17 days/yr
Wind risk 6/10 · Moderate
- Chance of severe wind over 30 yrs
- 27.0%
Air-quality risk 3/10 · Minor
- Unhealthy air days now
- 2 days/yr
- Unhealthy air days in 30 yrs
- 3 days/yr
Risk factors via First Street. Map © Google.
Why this score? — see what drove the D+ grade
The composite is a weighted blend of 9 inputs, each scored 0–100. Each bar is that input's sub-score; the figure is the points it added to the 100-point composite (weight × sub-score).
- ARV discount +15.0/15.0
- Cash flow +13.2/30.0
- 1% rule +6.4/10.0
- DSCR +4.0/10.0
- Schools +3.6/10.0
- Rent growth +2.5/5.0
- Livability +2.5/5.0
- Condition / age +2.5/5.0
- Appreciation +0.0/10.0
$154,900
🖨 Deal sheet 📄 Offer letter ✓ Due diligence
Listing remarks MLS
Rare 3 BR Unit Available in Millpond Condominiums. Townhouse Style Unit Just Needs Your Finishing Touches! Lots of Natural Lighting, and Closet Space. Eat-in Kitchen with Bay Window, LR-DR Combination with Sliders to Rear Deck Where You Can Relax and Enjoy a Cup of Coffee and the Fall Water Views! There are 1.5 Baths, Spacious Bedrooms, Master has Walk-in-Closet, Full Walk out Basement could be Finished. Laundry Hook-ups in Basement. Entry way has 2 Coat Closets and/or Pantry. Don't Miss Out on Viewing this Unit!
Key facts
- Townhouse style unit
- Eat in kitchen
- Bay window
Tags
Property features AI
Finance
- Other: Part of Mill Pond complex; 14 total units in the complex
- Financial info: Property managed professionally off-site; Pets allowed with approval
- HOA & community: Homeowners association with monthly fee; Monthly HOA fee: $376; HOA covers grounds maintenance, trash pickup, snow removal, and insurance
Exterior
- Utilities: Public water connected; Public sewer connected
- Home design: Condominium; Condo/Co-Op for sale
- Construction: Frame construction; White exterior color
- Exterior features: Deck; Vinyl siding; Water view; Secluded, lightly wooded lot
Interior
- Kitchen: Oven/Range; Refrigerator; Dishwasher
- Bedrooms: 3 bedrooms
- Bathrooms: 1 full bath; 1 half bath
- Heating & cooling: Electric baseboard heat; Hot water system: Other
- Interior features: Full walk-out basement; Basement on lower level
- Laundry & utility: Laundry in basement / lower level
Neighborhood map
What this means for you Summary
Snapshot
- This is a 2-bed/1.5-bath condo listed at $155k.
Deal economics
- At list price, monthly cash flow is $-2 ($-24/yr) — negative.
- To cash-flow at today's rent, offer at most $155k (0.2% below list).
- Meets the 1% rule at list price ($2k rent vs $155k).
- Recommended offer: $155k (0.2% below list) — sets the bar for cash-flow.
Location & tenants
- Location reads: area grade D — affects rentability + tenant quality, not the cash-flow math above.
- Stafford School District (town): math 33% / reading 48% proficiency, ranked #99 of 153 in CT (top 65%) — families likely to look elsewhere, expect single-tenant / working-renter base with shorter leases.
- Zoned schools: Stafford High School (math 42% / reading 72%, grade C, #52 of 194 statewide, top 31%, 398 students, 31% FRL).
- Zoned-school proficiency averages 57% at this address vs 40% district-wide (+16 pts) — the actual schools serving this property are materially stronger than the Stafford School District average implies; a family-tenant draw the district grade alone would hide.
- Market conditions: 72 active listings in the ZIP; 3 comparable units currently listed for rent nearby; rentals leasing fast (median 2d on market — plan ~1-2 weeks tenant-placement turnaround); 1,867 units permitted in Capitol Planning Region in 2024 (1,399 in 5+ unit buildings).
Forward outlook
- Local home prices are declining (-3.0%/yr); year-one equity from $1k of loan paydown is wiped out by about $5k of value loss. Plan a longer hold.
Negotiation context
- Only 8 days on market — expect competitive offers; lowballing is unlikely to land.
- 3 sale attempts since 5y ago with the ask held roughly flat each time — persistent listings suggest the price (not the market) is what's stuck; bring a comps-based counter.
- Current owner paid $115k; 35% above their basis — modest negotiation headroom, anchor on the comps not their cost.
Risks & watch-outs
- Watch-outs: HOA is 21% of rent.
- Climate carrying-cost: major wind risk, 27% chance of damaging wind over 30y — expect insurance premiums to compound above CPI over the hold.
Questions for the listing agent
- What do current leases actually rent for vs. the listed asking? Can we see a recent rent roll and the last 12 months of T-12 income?
- What does the HOA fee cover, when was the last increase, and are there any pending special assessments or reserve-fund shortfalls?
- Any open or pending special assessments — roof, HVAC, plumbing, elevator, façade? What's the per-unit balance and payoff schedule, and is the seller paying it off at close or rolling it to the buyer?
- Is there a deadline driving the sale (1031 exchange, divorce, estate, relocation)? That informs how much negotiation room exists.
- The area grade is low — what's the realistic commute time and amenity access for the typical tenant pool here? Any planned neighborhood developments (good or bad) we should know about?
- What's the average days-on-market for RENTAL listings here right now (not sales)? A rising rental-DOM trend means longer vacancies and softer asking-rent achievability than the comps imply.
- What's the recent tenant-quality profile in this submarket — average credit score on applications, eviction rate, late-payment / NSF rate, and stable-employment percentage? A property-management company in the area should have these aggregated.
- How much new apartment / multifamily construction is in the pipeline within 1–3 miles? Heavy new supply (>2% of stock underway) typically softens rents 12–24 months out; light construction supports rent growth.
Investment metrics
- 1% rule
- 1.14% ✓
- Cap rate
- 6.28%
- Cash-on-cash
- -0.06%
- DSCR
- 1.00
- GRM
- 7.3
CMA / ARV
- ARV (median comp)
- $210,372
- List price
- $154,900
- Delta
- -26.37%
- Verdict
- UNDERPRICED
- Comps
- 20 within 1.0 mi
Projected returns pro-forma
-3.0% appreciation · 3.0% rent growth · sell at horizon
- IRR
- -16.2%
- Equity multiple
- 0.42×
- Total profit
- $-24,999
- Equity at exit
- $23,096
- IRR
- -7.6%
- Equity multiple
- 0.52×
- Total profit
- $-21,001
- Equity at exit
- $13,393
Cash invested: $43,372 (down + closing). Projections, not guarantees.
Landlord ↔ Tenant lean methodology
- Overall (STATE)
- 27 Tenant-Leaning
- State Connecticut
- 27 Tenant-Leaning · D+7
- County
- — inherits STATE
- City
- — inherits STATE
ZIP-level market 06076
- Home prices YoY
- -11.7%
- Active inventory
- 72
- Price-to-rent
- 7.3×
Monthly cashflow live
- Estimated rent
- $1,770 medium interval (Pro) →
- Mortgage (P&I)
- −$812
- Tax from tax record
- −$147 /mo · $1,768/yr
- Insurance
- −$65
- HOA
- −$376
- Vacancy / Maint / Mgmt
- −$372
- Net cashflow
- $-2
Break-even live
UW: 25.0% down · 7.5% · 30yr · 1.5% tax · 5.0% vac · 8.0% maint · 8.0% mgmt
Financing live
Cash to close
- Down payment
- $38,725
- Closing costs
- $4,647
- Reserves months
- —
- Total cash needed
- —
Loan-product check · same deal, 3 products live
Conventional
25% down · 7.5% · 30yr
- Down + closing
- —
- Monthly P&I
- —
- Monthly cashflow
- —
- DSCR
- —
- Eligible?
- —
Personal DTI + credit; lowest rate.
DSCR
20% down · 8.5% · 30yr
- Down + closing
- —
- Monthly P&I
- —
- Monthly cashflow
- —
- DSCR
- —
- Eligible?
- —
No personal income docs; deal must DSCR.
Hard money
10% down · 12.0% · 12mo
- Down + closing
- —
- Monthly P&I
- —
- Monthly cashflow
- —
- DSCR
- —
- Eligible?
- —
Short-term bridge; refi at stabilization.
Rent comps 3 comps
| Address | Beds | Baths | Sqft | Rent | $/sqft | DOM | Units | Dist |
|---|---|---|---|---|---|---|---|---|
| 30 Edgewood St Unit A Stafford Springs, CT | 3.0 | 1.0 | 1550 | $1,950 | $1.26 | 4d | 1 | 0.63mi |
| 30 Edgewood St Unit B Stafford Springs, CT | 2.0 | 1.0 | 1400 | $1,800 | $1.29 | 1d | 1 | 0.63mi |
| 58 Furnace Ave Unit B Stafford Springs, CT | 2.0 | 2.0 | 1296 | $1,500 | $1.16 | 1d | 1 | 0.72mi |
HOA detail condo
- Monthly dues
- $376 · $4,512/yr
- Likely covers
- water
- Assessments
- None detected in remarks — confirm with the listing agent.
Listing history 11 events
-
2026-05-14status Under Contract 938-char remark
-
2026-05-13historical 938-char remark
-
2026-05-08status Active 938-char remark
-
2026-05-08historical Under Contract - Continue to Show 938-char remark
-
2026-05-04$154,900 Active 938-char remark
-
2021-09-28soldstatus $114,900 Closed 518-char remark
Show marketing remark (518 chars)
Rare 3 BR Unit Available in Millpond Condominiums. Townhouse Style Unit Just Needs Your Finishing Touches! Lots of Natural Lighting, and Closet Space. Eat-in Kitchen with Bay Window, LR-DR Combination with Sliders to Rear Deck Where You Can Relax and Enjoy a Cup of Coffee and the Fall Water Views! There are 1.5 Baths, Spacious Bedrooms, Master has Walk-in-Closet, Full Walk out Basement could be Finished. Laundry Hook-ups in Basement. Entry way has 2 Coat Closets and/or Pantry. Don't Miss Out on Viewing this Unit!
-
2021-06-14historical Under Contract - Continue to Show 518-char remark
Show marketing remark (518 chars)
Rare 3 BR Unit Available in Millpond Condominiums. Townhouse Style Unit Just Needs Your Finishing Touches! Lots of Natural Lighting, and Closet Space. Eat-in Kitchen with Bay Window, LR-DR Combination with Sliders to Rear Deck Where You Can Relax and Enjoy a Cup of Coffee and the Fall Water Views! There are 1.5 Baths, Spacious Bedrooms, Master has Walk-in-Closet, Full Walk out Basement could be Finished. Laundry Hook-ups in Basement. Entry way has 2 Coat Closets and/or Pantry. Don't Miss Out on Viewing this Unit!
-
2021-06-09$114,900 Active 518-char remark
Show marketing remark (518 chars)
Rare 3 BR Unit Available in Millpond Condominiums. Townhouse Style Unit Just Needs Your Finishing Touches! Lots of Natural Lighting, and Closet Space. Eat-in Kitchen with Bay Window, LR-DR Combination with Sliders to Rear Deck Where You Can Relax and Enjoy a Cup of Coffee and the Fall Water Views! There are 1.5 Baths, Spacious Bedrooms, Master has Walk-in-Closet, Full Walk out Basement could be Finished. Laundry Hook-ups in Basement. Entry way has 2 Coat Closets and/or Pantry. Don't Miss Out on Viewing this Unit!
-
2006-09-29soldstatus $124,000
-
2006-04-20soldstatus $85,000
-
2000-01-31soldstatus $54,500
ⓘ Source: listings_history table (triggers on properties + properties_extension) + one-shot
backfill from property_details.listing_events for pre-trigger history.
Tax reassessment forecast CT · Partial reset (capped growth)
- Current annual tax
- $1,768 · $147/mo
- Projected year-2 tax
- $2,541 · $212/mo
- Expected delta
- +$773/yr (+$64/mo · 43.7%)
ⓘ Screening estimate from a state-policy table — verify with the county assessor before closing.
Climate risk First Street
- Flood 1/10 Low FEMA zone X · 0% chance over 30 yrs
- Wildfire 1/10 Low
- Heat 4/10 Moderate 7 d/yr ≥93°F today · 17 d/yr by 30 yrs out
- Wind 6/10 Major 27% chance of damaging wind over 30 yrs
- Air quality 3/10 Moderate 2 unhealthy d/yr today · 3 by 30 yrs out
Nearby sold comps map
Loading sold comps map…
Walkable amenities ~0.75 mi
Loading nearby amenities…
Taxation est. · year 1
- Rental income
- $21,238
- − Mortgage interest
- −$8,677
- − Property taxes
- −$1,768
- − Insurance
- −$774
- − Repairs & maintenance
- −$1,699
- − Management
- −$1,699
- − HOA
- −$4,512
- − Depreciation
- −$4,506
- Taxable loss
- −$2,397
- Est. tax savings @ 24.0%
- +$575
- After-tax cash flow
- $551/yr
For passive investors: Depreciation is non-cash, so a rental often shows a tax loss while cash-flowing — sheltering income. Rental losses are passive: they offset passive income freely, and up to $25,000/yr can offset ordinary (W-2) income if you actively participate and your MAGI is under $100k (phasing out to $0 by $150k); unused losses carry forward. On sale, claimed depreciation is recaptured at up to 25%, and gains may owe capital-gains tax (a 1031 exchange can defer both). Figures are a year-1 estimate at your 24.0% rate — not tax advice; consult a CPA.
Schools (NCES district)
- District
- Stafford School District
- NCES district ID
- 0904290
- Math proficiency
- 33% ▼ -13.00%
- Reading proficiency
- 48% ▼ -9.00%
- Median HH income
- $63,653
- Composite
- 36.16/100
- National rank
- #4735
- State rank
- #99 of 153 in CT
Livability — Stafford
No livability data for this city. (Only ~50 U.S. cities are tracked.)
Census & demographics
- Census place
- Stafford Springs, CT
- Population (ZIP)
- 11,989
Population outlook (Capitol County) Hauer SSP2
- By 2040
- 1,063,519
Race, ethnicity, and origin ACS 2023
- Neighborhood character
- Predominantly White (88%)
- Race & ethnicity
- White 88% Hispanic / Latino 7% Two or more races 5%
- Hispanic origin (detail)
- Puerto Rican 3% Dominican 1%
- Common ancestry
- Lithuanian 13% Romanian 12% Slovak 2%
- Foreign-born
- 3% · Canada, Jamaica
- Languages at home
- 95% English-only · Spanish 3% German/W. Germanic 1%
Political lean MEDSL · Capitol
- 2024 margin
- Strong D (+21.9) · D 60.1% · R 38.2% · Other 1.7%
- All cycles
- 2024: D+21.9
Not yet ingested
- Civics
- —
Market trends
- HPI YoY
- ▼ -33.19%
- Current HPI
- 251.5895
- Rent YoY
- —
- Metro
- —
- State GDP YoY
- ▲ 1.06%
- F500 in state
- 38
Industry mix (Fortune 500 HQ in CT)
| Industry | F500 HQs | Revenue |
|---|---|---|
| Industrial Machinery | 4 | $38B |
|
||
| Insurance | 3 | $71B |
|
||
| Financial Services | 2 | $25B |
|
||
| Transportation / Logistics | 2 | $18B |
|
||
| Healthcare | 1 | $247B |
|
||
| Telecommunications | 1 | $55B |
|
||
Price history
+184.2% since first listed11 events — show timeline
- 2026-05-14 Pending — Smart MLS
- 2026-05-13 Listing Removed — Smart MLS
- 2026-05-08 Relisted — Smart MLS
- 2026-05-08 Contingent — Smart MLS
- 2026-05-04 Listed $154,900 Smart MLS
- 2021-09-28 Sold (MLS) $114,900 Smart MLS
- 2021-06-14 Contingent — Smart MLS
- 2021-06-09 Listed $114,900 Smart MLS
- 2006-09-29 Sold (Public Records) $124,000 Public Records
- 2006-04-20 Sold (Public Records) $85,000 Public Records
- 2000-01-31 Sold (Public Records) $54,500 Public Records
Property tax history
-0.9%/yrLatest (2023): $1,768 · +3.2% YoY. Source: county tax records.
Cash-flow waterfall
monthlySold comps — $/sqft
last 12 mo · ≤1 miLoading sold comps…