 🏷️ Likely Rental
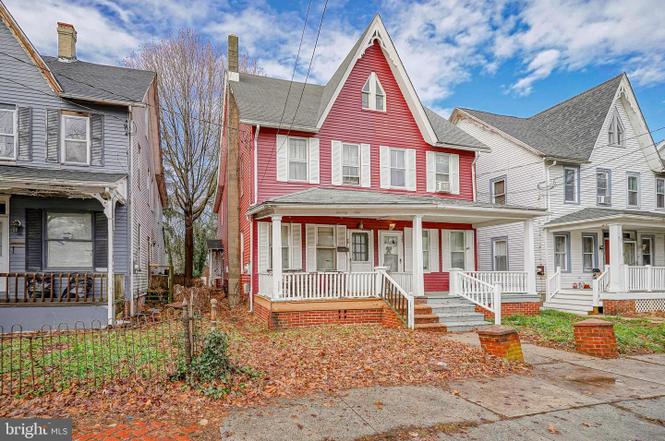
79 Walnut St · Salem, NJ
Flood risk 8/10 · Major
- FEMA flood zone
- X (shaded)
- Chance of flooding over 30 yrs
- 0.98%
- Est. flood insurance / yr
- $507 – $1,088
Fire risk 3/10 · Minor
- Est. fire insurance / yr
- $526 – $976
Heat risk 8/10 · Major
- Hot days now (above 103°F)
- 7 days/yr
- Hot days in 30 yrs
- 15 days/yr
Wind risk 6/10 · Moderate
- Chance of severe wind over 30 yrs
- 27.0%
Air-quality risk 3/10 · Minor
- Unhealthy air days now
- 2 days/yr
- Unhealthy air days in 30 yrs
- 4 days/yr
Risk factors via First Street. Map © Google.
Why this score? — see what drove the B grade
The composite is a weighted blend of 9 inputs, each scored 0–100. Each bar is that input's sub-score; the figure is the points it added to the 100-point composite (weight × sub-score).
- Cash flow +30.0/30.0
- 1% rule +10.0/10.0
- DSCR +10.0/10.0
- ARV discount +7.5/15.0
- Appreciation +4.8/10.0
- Livability +3.1/5.0
- Rent growth +2.5/5.0
- Condition / age +2.5/5.0
- Schools +1.2/10.0
$89,900
🖨 Deal sheet 📄 Offer letter ✓ Due diligence
Listing remarks
Handy persons special! Excellent opportunity! This 3 bedroom twin home has lots of potential for the savvy investor. Fix up to live in, resell or rent out. Potential rent $1500- $1600 per month. Being sold as is. Schedule appt today!
Key facts
- Built 1910
- Listed 161 days
Property features AI
Exterior
- Parking: On-street parking
- Utilities: Public water; Public sewer; Electric service with circuit breakers
- Home design: Semi-detached property; Fee simple ownership
- Construction: Other foundation; Above-grade and below-grade structures
- Exterior features: Lot dimensions approximately 20 x 162
Interior
- Bedrooms: Three bedrooms on the first upper level
- Bathrooms: One full bathroom
- Heating & cooling: Radiator / hot water heating; Oil-fired heating; Electric hot water; Cooling: Other
- Interior features: Partial basement
Neighborhood map
What this means for you Summary
Snapshot
- This is a 3-bed/1.0-bath single-family listed at $90k.
Deal economics
- At list price, monthly cash flow is $535 ($6k/yr) — positive.
- The deal already cash-flows at list — no discount required.
- Meets the 1% rule at list price ($2k rent vs $90k).
- Recommended offer: $79k (12.0% below list) — sets the bar for market timing.
- Cap rate 14.3% vs local median 8.4% in Salem — top-decile yield for the area; either an underpriced asset or a hidden risk that comps aren't pricing in. Stress-test before assuming the spread holds.
Location & tenants
- Location reads 61/100 on livability (#462 in NJ) — a middle-class / working-renter tenant base. Strengths: cost of living A+, health & safety A+, crime B; Watch: schools D, amenities F, commute F.
- Salem City School District (town): math 6% / reading 24% proficiency, ranked #464 of 472 in NJ (top 98%) — low school quality limits family demand, transient renter base, plan for 1-2y turnover; 85% free/reduced lunch — lower-income household profile, screen leases tightly.
- Market conditions: 100 active listings in the ZIP; 10 comparable units currently listed for rent nearby; rentals leasing fast (median 2d on market — plan ~1-2 weeks tenant-placement turnaround); 95 units permitted in Salem County in 2024 (0 in 5+ unit buildings).
- This rent runs 37% of the median local income ($55k/yr) — at the standard rent-burdened threshold; future hikes will face affordability resistance.
Forward outlook
- In year one you build about $280 of equity ($622 loan paydown + $-342 appreciation (-0.4% local appreciation)).
- Salem County population projected at -23% by 2050 — secular population decline; favor cash flow + early exit over multi-decade hold.
- At projected returns (-0.4% appreciation + 3.0% rent growth), your $25k cash investment doubles in ~4 years — after that, you're playing with house money.
Negotiation context
- It's been on market 162 days — a 12% lower offer ($79k) is reasonable based on typical stale-listing flexibility.
- 9 sale attempts since 19y ago with the ask held roughly flat each time — persistent listings suggest the price (not the market) is what's stuck; bring a comps-based counter.
- Current owner paid $26k; list at $90k implies a 246% gain — meaningful room to come down on a strong offer.
Risks & watch-outs
- Watch-outs: property tax is 2.9% of price; flood insurance adds $66/mo; built in 1910 — expect roof / HVAC / electrical / plumbing capex.
- Climate carrying-cost: severe flood risk; major wind risk, 27% chance of damaging wind over 30y; extreme-heat days projected 7→15/yr by 2055 (HVAC capex compounding) — expect insurance premiums to compound above CPI over the hold.
Questions for the listing agent
- It's been on market 162 days. Have you received any prior offers? Is the seller open to a 12% concession, seller financing, or rate buy-down credit?
- Built in 1910 — when were the roof, HVAC, electrical panel, plumbing, and water heater last replaced?
- Property tax is high relative to price — has the assessment been appealed recently, and will the sale trigger a re-assessment?
- What's the actual annual flood-insurance premium (NFIP or private), and is the property in a SFHA with mandatory coverage?
- Why hasn't it sold? Are there any deal-killer items the seller is aware of (foundation, flood, title, zoning, code violations)?
- Is there a deadline driving the sale (1031 exchange, divorce, estate, relocation)? That informs how much negotiation room exists.
- Schools are D-rated, which usually means shorter tenancies and higher turnover. Who's the typical renter profile here, and what's been the actual vacancy rate?
- What's the average days-on-market for RENTAL listings here right now (not sales)? A rising rental-DOM trend means longer vacancies and softer asking-rent achievability than the comps imply.
- What's the recent tenant-quality profile in this submarket — average credit score on applications, eviction rate, late-payment / NSF rate, and stable-employment percentage? A property-management company in the area should have these aggregated.
- How much new for-sale + rental construction is in the pipeline within 1–3 miles? Heavy new supply typically softens prices + rents 12–24 months out; constrained supply supports both.
Investment metrics
- 1% rule
- 1.87% ✓
- Cap rate
- 14.33%
- Cash-on-cash
- 28.69%
- DSCR
- 2.28
- GRM
- 4.5
CMA / ARV
- ARV (on-the-fly)
- $202,664
- Comps found
- 12
Show comp detail 12 sales within ~0.75 mi
| Address | Dist | Beds/Ba | Sqft | Sold | Price | $/sf | Match |
|---|---|---|---|---|---|---|---|
| 304 New Market St | 0.07mi | 3/1.0 | 1,310 (-0%) | 4mo | $186,000 | $142 | 92 |
| 410 Magnolia St | 0.46mi | 2/1.0 (-1) | 1,310 (-0%) | 1mo | $170,000 | $130 | 72 |
| 318 Fenwick Ave | 0.51mi | 3/1.0 | 1,344 (+2%) | 3mo | $191,250 | $142 | 71 |
| 197 Pine Ave | 0.63mi | 3/1.0 | 1,318 (+0%) | 2mo | $205,000 | $156 | 68 |
| 201 Chestnut St | 0.56mi | 3/1.0 | 1,308 (-1%) | 6mo | $128,500 | $98 | 68 |
| 208 9th St | 0.37mi | 3/1.0 | 1,149 (-13%) | 1mo | $224,000 | $195 | 61 |
| 272 E Broadway | 0.28mi | 3/2.0 | 1,500 (+14%) | 1mo | $65,000 | $43 | 59 |
| 14 Yorke St | 0.51mi | 3/1.5 | 1,197 (-9%) | 1mo | $161,000 | $135 | 58 |
| 188 Cook Ave | 0.45mi | 4/2.0 (+1) | 1,260 (-4%) | 6mo | $210,000 | $167 | 57 |
| 179 Victory Ave | 0.41mi | 4/1.5 (+1) | 1,449 (+10%) | 0mo | $238,000 | $164 | 56 |
| 352 Allen Ave | 0.42mi | 3/1.5 | 1,460 (+11%) | 6mo | $225,000 | $154 | 55 |
| 363 Grant St | 0.56mi | 3/2.5 | 1,424 (+8%) | 0mo | $250,000 | $176 | 54 |
Match score weights: distance 35% · size 25% · config 20% · recency 20%. Top-matched comps best support the ARV.
Projected returns pro-forma
-0.38% appreciation · 3.0% rent growth · sell at horizon
- IRR
- 25.0%
- Equity multiple
- 2.19×
- Total profit
- $29,999
- Equity at exit
- $24,408
- IRR
- 29.5%
- Equity multiple
- 4.20×
- Total profit
- $80,579
- Equity at exit
- $28,018
Cash invested: $25,172 (down + closing). Projections, not guarantees.
Landlord ↔ Tenant lean methodology
- Overall (STATE)
- 21 Tenant-Leaning
- State New Jersey
- 21 Tenant-Leaning · D+6
- County
- — inherits STATE
- City
- — inherits STATE
ZIP-level market 08079
- Home prices YoY
- -0.1%
- Active inventory
- 100
- Price-to-rent
- 4.5×
Monthly cashflow live
- Estimated rent
- $1,682 high interval (Pro) →
- Mortgage (P&I)
- −$471
- Tax from tax record
- −$218 /mo · $2,614/yr
- Insurance
- −$37
- Flood insurance flood zone
- −$66 /mo · $798/yr
- HOA
- −$0
- Vacancy / Maint / Mgmt
- −$353
- Net cashflow
- $535
Break-even live
UW: 25.0% down · 7.5% · 30yr · 1.5% tax · 5.0% vac · 8.0% maint · 8.0% mgmt
Financing live
Cash to close
- Down payment
- $22,475
- Closing costs
- $2,697
- Reserves months
- —
- Total cash needed
- —
Loan-product check · same deal, 3 products live
Conventional
25% down · 7.5% · 30yr
- Down + closing
- —
- Monthly P&I
- —
- Monthly cashflow
- —
- DSCR
- —
- Eligible?
- —
Personal DTI + credit; lowest rate.
DSCR
20% down · 8.5% · 30yr
- Down + closing
- —
- Monthly P&I
- —
- Monthly cashflow
- —
- DSCR
- —
- Eligible?
- —
No personal income docs; deal must DSCR.
Hard money
10% down · 12.0% · 12mo
- Down + closing
- —
- Monthly P&I
- —
- Monthly cashflow
- —
- DSCR
- —
- Eligible?
- —
Short-term bridge; refi at stabilization.
Rent comps 10 comps
| Address | Beds | Baths | Sqft | Rent | $/sqft | DOM | Units | Dist |
|---|---|---|---|---|---|---|---|---|
| 218 Sinnickson St Salem, NJ | 2.0 | 1.0 | 1008 | $1,500 | $1.49 | 1d | 1 | 0.10mi |
| 26 Walnut St Unit A Salem, NJ | 2.0 | 1.0 | 1000 | $1,225 | $1.23 | 1d | 1 | 0.19mi |
| 1 9th St Salem, NJ | 2.0 | 1.0 | 900 | $1,450 | $1.61 | 1d | 1 | 0.32mi |
| 332 E Broadway Salem, NJ | 3.0 | 2.0 | 1844 | $1,980 | $1.07 | 43d | 1 | 0.33mi |
| 380 E Broadway Salem, NJ | 2.0 | 1.0 | 1300 | $1,350 | $1.04 | 1d | 1 | 0.43mi |
| 242 Grant St Unit 1ST FLOOR Salem, NJ | 2.0 | 1.0 | 925 | $1,675 | $1.81 | 1d | 1 | 0.49mi |
| 270-272 Grant St Salem, NJ | 4.0 | 1.0 | 1644 | $2,100 | $1.28 | 5d | 1 | 0.50mi |
| 124 Yorke St Unit 37 Salem, NJ | 2.0 | 1.0 | 1220 | $1,350 | $1.11 | 2d | 1 | 0.67mi |
| 37 Eighth St Salem, NJ | 3.0 | 1.0 | 1092 | $1,850 | $1.69 | 1d | 1 | 0.71mi |
| 23 7th St Unit B Salem, NJ | 3.0 | 1.0 | 1000 | $1,450 | $1.45 | 3d | 1 | 0.73mi |
Listing history 37 events
-
2026-06-18days on market $89,900 Active 162 DOM
-
2026-06-17days on market $89,900 Active 161 DOM
-
2026-06-16days on market $89,900 Active 160 DOM
-
2026-06-15days on market $89,900 Active 159 DOM
-
2026-06-13days on market $89,900 Active 157 DOM
-
2026-06-13days on market $89,900 Active 156 DOM
-
2026-06-09days on market $89,900 Active 153 DOM
-
2026-06-08days on market $89,900 Active 152 DOM
-
2026-06-07days on market $89,900 Active 151 DOM
-
2026-06-04days on market $89,900 Active 148 DOM
-
2026-06-03days on market $89,900 Active 147 DOM
-
2026-06-02days on market $89,900 Active 146 DOM
-
2026-06-01days on market $89,900 Active 145 DOM
-
2026-05-31days on market $89,900 Active 144 DOM
-
2026-01-08$89,900 Active
-
2026-01-03historical $89,900
-
2025-06-18historical
-
2025-05-23$90,000 Active
-
2025-05-23$90,000 Active
-
2025-04-15historical
-
2024-11-24price $90,000
-
2024-10-19$80,000 Active
-
2021-03-31soldstatus $26,000 Closed
-
2021-03-10status Pending
-
2021-02-22$29,325 Active
-
2012-10-03historical
-
2012-10-03soldstatus $18,201 Sold
-
2012-10-03soldstatus $18,201
-
2012-08-23status Under Contract
-
2012-07-29historical
-
2012-05-11$25,000 Active
-
2012-05-11$25,000
-
2009-08-30historical
-
2009-02-10$68,000
-
2008-12-01historical
-
2007-05-17$68,000
-
1995-02-21soldstatus $42,000
ⓘ Source: listings_history table (triggers on properties + properties_extension) + one-shot
backfill from property_details.listing_events for pre-trigger history.
Tax reassessment forecast NJ · Partial reset (capped growth)
- Current annual tax
- $2,614 · $218/mo
- Projected year-2 tax
- $2,614 · $218/mo
- Expected delta
- $0/yr ($0/mo · 0.0%)
ⓘ Screening estimate from a state-policy table — verify with the county assessor before closing.
Climate risk First Street
- Flood 8/10 Severe FEMA zone X (shaded) · 98% chance over 30 yrs
- Wildfire 3/10 Moderate
- Heat 8/10 Severe 7 d/yr ≥103°F today · 15 d/yr by 30 yrs out
- Wind 6/10 Major 27% chance of damaging wind over 30 yrs
- Air quality 3/10 Moderate 2 unhealthy d/yr today · 4 by 30 yrs out
Nearby sold comps map
Loading sold comps map…
Walkable amenities ~0.75 mi
Loading nearby amenities…
Taxation est. · year 1
- Rental income
- $20,180
- − Mortgage interest
- −$5,036
- − Property taxes
- −$2,614
- − Insurance
- −$1,247
- − Repairs & maintenance
- −$1,614
- − Management
- −$1,614
- − Depreciation
- −$2,615
- Taxable income
- $5,439
- Est. tax owed @ 24.0%
- −$1,305
- After-tax cash flow
- $5,118/yr
For passive investors: Depreciation is non-cash, so a rental often shows a tax loss while cash-flowing — sheltering income. Rental losses are passive: they offset passive income freely, and up to $25,000/yr can offset ordinary (W-2) income if you actively participate and your MAGI is under $100k (phasing out to $0 by $150k); unused losses carry forward. On sale, claimed depreciation is recaptured at up to 25%, and gains may owe capital-gains tax (a 1031 exchange can defer both). Figures are a year-1 estimate at your 24.0% rate — not tax advice; consult a CPA.
Schools (NCES district)
- District
- Salem City School District
- NCES district ID
- 3414550
- Math proficiency
- 6% ▼ -1.00%
- Reading proficiency
- 24% ▲ 2.00%
- Median HH income
- $27,118
- Composite
- 11.51/100
- National rank
- #9702
- State rank
- #464 of 472 in NJ
Livability — Salem
- Score
- 61/100
- State rank
- #462
- US rank
- #17533
Category grades
Schools grade is shown separately in the Schools card above.
Census & demographics
- Census place
- Salem, NJ
- County
- Salem County · 24,175 people
- City population
- 10,762
- Metro
- Philadelphia-Camden-Wilmington, PA-NJ-DE-MD
- Population (ZIP)
- 10,762
- Household income
- $54,641
- Rent vs Own
- Severe rent burden
- 663.0
Population outlook (Salem County) Hauer SSP2
- Today (2025)
- 59,905 people
- By 2030
- 57,351 · -4.3%
- By 2040
- 51,837 · -13.5%
- By 2050
- 46,356 · -22.6%
- By 2075
- 36,452 · -39.2%
- By 2100
- 28,907 · -51.7%
Race, ethnicity, and origin ACS 2023
- Neighborhood character
- Diverse neighborhood (Simpson 0.55)
- Race & ethnicity
- White 59% Black 31% Hispanic / Latino 6% Two or more races 5% Asian 1%
- Hispanic origin (detail)
- Puerto Rican 5%
- Common ancestry
- Romanian 3% Lithuanian 2% Italian 1%
- Foreign-born
- 2% · Canada
- Languages at home
- 94% English-only · Spanish 4% Tagalog/Filipino 1%
Political lean MEDSL · Salem
- 2024 margin
- R (+19.2) · D 39.6% · R 58.8% · Other 1.6%
- 2008→2024 swing
- -23.1pp toward R · 2008: 3.9pp · 2024: -19.2pp
- All cycles
- 2024: R+19.2 2020: R+12.8 2016: R+15.4 2012: D+0.8 2008: D+3.9
Not yet ingested
- Civics
- —
Market trends
- HPI YoY
- ▼ -0.38%
- Current HPI
- 258.0047
- Rent YoY
- —
- Metro
- Philadelphia-Camden-Wilmington, PA-NJ-DE-MD
- State GDP YoY
- ▲ 2.05%
- F500 in state
- 34
Industry mix (Fortune 500 HQ in NJ)
| Industry | F500 HQs | Revenue |
|---|---|---|
| Consumer Goods | 3 | $31B |
|
||
| Pharmaceuticals | 2 | $153B |
|
||
| Technology | 2 | $21B |
|
||
| Insurance | 2 | $20B |
|
||
| Healthcare | 2 | $19B |
|
||
| Financial Services | 1 | $70B |
|
||
Price history
+114.0% since first listed23 events — show timeline
- 2026-01-08 Listed $89,900 BRIGHT MLS
- 2026-01-03 Coming Soon $89,900 BRIGHT MLS
- 2025-06-18 Listing Removed — BRIGHT MLS
- 2025-05-23 Listed $90,000 BRIGHT MLS
- 2025-05-23 Listed $90,000 MOMLS
- 2025-04-15 Listing Removed — BRIGHT MLS
- 2024-11-24 Price Changed $90,000 BRIGHT MLS
- 2024-10-19 Listed $80,000 BRIGHT MLS
- 2021-03-31 Sold (MLS) $26,000 BRIGHT MLS
- 2021-03-10 Pending — BRIGHT MLS
- 2021-02-22 Listed $29,325 BRIGHT MLS
- 2012-10-03 Delisted — TREND
- 2012-10-03 Sold (MLS) $18,201 BRIGHT MLS
- 2012-10-03 Sold (MLS) $18,201 TREND
- 2012-08-23 Pending — TREND
- 2012-07-29 Listing Removed — BRIGHT MLS
- 2012-05-11 Listed $25,000 BRIGHT MLS
- 2012-05-11 Listed $25,000 TREND
- 2009-08-30 Listing Removed — BRIGHT MLS
- 2009-02-10 Listed $68,000 BRIGHT MLS
- 2008-12-01 Listing Removed — BRIGHT MLS
- 2007-05-17 Listed $68,000 BRIGHT MLS
- 1995-02-21 Sold (Public Records) $42,000 Public Records
Property tax history
+0.1%/yrLatest (2025): $2,614 · +4.9% YoY. Source: county tax records.
Cash-flow waterfall
monthlySold comps — $/sqft
last 12 mo · ≤1 miLoading sold comps…