 🏷️ Likely Rental
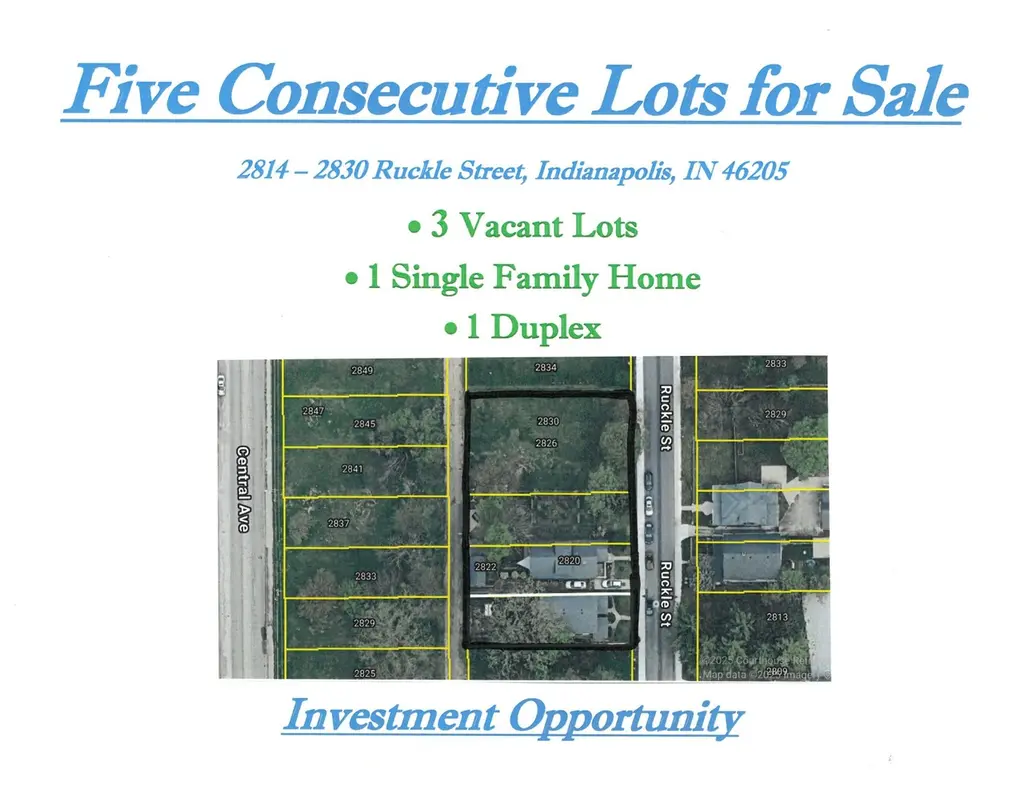
2814 Ruckle St · Indianapolis city (balance), IN
Flood risk 8/10 · Major
- FEMA flood zone
- X (unshaded)
- Chance of flooding over 30 yrs
- 0.99%
- Est. flood insurance / yr
- $473 – $860
Fire risk 1/10 · Minimal
- Est. fire insurance / yr
- $717 – $1,331
Heat risk 3/10 · Minor
- Hot days now (above 101°F)
- 7 days/yr
- Hot days in 30 yrs
- 19 days/yr
Wind risk 2/10 · Minimal
- Chance of severe wind over 30 yrs
- 0.0%
Air-quality risk 4/10 · Minor
- Unhealthy air days now
- 5 days/yr
- Unhealthy air days in 30 yrs
- 7 days/yr
Risk factors via First Street. Map © Google.
Why this score? — see what drove the B grade
The composite is a weighted blend of 9 inputs, each scored 0–100. Each bar is that input's sub-score; the figure is the points it added to the 100-point composite (weight × sub-score).
- Cash flow +28.5/30.0
- ARV discount +15.0/15.0
- DSCR +10.0/10.0
- 1% rule +9.6/10.0
- Rent growth +4.1/5.0
- Livability +2.5/5.0
- Condition / age +2.5/5.0
- Schools +1.4/10.0
- Appreciation +0.0/10.0
$200,000
🖨 Deal sheet 📄 Offer letter ✓ Due diligence
Multi-family units
County records classify this as Multi-Family (2-4 Unit). Listing-text estimate: 2 units. confirmed
Listing remarks
DUPLEX FOR SALE --- Long-time tenants on both sides who would like to stay with new owner. $2,000 per month combined rental income. Tenants pay all utilities. Newer roof & independent Bryant HVAC systems on both sides. Units separately metered. Both sides have 3 bedrooms and 1 full bathroom, covered front porches and full unfinished basements with laundry hookups. This was a duplex from day 1 with a solid wall between the units. There's some backyard space and easy street parking. Plug and play investment.
Key facts
- Newer roof
- Easy street parking
- Backyard space
Tags
Property features AI
Finance
- Other: Current use: Residential; Lot under 1/4 acre (approx. 0.12 acre); Not a conversion
- Financial info: Two-unit building; Reported gross income: $24,000; Reported expenses: $0; Sample unit rent: $1,075 per month for the 3-bedroom unit
Exterior
- Parking: On-street parking
- Utilities: Sewer and water available; Separate gas meter; Separate sewer meter; Municipal solid waste service
- Home design: Residential income property — duplex; Two stories; Faces east
- Construction: Asphalt roof
- Exterior features: Full fence; Curbs, sidewalks, storm sewer; Asphalt road frontage (city street)
Interior
- Kitchen: Unit with kitchen (3-bedroom unit)
- Bedrooms: One 3-bedroom unit
- Heating & cooling: Forced air heating (natural gas); Central air conditioning
- Interior features: Daylight full unfinished basement; Separate gas and sewer meters
- Laundry & utility: Laundry located in basement
Neighborhood map
What this means for you Summary
Snapshot
- This is a 2 × 3-bed/1.0-bath units multifamily listed at $200k.
Deal economics
- At list price, monthly cash flow is $596 ($7k/yr) — positive. Per door: $298/mo.
- The deal already cash-flows at list — no discount required.
- Meets the 1% rule at list price ($3k rent vs $200k).
- Cap rate 10.2% vs local median 4.4% in Indianapolis city (balance) — top-decile yield for the area; either an underpriced asset or a hidden risk that comps aren't pricing in. Stress-test before assuming the spread holds.
Location & tenants
- Location reads: area grade B — affects rentability + tenant quality, not the cash-flow math above.
- Indianapolis Public Schools (urban): math 14% / reading 20% proficiency, ranked #286 of 301 in IN (top 95%) — low school quality limits family demand, transient renter base, plan for 1-2y turnover; 77% free/reduced lunch — lower-income household profile, screen leases tightly.
- Market conditions: Rents rising fast (+6.2%/yr); 314 active listings in the ZIP; 40 comparable units currently listed for rent nearby; rentals lingering (median 44d on market — plan ~5-8 weeks vacancy on turnover, expect pricing pressure); 50% of comp listings sitting > 30 days — soft ceiling on asking rent; 1,906 units permitted in Marion County in 2024 (621 in 5+ unit buildings).
- At $2,912/mo this rent would consume 48% of the median local household income ($72k/yr) (locally 1149% of renters already pay >50% of income on rent) — very limited rent-growth headroom before tenants either downsize or default.
Forward outlook
- Local home prices are declining (-3.0%/yr); year-one equity from $1k of loan paydown is wiped out by about $6k of value loss. Plan a longer hold.
- Marion County population projected at +18% by 2050 — long-run rental-demand tailwind backs the buy-and-hold thesis.
- At projected returns (-3.0% appreciation + 6.2% rent growth), your $56k cash investment doubles in ~7 years — after that, you're playing with house money.
Negotiation context
- Only 1 days on market — expect competitive offers; lowballing is unlikely to land.
- 10 sale attempts since 25y ago with the ask held roughly flat each time — persistent listings suggest the price (not the market) is what's stuck; bring a comps-based counter.
- Current owner paid $20k; list at $200k implies a 905% gain — meaningful room to come down on a strong offer.
Risks & watch-outs
- Watch-outs: property tax is 3.1% of price; flood insurance adds $56/mo; built in 1920 — expect roof / HVAC / electrical / plumbing capex.
- Climate carrying-cost: severe flood risk — expect insurance premiums to compound above CPI over the hold.
Questions for the listing agent
- Can we see the unit-by-unit rent roll, current vacancy, and any below-market leases? What's the average tenancy length?
- What capital expenditures (roof, boiler, parking lot, exteriors) have been made in the last 5 years, and what's planned in the next 2?
- Built in 1920 — when were the roof, HVAC, electrical panel, plumbing, and water heater last replaced?
- Property tax is high relative to price — has the assessment been appealed recently, and will the sale trigger a re-assessment?
- What's the actual annual flood-insurance premium (NFIP or private), and is the property in a SFHA with mandatory coverage?
- Is there a deadline driving the sale (1031 exchange, divorce, estate, relocation)? That informs how much negotiation room exists.
- What's the average days-on-market for RENTAL listings here right now (not sales)? A rising rental-DOM trend means longer vacancies and softer asking-rent achievability than the comps imply.
- What's the recent tenant-quality profile in this submarket — average credit score on applications, eviction rate, late-payment / NSF rate, and stable-employment percentage? A property-management company in the area should have these aggregated.
- How much new apartment / multifamily construction is in the pipeline within 1–3 miles? Heavy new supply (>2% of stock underway) typically softens rents 12–24 months out; light construction supports rent growth.
Investment metrics
- 1% rule
- 1.46% ✓
- Cap rate
- 10.20%
- Cash-on-cash
- 13.96%
- DSCR
- 1.62
- GRM
- 5.7
CMA / ARV
- ARV (on-the-fly)
- $266,112
- Comps found
- 1
Show comp detail 1 sale within ~0.75 mi
| Address | Dist | Beds/Ba | Sqft | Sold | Price | $/sf | Match |
|---|---|---|---|---|---|---|---|
| 2325 Guilford Ave | 0.62mi | 3/2.0 (-1) | 1,260 (+2%) | 12mo | $272,300 | $216 | 44 |
Match score weights: distance 35% · size 25% · config 20% · recency 20%. Top-matched comps best support the ARV.
Projected returns pro-forma
-3.0% appreciation · 6.21% rent growth · sell at horizon
- IRR
- 6.8%
- Equity multiple
- 1.28×
- Total profit
- $15,497
- Equity at exit
- $29,821
- IRR
- 19.2%
- Equity multiple
- 2.89×
- Total profit
- $105,904
- Equity at exit
- $17,292
Cash invested: $56,000 (down + closing). Projections, not guarantees.
Landlord ↔ Tenant lean methodology
- Overall (STATE)
- 90 Strongly Landlord-Friendly
- State Indiana
- 90 Strongly Landlord-Friendly · R+11
- County
- — inherits STATE
- City
- — inherits STATE
ZIP-level market 46205
- Rents YoY
- 6.2%
- Active inventory
- 314
- Price-to-rent
- 11.4×
Monthly cashflow live
- Estimated rent
- $2,912 high interval (Pro) →
- Mortgage (P&I)
- −$1,049
- Tax from tax record
- −$517 /mo · $6,202/yr
- Insurance
- −$83
- Flood insurance flood zone
- −$56 /mo · $666/yr
- HOA
- −$0
- Vacancy / Maint / Mgmt
- −$612
- Net cashflow
- $596
Break-even live
2-unit breakdown (identical units grouped — click to expand)
| Units | Beds | Baths | Est. rent |
|---|---|---|---|
| 2× units | 3 | 1 | $2,912 |
| #1 | 3 | 1 | $1,456 |
| #2 | 3 | 1 | $1,456 |
| Total (2 units) | $2,912 | ||
UW: 25.0% down · 7.5% · 30yr · 1.5% tax · 5.0% vac · 8.0% maint · 8.0% mgmt
Financing live
Cash to close
- Down payment
- $50,000
- Closing costs
- $6,000
- Reserves months
- —
- Total cash needed
- —
Loan-product check · same deal, 3 products live
Conventional
25% down · 7.5% · 30yr
- Down + closing
- —
- Monthly P&I
- —
- Monthly cashflow
- —
- DSCR
- —
- Eligible?
- —
Personal DTI + credit; lowest rate.
DSCR
20% down · 8.5% · 30yr
- Down + closing
- —
- Monthly P&I
- —
- Monthly cashflow
- —
- DSCR
- —
- Eligible?
- —
No personal income docs; deal must DSCR.
Hard money
10% down · 12.0% · 12mo
- Down + closing
- —
- Monthly P&I
- —
- Monthly cashflow
- —
- DSCR
- —
- Eligible?
- —
Short-term bridge; refi at stabilization.
Rent comps 40 comps
| Address | Beds | Baths | Sqft | Rent | $/sqft | DOM | Units | Dist |
|---|---|---|---|---|---|---|---|---|
| 2920 Ruckle St Indianapolis, IN | 3.0 | 1.5 | 1272 | $1,700 | $1.34 | 7d | 1 | 0.08mi |
| 2950 Ruckle St Indianapolis, IN | 3.0 | 1.0 | 1450 | $1,300 | $0.90 | 43d | 1 | 0.13mi |
| 2958 N Park Ave Unit 2958 Indianapolis, IN | 3.0 | 1.5 | 1350 | $1,450 | $1.07 | 3d | 1 | 0.17mi |
| 2960 N Park Ave Indianapolis, IN | 3.0 | 2.0 | 1400 | $1,595 | $1.14 | 43d | 1 | 0.17mi |
| 2960 N Park Ave Indianapolis, IN | 3.0 | 1.5 | 1400 | $1,550 | $1.11 | 23d | 1 | 0.17mi |
| 2925 N Delaware St Indianapolis, IN | 3.0 | 1.5 | 1322 | $1,275 | $0.96 | 23d | 1 | 0.22mi |
| 2955 N Delaware St Indianapolis, IN | 3.0 | 1.5 | 1400 | $1,600 | $1.14 | 43d | 1 | 0.24mi |
| 2901 N Talbott St Indianapolis, IN | 3.0 | 1.5 | 1388 | $1,400 | $1.01 | 43d | 1 | 0.27mi |
| 2813 N Talbott St Indianapolis, IN | 3.0 | 2.0 | 1297 | $1,800 | $1.39 | 43d | 1 | 0.27mi |
| 2801 N Talbott St Unit A Indianapolis, IN | 3.0 | 2.0 | 1296 | $1,850 | $1.43 | 43d | 1 | 0.27mi |
| 2809 N Talbott St Indianapolis, IN | 3.0 | 2.0 | 1250 | $1,750 | $1.40 | 43d | 1 | 0.27mi |
| 2805 N Talbott St Indianapolis, IN | 3.0 | 2.0 | 1296 | $1,800 | $1.39 | 43d | 1 | 0.27mi |
| 2709 N College Ave Indianapolis, IN | 3.0 | 2.0 | 1500 | $2,200 | $1.47 | 23d | 1 | 0.29mi |
| 2707 N College Ave Indianapolis, IN | 3.0 | 2.0 | 1500 | $2,200 | $1.47 | 17d | 1 | 0.29mi |
| 321 E 31st St Indianapolis, IN | 3.0 | 1.0 | 1390 | $1,400 | $1.01 | 43d | 1 | 0.30mi |
| 3106 N College Ave Indianapolis, IN | 3.0 | 1.5 | 1400 | $1,700 | $1.21 | 7d | 1 | 0.36mi |
| 3141 N Park Ave Indianapolis, IN | 3.0 | 1.0 | 1390 | $1,000 | $0.72 | 43d | 1 | 0.38mi |
| 2519 N College Ave Unit 1 Indianapolis, IN | 3.0 | 2.5 | 1416 | $1,850 | $1.31 | 43d | 1 | 0.39mi |
| 2751 Guilford Ave Unit B Indianapolis, IN | 3.0 | 2.0 | 1250 | $1,750 | $1.40 | 14d | 1 | 0.40mi |
| 2751 Guilford Ave Unit Aunit Indianapolis, IN | 3.0 | 2.0 | 1250 | $1,750 | $1.40 | 43d | 1 | 0.40mi |
| 2711 Guilford Ave Indianapolis, IN | 3.0 | 2.0 | 1250 | $1,695 | $1.36 | 23d | 1 | 0.42mi |
| 3103 N Meridian St Indianapolis, IN | 3.0 | 2.0 | 1280 | $1,775 | $1.39 | 23d | 1 | 0.48mi |
| 2950 Winthrop Ave Indianapolis, IN | 3.0 | 2.0 | 1224 | $1,449 | $1.18 | 43d | 1 | 0.49mi |
| 2437 N Pennsylvania St Indianapolis, IN | 3.0 | 2.0 | 1400 | $1,650 | $1.18 | 23d | 1 | 0.52mi |
| 3110 Guilford Ave Indianapolis, IN | 3.0 | 1.5 | 1250 | $1,295 | $1.04 | 23d | 1 | 0.55mi |
| 514 E 33rd St Indianapolis, IN | 3.0 | 1.0 | 1208 | $1,200 | $0.99 | 23d | 1 | 0.55mi |
| 512 E 33rd St Indianapolis, IN | 3.0 | 1.0 | 1208 | $1,200 | $0.99 | 23d | 1 | 0.55mi |
| 3139 Guilford Ave Indianapolis, IN | 3.0 | 1.0 | 1068 | $1,345 | $1.26 | 43d | 1 | 0.62mi |
| 2757 Columbia Ave Unit 2757-B Indianapolis, IN | 3.0 | 2.0 | 1350 | $1,525 | $1.13 | 43d | 1 | 0.67mi |
| 3365 Broadway St Indianapolis, IN | 3.0 | 2.0 | 1300 | $1,700 | $1.31 | 43d | 1 | 0.67mi |
| 2553 Columbia Ave Unit 2553-B Indianapolis, IN | 3.0 | 2.0 | 1350 | $1,525 | $1.13 | 43d | 1 | 0.69mi |
| 2549 Columbia Ave Unit 1332865P Indianapolis, IN | 3.0 | 2.0 | 893 | $2,274 | $2.55 | 2d | 1 | 0.70mi |
| 728 E 34th St Indianapolis, IN | 3.0 | 1.0 | 1491 | $1,400 | $0.94 | 4d | 1 | 0.73mi |
| 728 E 34th St Indianapolis, IN | 3.0 | 1.0 | 1491 | $1,400 | $0.94 | 20d | 1 | 0.73mi |
| 2136 Central Ave Indianapolis, IN | 3.0 | 1.0–2.0 | 1325 | $3,499 | $2.64 | 1d | 33 | 0.77mi |
| 2168 Carrollton Ave Indianapolis, IN | 3.0 | 1.5 | 1300 | $1,799 | $1.38 | 3d | 1 | 0.78mi |
| 2145 Coretta Way Indianapolis, IN | 3.0 | 3.0 | 1430 | $2,600 | $1.82 | 43d | 1 | 0.79mi |
| 3031 Boulevard Pl Indianapolis, IN | 3.0 | 1.5 | 1395 | $1,450 | $1.04 | 17d | 1 | 0.81mi |
| 2117 Coretta Way Indianapolis, IN | 3.0 | 3.5 | 1409 | $2,300 | $1.63 | 43d | 1 | 0.81mi |
| 2340 Columbia Ave Unit 2340-B Indianapolis, IN | 3.0 | 2.0 | 1350 | $1,650 | $1.22 | 43d | 1 | 0.81mi |
Listing history 17 events
-
2026-05-12$725,000 Active 1413-char remark
-
2026-05-07$725,000 Active 1412-char remark
-
2026-01-31historical
-
2026-01-31historical
-
2025-12-11$825,000 Active
-
2025-12-11$825,000 Active
-
2008-08-22soldstatus $19,900
-
2008-07-22$19,900
-
2007-12-03historical
-
2007-03-27$114,500
-
2006-10-19historical
-
2006-05-21$114,500
-
2004-03-04soldstatus $100,000
-
2001-12-20soldstatus $30,500
-
2001-11-30historical
-
2001-11-08$32,000
-
2001-05-23$39,900
ⓘ Source: listings_history table (triggers on properties + properties_extension) + one-shot
backfill from property_details.listing_events for pre-trigger history.
Tax reassessment forecast IN · Partial reset (capped growth)
- Current annual tax
- $6,202 · $517/mo
- Projected year-2 tax
- $6,202 · $517/mo
- Expected delta
- $0/yr ($0/mo · 0.0%)
ⓘ Screening estimate from a state-policy table — verify with the county assessor before closing.
Climate risk First Street
- Flood 8/10 Severe FEMA zone X (unshaded) · 99% chance over 30 yrs
- Wildfire 1/10 Low
- Heat 3/10 Moderate 7 d/yr ≥101°F today · 19 d/yr by 30 yrs out
- Wind 2/10 Low 0% chance of damaging wind over 30 yrs
- Air quality 4/10 Moderate 5 unhealthy d/yr today · 7 by 30 yrs out
Nearby sold comps map
Loading sold comps map…
Walkable amenities ~0.75 mi
Loading nearby amenities…
Taxation est. · year 1
- Rental income
- $34,944
- − Mortgage interest
- −$11,203
- − Property taxes
- −$6,202
- − Insurance
- −$1,666
- − Repairs & maintenance
- −$2,796
- − Management
- −$2,796
- − Depreciation
- −$5,818
- Taxable income
- $4,463
- Est. tax owed @ 24.0%
- −$1,071
- After-tax cash flow
- $6,080/yr
For passive investors: Depreciation is non-cash, so a rental often shows a tax loss while cash-flowing — sheltering income. Rental losses are passive: they offset passive income freely, and up to $25,000/yr can offset ordinary (W-2) income if you actively participate and your MAGI is under $100k (phasing out to $0 by $150k); unused losses carry forward. On sale, claimed depreciation is recaptured at up to 25%, and gains may owe capital-gains tax (a 1031 exchange can defer both). Figures are a year-1 estimate at your 24.0% rate — not tax advice; consult a CPA.
Schools (NCES district)
- District
- Indianapolis Public Schools
- NCES district ID
- 1804770
- Math proficiency
- 14% ▼ -7.00%
- Reading proficiency
- 20% ▼ -3.00%
- Median HH income
- $32,034
- Composite
- 13.69/100
- National rank
- #9499
- State rank
- #286 of 301 in IN
Livability — Indianapolis city (balance)
No livability data for this city. (Only ~50 U.S. cities are tracked.)
Census & demographics
- Census place
- Indianapolis city (balance), IN
- County
- Marion County · 998,460 people
- City population
- 881,119
- Metro
- Indianapolis-Carmel-Anderson, IN
- Population (ZIP)
- 28,259
- Household income
- $72,417
- Rent vs Own
- Severe rent burden
- 1149.0
Population outlook (Marion County) Hauer SSP2
- Today (2025)
- 1,025,572 people
- By 2030
- 1,065,727 · +3.9%
- By 2040
- 1,141,577 · +11.3%
- By 2050
- 1,208,920 · +17.9%
- By 2075
- 1,367,288 · +33.3%
- By 2100
- 1,438,201 · +40.2%
Race, ethnicity, and origin ACS 2023
- Neighborhood character
- Diverse neighborhood (Simpson 0.64)
- Race & ethnicity
- White 50% Black 32% Two or more races 10% Hispanic / Latino 7% Asian 3%
- Hispanic origin (detail)
- Mexican 4%
- Common ancestry
- Italian 3% Slovak 2% Romanian 2%
- Foreign-born
- 5% · Canada
- Languages at home
- 89% English-only · Spanish 6% Other Indo-European 2% German/W. Germanic 1%
Political lean MEDSL · Marion
- 2024 margin
- Strong D (+27.7) · D 63.0% · R 35.3% · Other 1.7%
- 2008→2024 swing
- -0.7pp no change · 2008: 28.4pp · 2024: 27.7pp
- All cycles
- 2024: D+27.7 2020: D+29.1 2016: D+22.8 2012: D+22.2 2008: D+28.4
Not yet ingested
- Civics
- —
Market trends
- HPI YoY
- ▼ -322.77%
- Current HPI
- 380.5407
- Rent YoY
- ▲ 6.21%
- Metro
- Indianapolis-Carmel-Anderson, IN
- State GDP YoY
- ▲ 2.90%
- F500 in state
- 18
Industry mix (Fortune 500 HQ in IN)
| Industry | F500 HQs | Revenue |
|---|---|---|
| Industrial Machinery | 2 | $37B |
|
||
| Healthcare | 1 | $177B |
|
||
| Pharmaceuticals | 1 | $45B |
|
||
| Metals / Steel | 1 | $18B |
|
||
| Agriculture | 1 | $17B |
|
||
| Packaging | 1 | $12B |
|
||
Price history
+401.3% since first listed21 events — show timeline
- 2026-05-22 Pending — MIBOR as Distributed by MLS Grid
- 2026-05-21 Listing Removed — MIBOR as Distributed by MLS Grid
- 2026-05-21 Listing Removed — MIBOR as Distributed by MLS Grid
- 2026-05-20 Listed $200,000 MIBOR as Distributed by MLS Grid
- 2026-05-12 Listed $725,000 MIBOR as Distributed by MLS Grid
- 2026-05-07 Listed $725,000 MIBOR as Distributed by MLS Grid
- 2026-01-31 Listing Removed — MIBOR as Distributed by MLS Grid
- 2026-01-31 Listing Removed — MIBOR as Distributed by MLS Grid
- 2025-12-11 Listed $825,000 MIBOR as Distributed by MLS Grid
- 2025-12-11 Listed $825,000 MIBOR as Distributed by MLS Grid
- 2008-08-22 Sold (MLS) $19,900 MIBOR as Distributed by MLS Grid
- 2008-07-22 Listed $19,900 MIBOR as Distributed by MLS Grid
- 2007-12-03 Listing Removed — MIBOR as Distributed by MLS Grid
- 2007-03-27 Listed $114,500 MIBOR as Distributed by MLS Grid
- 2006-10-19 Listing Removed — MIBOR as Distributed by MLS Grid
- 2006-05-21 Listed $114,500 MIBOR as Distributed by MLS Grid
- 2004-03-04 Sold (Public Records) $100,000 Public Records
- 2001-12-20 Sold (MLS) $30,500 MIBOR as Distributed by MLS Grid
- 2001-11-30 Listing Removed — MIBOR as Distributed by MLS Grid
- 2001-11-08 Listed $32,000 MIBOR as Distributed by MLS Grid
- 2001-05-23 Listed $39,900 MIBOR as Distributed by MLS Grid
Property tax history
+13.2%/yrLatest (2025): $6,202 · +21.7% YoY. Source: county tax records.
Cash-flow waterfall
monthlySold comps — $/sqft
last 12 mo · ≤1 miLoading sold comps…