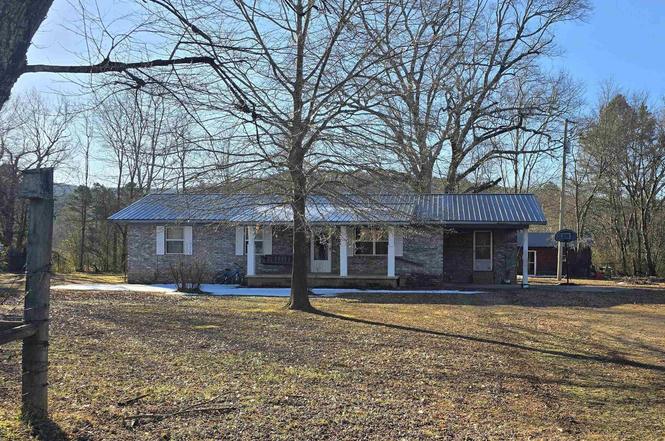
23893 E Hwy 80 · Waldron, AR
Flood risk 1/10 · Minimal
- FEMA flood zone
- —
- Chance of flooding over 30 yrs
- 0.0%
- Est. flood insurance / yr
- —
Fire risk 5/10 · Moderate
- Est. fire insurance / yr
- $1,499 – $2,785
Heat risk 6/10 · Moderate
- Hot days now (above 112°F)
- 7 days/yr
- Hot days in 30 yrs
- 21 days/yr
Wind risk 2/10 · Minimal
- Chance of severe wind over 30 yrs
- 2.0%
Air-quality risk 1/10 · Minimal
- Unhealthy air days now
- 0 days/yr
- Unhealthy air days in 30 yrs
- 0 days/yr
Risk factors via First Street. Map © Google.
Why this score? — see what drove the C grade
The composite is a weighted blend of 9 inputs, each scored 0–100. Each bar is that input's sub-score; the figure is the points it added to the 100-point composite (weight × sub-score).
- Cash flow +20.5/30.0
- ARV discount +7.5/15.0
- DSCR +6.5/10.0
- Appreciation +6.2/10.0
- 1% rule +5.4/10.0
- Livability +3.6/5.0
- Rent growth +2.5/5.0
- Condition / age +2.5/5.0
- Schools +2.4/10.0
$105,000
🖨 Deal sheet 📄 Offer letter ✓ Due diligence
Listing remarks
Escape the hustle and bustle with this charming 3-bedroom, 1-bathroom home nestled in a serene country setting. Located approximately 16 miles from Harps Food Stores in Waldron, this property offers the perfect balance of rural privacy and accessible convenience. Inside, you’ll find a functional layout featuring a dedicated laundry room and fresh, new carpet in several areas of the home, providing a clean and cozy feel. Outside, the property is designed for utility and relaxation: convenient attached carport to keep your vehicle out of the elements; Two spacious outbuildings in the back, ideal for tools, hobbies, or seasonal gear; One storage building is equipped with electrical powe
Key facts
- Attached carport
- 1 acre lot
- Parking
Tags
Property features AI
Finance
- Financial info: Financing options: conventional loan or cash
Exterior
- Parking: Carport for 1 car
- Utilities: Public water; Well; Septic; Propane/butane gas
- Home design: Single-story property
- Construction: Crawl space foundation
- Exterior features: Brick exterior; Metal roof; Road access: dirt and paved; Level lot; Approximately 1 acre; Irregular lot shape
Interior
- Kitchen: Built-in stove
- Flooring: Carpet; Vinyl
- Bathrooms: 1 full bathroom
- Heating & cooling: Window air units; Floor/wall furnace
- Interior features: Washer connection; Laundry room
- Laundry & utility: Washer connection
Neighborhood map
What this means for you Summary
Snapshot
- This is a 3-bed/1.0-bath single-family listed at $105k.
Deal economics
- At list price, monthly cash flow is $138 ($2k/yr) — positive.
- The deal already cash-flows at list — no discount required.
- Meets the 1% rule at list price ($1k rent vs $105k).
- Recommended offer: $99k (6.0% below list) — sets the bar for market timing.
Location & tenants
- Location reads 71/100 on livability (#42 in AR) — a middle-class / working-renter tenant base. Strengths: cost of living A+, housing A+, health & safety A+; Watch: crime C-, schools F, amenities F.
- Waldron School District (rural): math 29% / reading 30% proficiency, ranked #160 of 238 in AR (top 67%) — low school quality limits family demand, transient renter base, plan for 1-2y turnover; 62% free/reduced lunch — lower-income household profile, screen leases tightly.
- Market conditions: 59 active listings in the ZIP.
Forward outlook
- In year one you build about $3k of equity ($726 loan paydown + $3k appreciation (2.5% local appreciation)).
- Scott County population projected at -42% by 2050 — secular population decline; favor cash flow + early exit over multi-decade hold.
- At projected returns (2.5% appreciation + 3.0% rent growth), your $29k cash investment doubles in ~6 years — after that, you're playing with house money.
- By year 10, paydown + projected appreciation supports a ~$32k cash-out refi (75% LTV) — recoverable capital for the next deal without selling this one.
Negotiation context
- It's been on market 72 days — a 6% lower offer ($99k) is reasonable based on typical stale-listing flexibility.
Risks & watch-outs
- Climate carrying-cost: moderate wildfire risk; extreme-heat days projected 7→21/yr by 2055 (HVAC capex compounding) — expect insurance premiums to compound above CPI over the hold.
Questions for the listing agent
- It's been on market 72 days. Have you received any prior offers? Is the seller open to a 6% concession, seller financing, or rate buy-down credit?
- Why hasn't it sold? Are there any deal-killer items the seller is aware of (foundation, flood, title, zoning, code violations)?
- Is there a deadline driving the sale (1031 exchange, divorce, estate, relocation)? That informs how much negotiation room exists.
- Schools are F-rated, which usually means shorter tenancies and higher turnover. Who's the typical renter profile here, and what's been the actual vacancy rate?
- What's the average days-on-market for RENTAL listings here right now (not sales)? A rising rental-DOM trend means longer vacancies and softer asking-rent achievability than the comps imply.
- What's the recent tenant-quality profile in this submarket — average credit score on applications, eviction rate, late-payment / NSF rate, and stable-employment percentage? A property-management company in the area should have these aggregated.
- How much new for-sale + rental construction is in the pipeline within 1–3 miles? Heavy new supply typically softens prices + rents 12–24 months out; constrained supply supports both.
Investment metrics
- 1% rule
- 1.04% ✓
- Cap rate
- 7.87%
- Cash-on-cash
- 5.64%
- DSCR
- 1.25
- GRM
- 8.0
CMA / ARV
No comps found within radius.
Projected returns pro-forma
2.48% appreciation · 3.0% rent growth · sell at horizon
- IRR
- 11.4%
- Equity multiple
- 1.63×
- Total profit
- $18,609
- Equity at exit
- $44,171
- IRR
- 13.9%
- Equity multiple
- 2.96×
- Total profit
- $57,581
- Equity at exit
- $65,796
Cash invested: $29,400 (down + closing). Projections, not guarantees.
Landlord ↔ Tenant lean methodology
- Overall (STATE)
- 92 Strongly Landlord-Friendly
- State Arkansas
- 92 Strongly Landlord-Friendly · R+14
- County
- — inherits STATE
- City
- — inherits STATE
ZIP-level market 72958
- Home prices YoY
- 1.2%
- Active inventory
- 59
- Price-to-rent
- 8.0×
Monthly cashflow live
- Estimated rent
- $1,093 medium interval (Pro) →
- Mortgage (P&I)
- −$551
- Tax est. 1.5%
- −$131 /mo · $1,575/yr
- Insurance
- −$44
- HOA
- −$0
- Vacancy / Maint / Mgmt
- −$230
- Net cashflow
- $138
Break-even live
UW: 25.0% down · 7.5% · 30yr · 1.5% tax · 5.0% vac · 8.0% maint · 8.0% mgmt
Financing live
Cash to close
- Down payment
- $26,250
- Closing costs
- $3,150
- Reserves months
- —
- Total cash needed
- —
Loan-product check · same deal, 3 products live
Conventional
25% down · 7.5% · 30yr
- Down + closing
- —
- Monthly P&I
- —
- Monthly cashflow
- —
- DSCR
- —
- Eligible?
- —
Personal DTI + credit; lowest rate.
DSCR
20% down · 8.5% · 30yr
- Down + closing
- —
- Monthly P&I
- —
- Monthly cashflow
- —
- DSCR
- —
- Eligible?
- —
No personal income docs; deal must DSCR.
Hard money
10% down · 12.0% · 12mo
- Down + closing
- —
- Monthly P&I
- —
- Monthly cashflow
- —
- DSCR
- —
- Eligible?
- —
Short-term bridge; refi at stabilization.
Listing history 4 events
-
2026-04-19status Under Contract
-
2026-04-11price $105,000
-
2026-02-24price $126,000
-
2026-02-06$136,000 New Listing
ⓘ Source: listings_history table (triggers on properties + properties_extension) + one-shot
backfill from property_details.listing_events for pre-trigger history.
Climate risk First Street
- Flood 1/10 Low 0% chance over 30 yrs
- Wildfire 5/10 Major
- Heat 6/10 Major 7 d/yr ≥112°F today · 21 d/yr by 30 yrs out
- Wind 2/10 Low 2% chance of damaging wind over 30 yrs
- Air quality 1/10 Low 0 unhealthy d/yr today · 0 by 30 yrs out
Nearby sold comps map
Loading sold comps map…
Walkable amenities ~0.75 mi
Loading nearby amenities…
Taxation est. · year 1
- Rental income
- $13,122
- − Mortgage interest
- −$5,882
- − Property taxes
- −$1,575
- − Insurance
- −$525
- − Repairs & maintenance
- −$1,050
- − Management
- −$1,050
- − Depreciation
- −$3,055
- Taxable loss
- −$14
- Est. tax savings @ 24.0%
- +$3
- After-tax cash flow
- $1,662/yr
For passive investors: Depreciation is non-cash, so a rental often shows a tax loss while cash-flowing — sheltering income. Rental losses are passive: they offset passive income freely, and up to $25,000/yr can offset ordinary (W-2) income if you actively participate and your MAGI is under $100k (phasing out to $0 by $150k); unused losses carry forward. On sale, claimed depreciation is recaptured at up to 25%, and gains may owe capital-gains tax (a 1031 exchange can defer both). Figures are a year-1 estimate at your 24.0% rate — not tax advice; consult a CPA.
Schools (NCES district)
- District
- Waldron School District
- NCES district ID
- 0513680
- Math proficiency
- 29% ▼ -14.00%
- Reading proficiency
- 30% ▼ -14.00%
- Median HH income
- $34,712
- Composite
- 24.33/100
- National rank
- #7699
- State rank
- #160 of 238 in AR
Livability — Waldron
- Score
- 71/100
- State rank
- #42
- US rank
- #7095
Category grades
Schools grade is shown separately in the Schools card above.
Census & demographics
- Population (ZIP)
- 6,566
Population outlook (Scott County) Hauer SSP2
- Today (2025)
- 8,981 people
- By 2030
- 8,188 · -8.8%
- By 2040
- 6,675 · -25.7%
- By 2050
- 5,228 · -41.8%
- By 2075
- 2,745 · -69.4%
- By 2100
- 1,302 · -85.5%
Race, ethnicity, and origin ACS 2023
- Neighborhood character
- Predominantly White (81%)
- Race & ethnicity
- White 81% Hispanic / Latino 11% Two or more races 8% Asian 1%
- Hispanic origin (detail)
- Mexican 11%
- Common ancestry
- Italian 1% Slovak 1% Iranian 1%
- Foreign-born
- 4% · Canada, Philippines
- Languages at home
- 91% English-only · Spanish 7% Other Asian/Pacific 1%
Political lean MEDSL · Scott
- 2024 margin
- Solid R (+73.5) · D 12.6% · R 86.1% · Other 1.4%
- 2008→2024 swing
- -30.0pp toward R · 2008: -43.5pp · 2024: -73.5pp
- All cycles
- 2024: R+73.5 2020: R+69.8 2016: R+62.0 2012: R+47.7 2008: R+43.5
Not yet ingested
- Civics
- —
Market trends
- HPI YoY
- ▲ 2.48%
- Current HPI
- 209.0849
- Rent YoY
- —
- Metro
- —
- State GDP YoY
- ▲ 3.80%
- F500 in state
- 10
Industry mix (Fortune 500 HQ in AR)
| Industry | F500 HQs | Revenue |
|---|---|---|
| Retail | 1 | $681B |
|
||
| Food / Agriculture | 1 | $53B |
|
||
| Retail / Energy | 1 | $22B |
|
||
| Transportation / Logistics | 1 | $12B |
|
||
| Energy | 1 | $4B |
|
||
Price history
-22.8% since first listed4 events — show timeline
- 2026-04-19 Pending — CARMLS
- 2026-04-11 Price Changed $105,000 CARMLS
- 2026-02-24 Price Changed $126,000 CARMLS
- 2026-02-06 Listed $136,000 CARMLS
Cash-flow waterfall
monthlySold comps — $/sqft
last 12 mo · ≤1 miLoading sold comps…