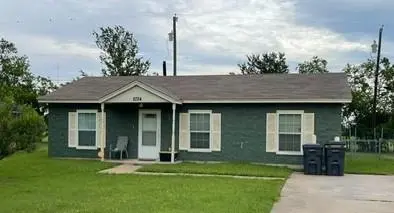
2722 Mildred St · Waco, TX
Flood risk 1/10 · Minimal
- FEMA flood zone
- X (unshaded)
- Chance of flooding over 30 yrs
- 0.0%
- Est. flood insurance / yr
- $507 – $1,088
Fire risk 2/10 · Minimal
- Est. fire insurance / yr
- $1,222 – $2,270
Heat risk 8/10 · Major
- Hot days now (above 109°F)
- 7 days/yr
- Hot days in 30 yrs
- 24 days/yr
Wind risk 6/10 · Moderate
- Chance of severe wind over 30 yrs
- 66.0%
Air-quality risk 1/10 · Minimal
- Unhealthy air days now
- 0 days/yr
- Unhealthy air days in 30 yrs
- 0 days/yr
Risk factors via First Street. Map © Google.
Why this score? — see what drove the C- grade
The composite is a weighted blend of 9 inputs, each scored 0–100. Each bar is that input's sub-score; the figure is the points it added to the 100-point composite (weight × sub-score).
- Cash flow +17.8/30.0
- ARV discount +15.0/15.0
- DSCR +5.6/10.0
- 1% rule +5.4/10.0
- Livability +3.7/5.0
- Rent growth +3.0/5.0
- Condition / age +2.5/5.0
- Schools +1.8/10.0
- Appreciation +0.0/10.0
$150,000
🖨 Deal sheet 📄 Offer letter ✓ Due diligence
Listing remarks
All 3 properties (2722 Mildred, 2726 Mildred, 2730 Mildred) to be sold together. MLS #'s: 21287460, 21288472, and 21288555. Each current tenant shall reserve the right to remain in the property at current lease rates for 90 days from the executed date of Buyer's contract. Many windows have been replaced with vinyl windows. Roof has been updated since construction date.
Key facts
- Vinyl windows
- Updated roof
- 7,562 sq ft lot
Tags
Property features AI
Finance
- Other: Property listed as residential income with one building and one total unit; 100% occupancy rate; Parcel and public-record building area available
- Financial info: Month-to-month tenancy; Gross annual income reported; Gross annual expenses reported; Insurance expense reported; Listing accepts cash and conventional offers
- HOA & community: No association
Exterior
- Parking: Driveway parking for 1 vehicle
- Utilities: City sewer; No municipal utility district
- Home design: Residential income, multi-family property; Single-story; Built in 1996
- Construction: Stone veneer exterior; Composition roof; Slab foundation
- Exterior features: Driveway; Lot in the Coronado subdivision; Lot under 0.5 acre
Interior
- Kitchen: Electric oven
- Bedrooms: 4 bedrooms
- Flooring: Vinyl flooring
- Bathrooms: 1 full bathroom
- Heating & cooling: Central heating; Central air; Ceiling fan(s)
- Interior features: One-level layout; Other interior features
Neighborhood map
What this means for you Summary
Snapshot
- This is a 3-bed/1.0-bath single-family listed at $150k.
Deal economics
- At list price, monthly cash flow is $123 ($1k/yr) — positive.
- The deal already cash-flows at list — no discount required.
- Meets the 1% rule at list price ($2k rent vs $150k).
- Cap rate 7.3% vs local median 3.9% in Waco — top-decile yield for the area; either an underpriced asset or a hidden risk that comps aren't pricing in. Stress-test before assuming the spread holds.
Location & tenants
- Location reads 74/100 on livability (#166 in TX, #4,378 nationally) — a middle-class / working-renter tenant base. Strengths: cost of living A+, housing A+, health & safety A+; Watch: crime D, commute F, employment D-.
- Waco ISD (urban): math 20% / reading 24% proficiency, ranked #773 of 826 in TX (top 94%) — low school quality limits family demand, transient renter base, plan for 1-2y turnover; 81% free/reduced lunch — lower-income household profile, screen leases tightly.
- Zoned schools: South Waco El (math 8% / reading 22%, grade F, #4,021 of 4,322 statewide, top 94%, 462 students, 96% FRL).
- Market conditions: Rents rising (+1.9%/yr); 317 active listings in the ZIP; 40 comparable units currently listed for rent nearby; rentals at typical pace (median 21d on market — plan ~3-4 weeks tenant-placement turnaround); lower-income renter base — watch delinquency; 1,014 units permitted in McLennan County in 2024 (200 in 5+ unit buildings).
- At $1,565/mo this rent would consume 45% of the median local household income ($42k/yr) (locally 3883% of renters already pay >50% of income on rent) — very limited rent-growth headroom before tenants either downsize or default.
Forward outlook
- Local home prices are declining (-3.0%/yr); year-one equity from $1k of loan paydown is wiped out by about $4k of value loss. Plan a longer hold.
- McLennan County population projected at +17% by 2050 — long-run rental-demand tailwind backs the buy-and-hold thesis.
Negotiation context
- Only 13 days on market — expect competitive offers; lowballing is unlikely to land.
Risks & watch-outs
- Climate carrying-cost: major wind risk, 66% chance of damaging wind over 30y; extreme-heat days projected 7→24/yr by 2055 (HVAC capex compounding) — expect insurance premiums to compound above CPI over the hold.
Questions for the listing agent
- Is there a deadline driving the sale (1031 exchange, divorce, estate, relocation)? That informs how much negotiation room exists.
- Schools are D-rated, which usually means shorter tenancies and higher turnover. Who's the typical renter profile here, and what's been the actual vacancy rate?
- Crime grade is D in this area — have there been break-ins, vandalism, or insurance claims at this property in the last 3 years? What carrier currently insures it and at what premium?
- What's the average days-on-market for RENTAL listings here right now (not sales)? A rising rental-DOM trend means longer vacancies and softer asking-rent achievability than the comps imply.
- What's the recent tenant-quality profile in this submarket — average credit score on applications, eviction rate, late-payment / NSF rate, and stable-employment percentage? A property-management company in the area should have these aggregated.
- How much new for-sale + rental construction is in the pipeline within 1–3 miles? Heavy new supply typically softens prices + rents 12–24 months out; constrained supply supports both.
Investment metrics
- 1% rule
- 1.04% ✓
- Cap rate
- 7.28%
- Cash-on-cash
- 3.53%
- DSCR
- 1.16
- GRM
- 8.0
CMA / ARV
- ARV (on-the-fly)
- $187,200
- Comps found
- 8
Show comp detail 8 sales within ~0.75 mi
| Address | Dist | Beds/Ba | Sqft | Sold | Price | $/sf | Match |
|---|---|---|---|---|---|---|---|
| 2709 Sarah St | 0.10mi | 3/1.0 | 1,156 (+11%) | 8mo | $169,995 | $147 | 70 |
| 2724 S 27th St | 0.50mi | 3/1.5 | 1,006 (-3%) | 13mo | $189,900 | $189 | 58 |
| 1699 Ewing St | 0.20mi | 3/2.0 | 1,139 (+10%) | 19mo | $239,900 | $211 | 54 |
| 2431 S 26th St | 0.55mi | 3/1.0 | 1,161 (+12%) | 6mo | $168,000 | $145 | 50 |
| 2712 S 27th St | 0.50mi | 2/1.5 (-1) | 1,016 (-2%) | 24mo | $95,000 | $94 | 46 |
| 2519 S 24th St | 0.41mi | 3/1.0 | 926 (-11%) | 21mo | $155,000 | $167 | 45 |
| 2707 S 27th St | 0.53mi | 3/2.0 | 1,151 (+11%) | 13mo | $209,500 | $182 | 43 |
| 1009 Church Ave | 0.68mi | 3/2.0 | 1,196 (+15%) | 24mo | $215,000 | $180 | 19 |
Match score weights: distance 35% · size 25% · config 20% · recency 20%. Top-matched comps best support the ARV.
Projected returns pro-forma
-3.0% appreciation · 1.86% rent growth · sell at horizon
- IRR
- -12.1%
- Equity multiple
- 0.57×
- Total profit
- $-18,150
- Equity at exit
- $22,365
- IRR
- -4.8%
- Equity multiple
- 0.70×
- Total profit
- $-12,515
- Equity at exit
- $12,969
Cash invested: $42,000 (down + closing). Projections, not guarantees.
Landlord ↔ Tenant lean methodology
- Overall (STATE)
- 87 Strongly Landlord-Friendly
- State Texas
- 87 Strongly Landlord-Friendly · R+5
- County
- — inherits STATE
- City
- — inherits STATE
ZIP-level market 76706
- Home prices YoY
- -29.1%
- Rents YoY
- 1.9%
- Active inventory
- 317
- Price-to-rent
- 8.0×
Monthly cashflow live
- Estimated rent
- $1,565 high interval (Pro) →
- Mortgage (P&I)
- −$787
- Tax from tax record
- −$264 /mo · $3,166/yr
- Insurance
- −$62
- HOA
- −$0
- Vacancy / Maint / Mgmt
- −$329
- Net cashflow
- $123
Break-even live
UW: 25.0% down · 7.5% · 30yr · 1.5% tax · 5.0% vac · 8.0% maint · 8.0% mgmt
Financing live
Cash to close
- Down payment
- $37,500
- Closing costs
- $4,500
- Reserves months
- —
- Total cash needed
- —
Loan-product check · same deal, 3 products live
Conventional
25% down · 7.5% · 30yr
- Down + closing
- —
- Monthly P&I
- —
- Monthly cashflow
- —
- DSCR
- —
- Eligible?
- —
Personal DTI + credit; lowest rate.
DSCR
20% down · 8.5% · 30yr
- Down + closing
- —
- Monthly P&I
- —
- Monthly cashflow
- —
- DSCR
- —
- Eligible?
- —
No personal income docs; deal must DSCR.
Hard money
10% down · 12.0% · 12mo
- Down + closing
- —
- Monthly P&I
- —
- Monthly cashflow
- —
- DSCR
- —
- Eligible?
- —
Short-term bridge; refi at stabilization.
Rent comps 40 comps
| Address | Beds | Baths | Sqft | Rent | $/sqft | DOM | Units | Dist |
|---|---|---|---|---|---|---|---|---|
| 1628 Ewing Ave Waco, TX | 3.0 | 2.0 | 1472 | $2,400 | $1.63 | 13d | 1 | 0.20mi |
| 1800 Primrose Dr Waco, TX | 1.0–4.0 | 1.0–2.0 | 942 | $1,133 | $1.20 | 13d | 33 | 0.27mi |
| 1912 S 15th St Unit A Waco, TX | 4.0 | 2.0 | 1400 | $1,850 | $1.32 | 21d | 1 | 0.81mi |
| 1905 S 14th St Waco, TX | 4.0 | 4.0 | 1500 | $3,000 | $2.00 | 21d | 1 | 0.83mi |
| 1905 S 14th St Unit B Waco, TX | 4.0 | 4.0 | 1200 | $550 | $0.46 | 21d | 1 | 0.83mi |
| 3411 Pewitt Dr #3413 Waco, TX | 2.0 | 1.0 | 1000 | $1,350 | $1.35 | 21d | 1 | 1.06mi |
| 2005 S 8th St Waco, TX | 1.0–2.0 | 1.0–2.0 | 685 | $1,000 | $1.46 | 13d | 2 | 1.07mi |
| 1911 S 8th St Waco, TX | 2.0 | 1.0 | 798 | $1,198 | $1.50 | 21d | 1 | 1.10mi |
| 2011 S 7th St Unit 6B Waco, TX | 3.0 | 3.0 | 1478 | $2,150 | $1.45 | 43d | 1 | 1.10mi |
| 2011 S 7th St Waco, TX | 3.0 | 3.0 | 1484 | $1,800 | $1.21 | 21d | 1 | 1.11mi |
| 1311 Speight Ave #1311 Waco, TX | 2.0 | 2.5 | 1143 | $1,500 | $1.31 | 21d | 1 | 1.11mi |
| 1311 Speight Ave Waco, TX | 2.0 | 2.5 | 1143 | $1,195 | $1.05 | 13d | 1 | 1.11mi |
| 1342 Park Ave Waco, TX | 2.0 | 2.5 | 1143 | $1,400 | $1.22 | 13d | 1 | 1.13mi |
| 3200 Belmont Dr Unit 3228 Waco, TX | 2.0 | 2.0 | 995 | $1,500 | $1.51 | 13d | 1 | 1.13mi |
| 3430 Pewitt Dr Waco, TX | 2.0 | 1.0 | 916 | $1,150 | $1.26 | 43d | 1 | 1.13mi |
| 1918 S 8th St Waco, TX | 3.0 | 2.0 | 1061 | $1,200 | $1.13 | 21d | 1 | 1.14mi |
| 3447 Pewitt Dr Waco, TX | 2.0 | 1.0 | 907 | $1,350 | $1.49 | 13d | 1 | 1.14mi |
| 1326 Park Ave Waco, TX | 2.0 | 2.5 | 1143 | $1,400 | $1.22 | 21d | 1 | 1.14mi |
| 1326 Park Ave Waco, TX | 2.0 | 2.5 | 1143 | $1,400 | $1.22 | 13d | 1 | 1.14mi |
| 1508 S 13th St Waco, TX | 1.0–2.0 | 1.0 | 775 | $895 | $1.15 | 13d | 1 | 1.16mi |
| 2539 Pascal Ct Unit B Waco, TX | 3.0 | 3.5 | 1350 | $1,950 | $1.44 | 21d | 1 | 1.17mi |
| 1421 S 12th St Waco, TX | 2.0 | 2.0 | 928 | $985 | $1.06 | 13d | 3 | 1.18mi |
| 1226 Baylor Ave Waco, TX | 2.0 | 2.0–2.5 | 1024 | $1,337 | $1.31 | 13d | 2 | 1.21mi |
| 1226 Baylor Ave Waco, TX | 2.0 | 2.0–2.5 | 1024 | $1,350 | $1.32 | 21d | 2 | 1.21mi |
| 1214 Baylor Ave Waco, TX | 1.0–2.0 | 1.0–2.0 | 736 | $1,095 | $1.49 | 43d | 2 | 1.22mi |
| 1214 Baylor Ave Waco, TX | 1.0–2.0 | 1.0–2.0 | 832 | $945 | $1.14 | 13d | 2 | 1.22mi |
| 1214 Baylor Ave Waco, TX | 2.0 | 2.0 | 832 | $1,020 | $1.23 | 21d | 1 | 1.22mi |
| 224 Gurley Ln Waco, TX | 2.0 | 1.0 | 700 | $1,025 | $1.46 | 21d | 1 | 1.26mi |
| 600 Bagby Ave Waco, TX | 2.0 | 2.0–2.5 | 1102 | $1,496 | $1.36 | 21d | 2 | 1.27mi |
| 600 Bagby Ave Waco, TX | 2.0–3.0 | 2.5 | 1206 | $1,795 | $1.49 | 43d | 3 | 1.27mi |
| 1348 S 12th St Waco, TX | 2.0 | 2.0 | 958 | $1,300 | $1.36 | 21d | 1 | 1.28mi |
| 2021 Gurley Ave Waco, TX | 3.0 | 2.0 | 1320 | $1,500 | $1.14 | 21d | 1 | 1.30mi |
| 2308 S 3rd St Unit B Waco, TX | 2.0 | 2.0 | 1130 | $1,350 | $1.19 | 13d | 1 | 1.30mi |
| 1800 S 5th St Waco, TX | 2.0 | 2.0 | 900 | $1,240 | $1.38 | 21d | 1 | 1.32mi |
| 412 University St Waco, TX | 2.0 | 1.0 | 864 | $1,895 | $2.19 | 21d | 1 | 1.35mi |
| 1300 S 11th St Waco, TX | 2.0 | 2.5 | 1083 | $1,209 | $1.12 | 13d | 14 | 1.35mi |
| 3319 Wingate Dr Waco, TX | 2.0 | 1.0 | 768 | $950 | $1.24 | 21d | 1 | 1.35mi |
| 1901 Dutton Ave Waco, TX | 2.0 | 1.0 | 864 | $1,400 | $1.62 | 13d | 1 | 1.36mi |
| 2430 S 2nd St Waco, TX | 1.0–5.0 | 1.0–5.5 | 1400 | $1,625 | $1.16 | 13d | 1 | 1.39mi |
| 2410 S 2nd St Waco, TX | 2.0–5.0 | 2.0–5.5 | 1552 | $2,008 | $1.29 | 21d | 4 | 1.40mi |
Listing history 11 events
-
2026-06-18days on market $150,000 Active 13 DOM
-
2026-06-17days on market $150,000 Active 12 DOM
-
2026-06-16days on market $150,000 Active 11 DOM
-
2026-06-15days on market $150,000 Active 10 DOM
-
2026-06-14days on market $150,000 Active 8 DOM
-
2026-06-13days on market $150,000 Active 7 DOM
-
2026-06-10days on market $150,000 Active 5 DOM
-
2026-06-09days on market $150,000 Active 4 DOM
-
2026-06-08days on market $150,000 Active 3 DOM
-
2026-06-07remarks 372-char remark
-
2026-06-07$150,000 Active 2 DOM
ⓘ Source: listings_history table (triggers on properties + properties_extension) + one-shot
backfill from property_details.listing_events for pre-trigger history.
Tax reassessment forecast TX · Resets to sale price
- Current annual tax
- $3,166 · $264/mo
- Projected year-2 tax
- $3,166 · $264/mo
- Expected delta
- $0/yr ($0/mo · 0.0%)
ⓘ Screening estimate from a state-policy table — verify with the county assessor before closing.
Climate risk First Street
- Flood 1/10 Low FEMA zone X (unshaded) · 0% chance over 30 yrs
- Wildfire 2/10 Low
- Heat 8/10 Severe 7 d/yr ≥109°F today · 24 d/yr by 30 yrs out
- Wind 6/10 Major 66% chance of damaging wind over 30 yrs
- Air quality 1/10 Low 0 unhealthy d/yr today · 0 by 30 yrs out
Nearby sold comps map
Loading sold comps map…
Walkable amenities ~0.75 mi
Loading nearby amenities…
Taxation est. · year 1
- Rental income
- $18,780
- − Mortgage interest
- −$8,402
- − Property taxes
- −$3,166
- − Insurance
- −$750
- − Repairs & maintenance
- −$1,502
- − Management
- −$1,502
- − Depreciation
- −$4,364
- Taxable loss
- −$907
- Est. tax savings @ 24.0%
- +$218
- After-tax cash flow
- $1,699/yr
For passive investors: Depreciation is non-cash, so a rental often shows a tax loss while cash-flowing — sheltering income. Rental losses are passive: they offset passive income freely, and up to $25,000/yr can offset ordinary (W-2) income if you actively participate and your MAGI is under $100k (phasing out to $0 by $150k); unused losses carry forward. On sale, claimed depreciation is recaptured at up to 25%, and gains may owe capital-gains tax (a 1031 exchange can defer both). Figures are a year-1 estimate at your 24.0% rate — not tax advice; consult a CPA.
Schools (NCES district)
- District
- Waco ISD
- NCES district ID
- 4844280
- Math proficiency
- 20% ▼ -14.00%
- Reading proficiency
- 24% ▼ -6.00%
- Median HH income
- $29,208
- Composite
- 17.57/100
- National rank
- #9043
- State rank
- #773 of 826 in TX
Livability — Waco
- Score
- 74/100
- State rank
- #166
- US rank
- #4378
Category grades
Schools grade is shown separately in the Schools card above.
Census & demographics
- Census place
- Waco, TX
- County
- McLennan County · 213,088 people
- City population
- 125,319
- Metro
- Waco, TX
- Population (ZIP)
- 41,627
- Household income
- $41,656
- Rent vs Own
- Severe rent burden
- 3883.0
Population outlook (McLennan County) Hauer SSP2
- Today (2025)
- 264,191 people
- By 2030
- 273,578 · +3.6%
- By 2040
- 291,506 · +10.3%
- By 2050
- 308,044 · +16.6%
- By 2075
- 349,648 · +32.3%
- By 2100
- 364,779 · +38.1%
Race, ethnicity, and origin ACS 2023
- Neighborhood character
- Diverse neighborhood (Simpson 0.64)
- Race & ethnicity
- White 49% Hispanic / Latino 31% Two or more races 17% Black 15% Asian 3%
- Hispanic origin (detail)
- Mexican 29%
- Common ancestry
- Lithuanian 1% Iranian 1% Romanian 1%
- Foreign-born
- 9% · Canada, Vietnam, China
- Languages at home
- 78% English-only · Spanish 19% Other Indo-European 1%
Political lean MEDSL · McLennan
- 2024 margin
- Solid R (+30.9) · D 34.0% · R 64.9% · Other 1.0%
- 2008→2024 swing
- -7.0pp toward R · 2008: -23.9pp · 2024: -30.9pp
- All cycles
- 2024: R+30.9 2020: R+23.4 2016: R+27.1 2012: R+29.8 2008: R+23.9
Not yet ingested
- Civics
- —
Market trends
- HPI YoY
- ▼ -94.31%
- Current HPI
- 230.2557
- Rent YoY
- ▲ 1.86%
- Metro
- Waco, TX
- State GDP YoY
- ▲ 3.95%
- F500 in state
- 110
Industry mix (Fortune 500 HQ in TX)
| Industry | F500 HQs | Revenue |
|---|---|---|
| Energy | 16 | $1,198B |
|
||
| Technology | 5 | $198B |
|
||
| Engineering / Construction | 4 | $72B |
|
||
| Energy Services | 3 | $60B |
|
||
| Utilities | 3 | $41B |
|
||
| Healthcare | 2 | $330B |
|
||
Price history
2 events — show timeline
- 2026-06-05 Listed $150,000 NTREIS
- 1999-04-08 Sold (Public Records) — Public Records
Property tax history
+5.6%/yrLatest (2025): $3,166 · +1.6% YoY. Source: county tax records.
Cash-flow waterfall
monthlySold comps — $/sqft
last 12 mo · ≤1 miLoading sold comps…