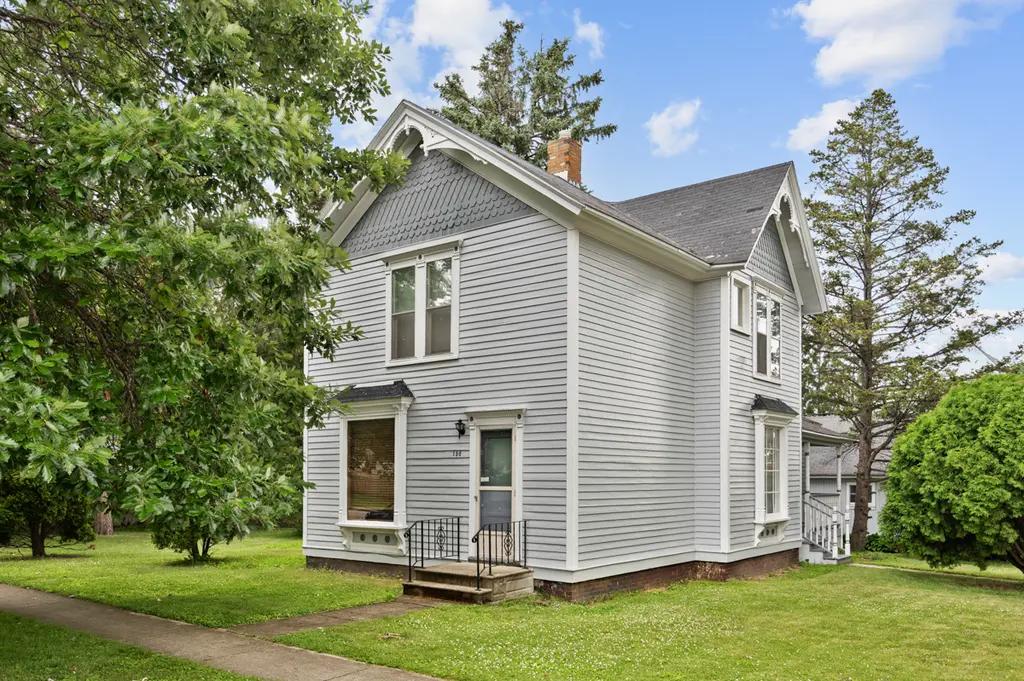
198 E Jefferson St · Hampshire, IL
Flood risk No data
- FEMA flood zone
- —
- Chance of flooding over 30 yrs
- %
- Est. flood insurance / yr
- —
Fire risk No data
- Est. fire insurance / yr
- —
Heat risk No data
- Hot days now (above °F)
- days/yr
- Hot days in 30 yrs
- days/yr
Wind risk No data
- Chance of severe wind over 30 yrs
- %
Air-quality risk No data
- Unhealthy air days now
- days/yr
- Unhealthy air days in 30 yrs
- days/yr
Risk factors via First Street. Map © Google.
Why this score? — see what drove the C+ grade
The composite is a weighted blend of 9 inputs, each scored 0–100. Each bar is that input's sub-score; the figure is the points it added to the 100-point composite (weight × sub-score).
- Cash flow +22.4/30.0
- ARV discount +15.0/15.0
- DSCR +7.2/10.0
- 1% rule +5.9/10.0
- Livability +3.6/5.0
- Rent growth +2.5/5.0
- Schools +2.5/10.0
- Condition / age +2.5/5.0
- Appreciation +0.0/10.0
$295,000
🖨 Deal sheet 📄 Offer letter ✓ Due diligence
Listing remarks
HISTORIC HOME IN THE HEART OF HAMPSHIRE * 4 BEDROOM * 2 BATH * LARGE CORNER LOT (. 24 acres) * HEATED 2 CAR GARAGE * AMAZING ORIGINAL TRIM THRU OUT HOME * ORIGINAL HARDWOOD FLOORING * SO MUCH CHARACTER- A MUST SEE!
Key facts
- 0.24 acre lot
- 2 garage spots
- Listed 3 days
Neighborhood map
What this means for you Summary
Snapshot
- This is a 4-bed/1.5-bath single-family listed at $295k.
Deal economics
- At list price, monthly cash flow is $491 ($6k/yr) — positive.
- The deal already cash-flows at list — no discount required.
- Meets the 1% rule at list price ($3k rent vs $295k).
- Cap rate 8.3% vs local median 4.6% in Hampshire — top-decile yield for the area; either an underpriced asset or a hidden risk that comps aren't pricing in. Stress-test before assuming the spread holds.
Location & tenants
- Location reads 71/100 on livability (#350 in IL) — a middle-class / working-renter tenant base. Strengths: crime A+, employment A+, housing A+; Watch: amenities F, commute F, health & safety F.
- CUSD 300 (suburban): math 24% / reading 27% proficiency, ranked #261 of 620 in IL (top 42%) — low school quality limits family demand, transient renter base, plan for 1-2y turnover.
- Market conditions: 254 active listings in the ZIP; 3 comparable units currently listed for rent nearby; rentals leasing fast (median 2d on market — plan ~1-2 weeks tenant-placement turnaround); high-income renter base; 1,944 units permitted in Kane County in 2024 (357 in 5+ unit buildings).
- This rent runs 35% of the median local income ($111k/yr) — at the standard rent-burdened threshold; future hikes will face affordability resistance.
Forward outlook
- Local home prices are declining (-3.0%/yr); year-one equity from $2k of loan paydown is wiped out by about $9k of value loss. Plan a longer hold.
Negotiation context
- Only 3 days on market — expect competitive offers; lowballing is unlikely to land.
Questions for the listing agent
- Is there a deadline driving the sale (1031 exchange, divorce, estate, relocation)? That informs how much negotiation room exists.
- What's the average days-on-market for RENTAL listings here right now (not sales)? A rising rental-DOM trend means longer vacancies and softer asking-rent achievability than the comps imply.
- What's the recent tenant-quality profile in this submarket — average credit score on applications, eviction rate, late-payment / NSF rate, and stable-employment percentage? A property-management company in the area should have these aggregated.
- How much new for-sale + rental construction is in the pipeline within 1–3 miles? Heavy new supply typically softens prices + rents 12–24 months out; constrained supply supports both.
Investment metrics
- 1% rule
- 1.09% ✓
- Cap rate
- 8.29%
- Cash-on-cash
- 7.14%
- DSCR
- 1.32
- GRM
- 7.7
CMA / ARV
- ARV (on-the-fly)
- $378,000
- Comps found
- 12
Show comp detail 12 sales within ~0.75 mi
| Address | Dist | Beds/Ba | Sqft | Sold | Price | $/sf | Match |
|---|---|---|---|---|---|---|---|
| 166 Grove Ave | 0.13mi | 4/1.5 | 1,745 (-3%) | 13mo | $250,000 | $143 | 78 |
| 426 Arbor Ridge Dr | 0.10mi | 3/2.5 (-1) | 1,818 (+1%) | 12mo | $405,990 | $223 | 75 |
| 438 Arbor Ridge Dr | 0.10mi | 3/2.5 (-1) | 1,818 (+1%) | 12mo | $403,990 | $222 | 74 |
| 171 Grove Ave | 0.16mi | 3/1.5 (-1) | 1,664 (-8%) | 14mo | $340,000 | $204 | 63 |
| 321 Jake Ln | 0.58mi | 3/2.5 (-1) | 1,762 (-2%) | 1mo | $460,000 | $261 | 59 |
| 432 Arbor Ridge Dr | 0.10mi | 4/2.5 | 2,051 (+14%) | 12mo | $424,990 | $207 | 58 |
| 445 Arbor Ridge Dr | 0.10mi | 4/2.5 | 2,051 (+14%) | 13mo | $429,990 | $210 | 57 |
| 439 Arbor Ridge Dr | 0.10mi | 4/2.5 | 2,051 (+14%) | 14mo | $419,990 | $205 | 56 |
| 244 Panama Ave | 0.27mi | 4/2.0 | 2,046 (+14%) | 8mo | $375,000 | $183 | 56 |
| 351 Campion Dr | 0.59mi | 3/2.0 (-1) | 1,660 (-8%) | 0mo | $501,000 | $302 | 52 |
| 350 Cardinal Way | 0.67mi | 4/2.5 | 1,910 (+6%) | 13mo | $385,000 | $202 | 44 |
| 521 Wild Prairie Pt | 0.72mi | 3/2.0 (-1) | 1,533 (-15%) | 13mo | $375,000 | $245 | 24 |
Match score weights: distance 35% · size 25% · config 20% · recency 20%. Top-matched comps best support the ARV.
Projected returns pro-forma
-3.0% appreciation · 3.0% rent growth · sell at horizon
- IRR
- -5.3%
- Equity multiple
- 0.80×
- Total profit
- $-16,457
- Equity at exit
- $43,985
- IRR
- 4.3%
- Equity multiple
- 1.32×
- Total profit
- $26,166
- Equity at exit
- $25,506
Cash invested: $82,600 (down + closing). Projections, not guarantees.
Landlord ↔ Tenant lean methodology
- Overall (STATE)
- 43 Moderately Tenant-Leaning
- State Illinois
- 43 Moderately Tenant-Leaning · D+7
- County
- — inherits STATE
- City
- — inherits STATE
ZIP-level market 60140
- Home prices YoY
- -24.6%
- Active inventory
- 254
- Price-to-rent
- 7.7×
Monthly cashflow live
- Estimated rent
- $3,203 medium interval (Pro) →
- Mortgage (P&I)
- −$1,547
- Tax est. 1.5%
- −$369 /mo · $4,425/yr
- Insurance
- −$123
- HOA
- −$0
- Vacancy / Maint / Mgmt
- −$673
- Net cashflow
- $491
Break-even live
UW: 25.0% down · 7.5% · 30yr · 1.5% tax · 5.0% vac · 8.0% maint · 8.0% mgmt
Financing live
Cash to close
- Down payment
- $73,750
- Closing costs
- $8,850
- Reserves months
- —
- Total cash needed
- —
Loan-product check · same deal, 3 products live
Conventional
25% down · 7.5% · 30yr
- Down + closing
- —
- Monthly P&I
- —
- Monthly cashflow
- —
- DSCR
- —
- Eligible?
- —
Personal DTI + credit; lowest rate.
DSCR
20% down · 8.5% · 30yr
- Down + closing
- —
- Monthly P&I
- —
- Monthly cashflow
- —
- DSCR
- —
- Eligible?
- —
No personal income docs; deal must DSCR.
Hard money
10% down · 12.0% · 12mo
- Down + closing
- —
- Monthly P&I
- —
- Monthly cashflow
- —
- DSCR
- —
- Eligible?
- —
Short-term bridge; refi at stabilization.
Rent comps 3 comps
| Address | Beds | Baths | Sqft | Rent | $/sqft | DOM | Units | Dist |
|---|---|---|---|---|---|---|---|---|
| 179 Terrabrook Way Hampshire, IL | 3.0–4.0 | 2.5 | 1828 | $3,000 | $1.64 | 1d | 1 | 0.54mi |
| 863 Briar Glen Ct Unit 863 Hampshire, IL | 3.0 | 2.5 | 1758 | $2,595 | $1.48 | 43d | 1 | 1.16mi |
| 1239 Da Vinci Dr Hampshire, IL | 3.0 | 2.5 | 1800 | $2,800 | $1.56 | 1d | 1 | 1.47mi |
Listing history 3 events
-
2026-06-18days on market $295,000 Active 3 DOM
-
2026-06-17remarks 228-char remark
-
2026-06-17$295,000 Active 2 DOM
ⓘ Source: listings_history table (triggers on properties + properties_extension) + one-shot
backfill from property_details.listing_events for pre-trigger history.
Nearby sold comps map
Loading sold comps map…
Walkable amenities ~0.75 mi
Loading nearby amenities…
Taxation est. · year 1
- Rental income
- $38,432
- − Mortgage interest
- −$16,525
- − Property taxes
- −$4,425
- − Insurance
- −$1,475
- − Repairs & maintenance
- −$3,075
- − Management
- −$3,075
- − Depreciation
- −$8,582
- Taxable income
- $1,276
- Est. tax owed @ 24.0%
- −$306
- After-tax cash flow
- $5,591/yr
For passive investors: Depreciation is non-cash, so a rental often shows a tax loss while cash-flowing — sheltering income. Rental losses are passive: they offset passive income freely, and up to $25,000/yr can offset ordinary (W-2) income if you actively participate and your MAGI is under $100k (phasing out to $0 by $150k); unused losses carry forward. On sale, claimed depreciation is recaptured at up to 25%, and gains may owe capital-gains tax (a 1031 exchange can defer both). Figures are a year-1 estimate at your 24.0% rate — not tax advice; consult a CPA.
Schools (NCES district)
- District
- CUSD 300
- NCES district ID
- 1708550
- Math proficiency
- 24% ▼ -12.00%
- Reading proficiency
- 27% ▼ -11.00%
- Median HH income
- $77,706
- Composite
- 25.12/100
- National rank
- #7524
- State rank
- #261 of 620 in IL
Livability — Hampshire
- Score
- 71/100
- State rank
- #350
- US rank
- #7222
Category grades
Schools grade is shown separately in the Schools card above.
Census & demographics
- Census place
- Hampshire, IL
- County
- Kane County · 361,735 people
- City population
- 22,689
- Metro
- Chicago-Naperville-Elgin, IL-IN-WI
- Population (ZIP)
- 22,689
- Household income
- $111,241
- Rent vs Own
- Severe rent burden
- 16.0
Population outlook (Kane County) Hauer SSP2
- Today (2025)
- 559,449 people
- By 2030
- 568,757 · +1.7%
- By 2040
- 575,969 · +3.0%
- By 2050
- 563,477 · +0.7%
- By 2075
- 492,321 · -12.0%
- By 2100
- 380,943 · -31.9%
Race, ethnicity, and origin ACS 2023
- Neighborhood character
- Predominantly White (70%)
- Race & ethnicity
- White 70% Hispanic / Latino 15% Two or more races 7% Asian 6% Black 5%
- Hispanic origin (detail)
- Mexican 11%
- Common ancestry
- Romanian 12% Lithuanian 3% Italian 2%
- Foreign-born
- 11% · Canada, Jamaica
- Languages at home
- 83% English-only · Spanish 11% Russian/Polish/Slavic 2% Tagalog/Filipino 2%
Political lean MEDSL · Kane
- 2024 margin
- Lean D (+9.4) · D 54.0% · R 44.6% · Other 1.4%
- 2008→2024 swing
- -2.4pp toward R · 2008: 11.8pp · 2024: 9.4pp
- All cycles
- 2024: D+9.4 2020: D+14.4 2016: D+8.9 2012: D+0.9 2008: D+11.8
Not yet ingested
- Civics
- —
Market trends
- HPI YoY
- ▼ -71.68%
- Current HPI
- 219.0902
- Rent YoY
- —
- Metro
- Chicago-Naperville-Elgin, IL-IN-WI
- State GDP YoY
- ▲ 1.59%
- F500 in state
- 60
Industry mix (Fortune 500 HQ in IL)
| Industry | F500 HQs | Revenue |
|---|---|---|
| Insurance | 4 | $201B |
|
||
| Consumer Goods | 4 | $87B |
|
||
| Industrial Machinery | 3 | $64B |
|
||
| Healthcare | 2 | $55B |
|
||
| Retail / Pharmacy | 1 | $148B |
|
||
| Agriculture / Food | 1 | $86B |
|
||
Cash-flow waterfall
monthlySold comps — $/sqft
last 12 mo · ≤1 miLoading sold comps…