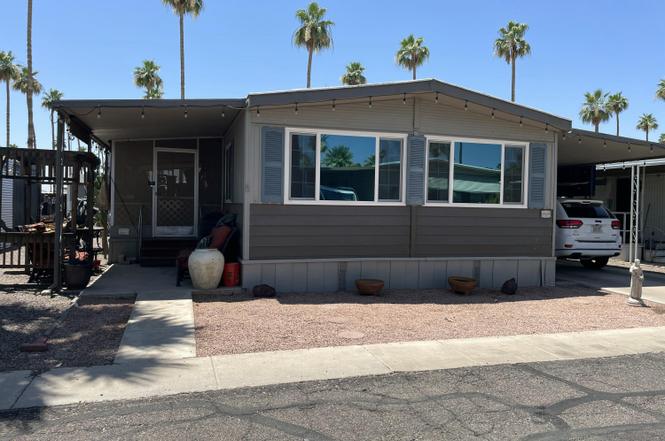
2050 W Dunlap Ave Unit F294 · Phoenix, AZ
Flood risk 3/10 · Minor
- FEMA flood zone
- X (shaded)
- Chance of flooding over 30 yrs
- 0.13%
- Est. flood insurance / yr
- $507 – $1,088
Fire risk 3/10 · Minor
- Est. fire insurance / yr
- $610 – $1,132
Heat risk 8/10 · Major
- Hot days now (above 112°F)
- 6 days/yr
- Hot days in 30 yrs
- 15 days/yr
Wind risk 1/10 · Minimal
- Chance of severe wind over 30 yrs
- —
Air-quality risk 3/10 · Minor
- Unhealthy air days now
- 3 days/yr
- Unhealthy air days in 30 yrs
- 4 days/yr
Risk factors via First Street. Map © Google.
Why this score? — see what drove the B grade
The composite is a weighted blend of 9 inputs, each scored 0–100. Each bar is that input's sub-score; the figure is the points it added to the 100-point composite (weight × sub-score).
- Cash flow +30.0/30.0
- ARV discount +14.0/15.0
- 1% rule +10.0/10.0
- DSCR +10.0/10.0
- Livability +3.8/5.0
- Condition / age +2.5/5.0
- Schools +2.3/10.0
- Rent growth +1.7/5.0
- Appreciation +0.0/10.0
$49,900
🖨 Deal sheet 📄 Offer letter ✓ Due diligence
Listing remarks
Seller will carry. Well kept, great bones Kitchen and Flooring nicely upgraded. Large Master Bedroom with walk-in closet, dual sinks and separate toilet/shower room. Indoor Laundry Room with extra cabinet. Extra Large Workshop/Storage Room with Barn Doors. Az Room off Front Door. Up 3 steps to the front door. Covered Parking, Tuff Shed and more, come by and take a look.
Key facts
- Parking
- Community pool
- Built 1971
Property features AI
Finance
- Other: Private spa; Lot size not available (source indicates SqFt not available)
- HOA & community: Land lease: $985 per month; Association fee includes: other (see remarks); Community pool and community spa; Pickleball courts; Transportation services; Near light rail stop and near bus stop; Gated community
Exterior
- Parking: Covered carport (1 space); Gated community parking in a community structure
- Security: Gated community
- Utilities: City water; Public sewer
- Home design: Manufactured/mobile housing; Leasehold ownership
- Construction: Aluminum siding; Steel frame construction; Other roof material
- Exterior features: Screened-in patio(s); On-site storage; Gravel/stone front and back
Interior
- Bedrooms: 2 possible bedrooms
- Flooring: Laminate flooring
- Bathrooms: 1 full bathroom
- Heating & cooling: Natural gas heating; Central air conditioning; Ceiling fans
- Interior features: Double vanity; 3/4 bath in master bedroom
- Laundry & utility: Laundry inside
Neighborhood map
What this means for you Summary
Snapshot
- This is a 2-bed/1.0-bath manufactured listed at $50k.
Deal economics
- At list price, monthly cash flow is $747 ($9k/yr) — positive.
- The deal already cash-flows at list — no discount required.
- Meets the 1% rule at list price ($1k rent vs $50k).
- Recommended offer: $44k (12.0% below list) — sets the bar for market timing.
- Cap rate 24.3% vs local median 3.3% in Phoenix — top-decile yield for the area; either an underpriced asset or a hidden risk that comps aren't pricing in. Stress-test before assuming the spread holds.
Location & tenants
- Location reads 75/100 on livability (#16 in AZ, #3,924 nationally) — a middle-class / working-renter tenant base. Strengths: amenities A+, commute A+, housing A+; Watch: health & safety C-, crime F.
- Glendale Union High School District (4285) (urban): math 23% / reading 31% proficiency, ranked #130 of 249 in AZ (top 52%) — low school quality limits family demand, transient renter base, plan for 1-2y turnover.
- Market conditions: Rents falling (-3.1%/yr); 179 active listings in the ZIP; 40 comparable units currently listed for rent nearby; rentals leasing fast (median 2d on market — plan ~1-2 weeks tenant-placement turnaround); 36,011 units permitted in Maricopa County in 2024 (12,801 in 5+ unit buildings).
Forward outlook
- Local home prices are declining (-3.0%/yr); year-one equity from $345 of loan paydown is wiped out by about $1k of value loss. Plan a longer hold.
- Maricopa County population projected at +38% by 2050 — long-run rental-demand tailwind backs the buy-and-hold thesis.
- At projected returns (-3.0% appreciation + 0.0% rent growth), your $14k cash investment doubles in ~2 years — after that, you're playing with house money.
Negotiation context
- It's been on market 372 days — a 12% lower offer ($44k) is reasonable based on typical stale-listing flexibility.
Risks & watch-outs
- Climate carrying-cost: extreme-heat days projected 6→15/yr by 2055 (HVAC capex compounding) — expect insurance premiums to compound above CPI over the hold.
Questions for the listing agent
- It's been on market 372 days. Have you received any prior offers? Is the seller open to a 12% concession, seller financing, or rate buy-down credit?
- Built in 1971 — when were the roof, HVAC, electrical panel, plumbing, and water heater last replaced?
- Why hasn't it sold? Are there any deal-killer items the seller is aware of (foundation, flood, title, zoning, code violations)?
- Is there a deadline driving the sale (1031 exchange, divorce, estate, relocation)? That informs how much negotiation room exists.
- Crime grade is F in this area — have there been break-ins, vandalism, or insurance claims at this property in the last 3 years? What carrier currently insures it and at what premium?
- What's the average days-on-market for RENTAL listings here right now (not sales)? A rising rental-DOM trend means longer vacancies and softer asking-rent achievability than the comps imply.
- What's the recent tenant-quality profile in this submarket — average credit score on applications, eviction rate, late-payment / NSF rate, and stable-employment percentage? A property-management company in the area should have these aggregated.
- How much new for-sale + rental construction is in the pipeline within 1–3 miles? Heavy new supply typically softens prices + rents 12–24 months out; constrained supply supports both.
Investment metrics
- 1% rule
- 2.77% ✓
- Cap rate
- 24.26%
- Cash-on-cash
- 64.16%
- DSCR
- 3.85
- GRM
- 3.0
CMA / ARV
- ARV (on-the-fly)
- $58,300
- Comps found
- 2
Show comp detail 2 sales within ~0.75 mi
| Address | Dist | Beds/Ba | Sqft | Sold | Price | $/sf | Match |
|---|---|---|---|---|---|---|---|
| 2050 W Dunlap Ave Unit D54 | 0.21mi | 2/2.0 | 1,104 (+4%) | 23mo | $60,900 | $55 | 60 |
| 2050 W Dunlap Ave Unit R252 | 0.21mi | 2/2.0 | 1,152 (+9%) | 18mo | $30,000 | $26 | 56 |
Match score weights: distance 35% · size 25% · config 20% · recency 20%. Top-matched comps best support the ARV.
Projected returns pro-forma
-3.0% appreciation · 0.0% rent growth · sell at horizon
- IRR
- 59.8%
- Equity multiple
- 3.54×
- Total profit
- $35,461
- Equity at exit
- $7,440
- IRR
- 63.5%
- Equity multiple
- 6.48×
- Total profit
- $76,572
- Equity at exit
- $4,314
Cash invested: $13,972 (down + closing). Projections, not guarantees.
Landlord ↔ Tenant lean methodology
- Overall (STATE)
- 87 Strongly Landlord-Friendly
- State Arizona
- 87 Strongly Landlord-Friendly · R+3
- County
- — inherits STATE
- City
- — inherits STATE
ZIP-level market 85021
- Rents YoY
- -3.1%
- Active inventory
- 179
- Price-to-rent
- 3.0×
Monthly cashflow live
- Estimated rent
- $1,382 high interval (Pro) →
- Mortgage (P&I)
- −$262
- Tax est. 1.5%
- −$62 /mo · $748/yr
- Insurance
- −$21
- HOA
- −$0
- Vacancy / Maint / Mgmt
- −$290
- Net cashflow
- $747
Break-even live
UW: 25.0% down · 7.5% · 30yr · 1.5% tax · 5.0% vac · 8.0% maint · 8.0% mgmt
Financing live
Cash to close
- Down payment
- $12,475
- Closing costs
- $1,497
- Reserves months
- —
- Total cash needed
- —
Loan-product check · same deal, 3 products live
Conventional
25% down · 7.5% · 30yr
- Down + closing
- —
- Monthly P&I
- —
- Monthly cashflow
- —
- DSCR
- —
- Eligible?
- —
Personal DTI + credit; lowest rate.
DSCR
20% down · 8.5% · 30yr
- Down + closing
- —
- Monthly P&I
- —
- Monthly cashflow
- —
- DSCR
- —
- Eligible?
- —
No personal income docs; deal must DSCR.
Hard money
10% down · 12.0% · 12mo
- Down + closing
- —
- Monthly P&I
- —
- Monthly cashflow
- —
- DSCR
- —
- Eligible?
- —
Short-term bridge; refi at stabilization.
Rent comps 40 comps
| Address | Beds | Baths | Sqft | Rent | $/sqft | DOM | Units | Dist |
|---|---|---|---|---|---|---|---|---|
| 9202 N 19th Ave Phoenix, AZ | 2.0 | 1.0–2.0 | 645 | $1,550 | $2.40 | 1d | 8 | 0.18mi |
| 2220 W Mission Ln Phoenix, AZ | 1.0–3.0 | 1.0–2.0 | 944 | $1,647 | $1.74 | 1d | 67 | 0.21mi |
| 1814 W Vogel Ave Phoenix, AZ | 1.0–2.0 | 1.0 | 737 | $1,249 | $1.69 | 1d | 1 | 0.36mi |
| 8902 N 19th Ave Phoenix, AZ | 1.0–2.0 | 1.0–2.0 | 733 | $1,265 | $1.73 | 1d | 12 | 0.36mi |
| 1702 W Vogel Ave Unit C5 Phoenix, AZ | 2.0 | 1.0 | 750 | $845 | $1.13 | 14d | 1 | 0.45mi |
| 9633 N 17th Ave Unit 23 Phoenix, AZ | 2.0 | 1.0 | 735 | $1,395 | $1.90 | 13d | 1 | 0.49mi |
| 2323 W Dunlap Ave Phoenix, AZ | 1.0–2.0 | 1.0–2.0 | 788 | $1,370 | $1.74 | 1d | 9 | 0.53mi |
| 10034 N 18th Ave Unit 1 Phoenix, AZ | 2.0 | 2.0 | 945 | $949 | $1.00 | 1d | 1 | 0.54mi |
| 1753 W Brown St Phoenix, AZ | 3.0 | 1.0 | 1100 | $1,450 | $1.32 | 1d | 1 | 0.54mi |
| 10044 N 18th Ave Unit 2 Phoenix, AZ | 2.0 | 2.0 | 945 | $899 | $0.95 | 1d | 1 | 0.56mi |
| 1614 W Purdue Ave Unit 202 Phoenix, AZ | 2.0 | 1.0 | 720 | $895 | $1.24 | 1d | 1 | 0.56mi |
| 1597 W Mountain View Rd Unit 7 Phoenix, AZ | 2.0 | 1.0 | 856 | $1,149 | $1.34 | 18d | 1 | 0.63mi |
| 1597 W Mountain View Rd Unit 5 Phoenix, AZ | 2.0 | 1.0 | 806 | $1,155 | $1.43 | 1d | 1 | 0.63mi |
| 2506 W Dunlap Ave Phoenix, AZ | 2.0 | 1.0–2.0 | 719 | $1,480 | $2.06 | 1d | 14 | 0.63mi |
| 8530 N 22nd Ave Unit 2008 Phoenix, AZ | 2.0 | 2.0 | 996 | $1,499 | $1.51 | 17d | 1 | 0.66mi |
| 8530 N 22nd Ave Phoenix, AZ | 1.0–2.0 | 1.0–2.0 | 814 | $1,499 | $1.84 | 10d | 55 | 0.67mi |
| 8530 N 22nd Ave Unit 1028 Phoenix, AZ | 2.0 | 2.0 | 902 | $1,399 | $1.55 | 17d | 1 | 0.67mi |
| 2122 W Butler Dr Phoenix, AZ | 2.0 | 1.0–2.0 | 637 | $1,550 | $2.43 | 1d | 12 | 0.69mi |
| 8530 N 22nd Ave Unit 2057 Phoenix, AZ | 1.0 | 1.0 | 707 | $1,199 | $1.70 | 1d | 1 | 0.70mi |
| 8530 N 22nd Ave Unit 2051 Phoenix, AZ | 1.0 | 1.0 | 707 | $1,199 | $1.70 | 24d | 1 | 0.71mi |
| 8530 N 22nd Ave Unit 266 Phoenix, AZ | 2.0 | 2.0 | 1000 | $1,199 | $1.20 | 1d | 1 | 0.71mi |
| 8530 N 22nd Ave Unit 2079 Phoenix, AZ | 2.0 | 2.0 | 902 | $1,399 | $1.55 | 1d | 1 | 0.72mi |
| 8530 N 22nd Ave Unit 2114 Phoenix, AZ | 2.0 | 2.0 | 996 | $1,499 | $1.51 | 1d | 1 | 0.76mi |
| 2262 W El Caro Dr Phoenix, AZ | 2.0 | 2.5 | 1457 | $1,775 | $1.22 | 1d | 1 | 0.78mi |
| 2045 W Butler Dr Phoenix, AZ | 1.0–3.0 | 1.0–2.0 | 738 | $1,202 | $1.63 | 1d | 14 | 0.79mi |
| 8330 N 19th Ave Phoenix, AZ | 1.0–2.0 | 1.0–2.0 | 818 | $1,440 | $1.76 | 1d | 24 | 0.82mi |
| 2121 W Butler Dr Phoenix, AZ | 1.0–3.0 | 1.0–2.5 | 1025 | $2,095 | $2.04 | 1d | 33 | 0.84mi |
| 10213 N 15th Ave Unit 1 Phoenix, AZ | 2.0 | 1.0 | 850 | $950 | $1.12 | 1d | 1 | 0.89mi |
| 10213 N 15th Ave Unit 1 Phoenix, AZ | 2.0 | 1.0 | 850 | $1,025 | $1.21 | 10d | 1 | 0.89mi |
| 1212 W Mountain View Rd Unit 7 Phoenix, AZ | 2.0 | 1.0 | 700 | $1,150 | $1.64 | 1d | 1 | 0.89mi |
| 2244 W Laurie Ln Phoenix, AZ | 2.0 | 2.5 | 1414 | $1,750 | $1.24 | 1d | 1 | 0.91mi |
| 2280 W Laurie Ln Phoenix, AZ | 3.0 | 2.5 | 1497 | $1,945 | $1.30 | 1d | 1 | 0.92mi |
| 10231 N 15th Ave Phoenix, AZ | 3.0 | 1.0 | 900 | $1,350 | $1.50 | 1d | 1 | 0.92mi |
| 8326 N 22nd Ln Phoenix, AZ | 2.0 | 2.5 | 1450 | $2,750 | $1.90 | 3d | 1 | 0.92mi |
| 8222 N 19th Ave Phoenix, AZ | 2.0 | 1.0–2.0 | 667 | $1,410 | $2.11 | 1d | 33 | 0.93mi |
| 1124 W Cinnabar Ave Phoenix, AZ | 3.0 | 2.0 | 1012 | $1,691 | $1.67 | 1d | 1 | 0.96mi |
| 9275 N 29th Ave Phoenix, AZ | 1.0–2.0 | 1.0–2.0 | 844 | $1,994 | $2.36 | 1d | 45 | 0.97mi |
| 1022 W Mission Ln Phoenix, AZ | 3.0 | 2.0 | 1322 | $2,350 | $1.78 | 1d | 1 | 0.98mi |
| 1022 W Mission Ln Unit 1022 Phoenix, AZ | 3.0 | 2.0 | 1322 | $2,350 | $1.78 | 19d | 1 | 0.98mi |
| 9837 N 11th Ave Apt 3 Phoenix, AZ | 2.0 | 1.0 | 700 | $1,275 | $1.82 | 1d | 1 | 1.01mi |
Listing history 14 events
-
2026-06-18days on market $49,900 Active 372 DOM
-
2026-06-17days on market $49,900 Active 371 DOM
-
2026-06-16days on market $49,900 Active 370 DOM
-
2026-06-15days on market $49,900 Active 369 DOM
-
2026-06-13days on market $49,900 Active 367 DOM
-
2026-06-09days on market $49,900 Active 363 DOM
-
2026-06-08days on market $49,900 Active 362 DOM
-
2026-06-07days on market $49,900 Active 361 DOM
-
2026-06-04days on market $49,900 Active 358 DOM
-
2026-06-03days on market $49,900 Active 357 DOM
-
2026-06-02days on market $49,900 Active 356 DOM
-
2026-06-01days on market $49,900 Active 355 DOM
-
2026-05-31days on market $49,900 Active 354 DOM
-
2025-06-11$49,900 Active
ⓘ Source: listings_history table (triggers on properties + properties_extension) + one-shot
backfill from property_details.listing_events for pre-trigger history.
Climate risk First Street
- Flood 3/10 Moderate FEMA zone X (shaded) · 13% chance over 30 yrs
- Wildfire 3/10 Moderate
- Heat 8/10 Severe 6 d/yr ≥112°F today · 15 d/yr by 30 yrs out
- Wind 1/10 Low
- Air quality 3/10 Moderate 3 unhealthy d/yr today · 4 by 30 yrs out
Nearby sold comps map
Loading sold comps map…
Walkable amenities ~0.75 mi
Loading nearby amenities…
Taxation est. · year 1
- Rental income
- $16,585
- − Mortgage interest
- −$2,795
- − Property taxes
- −$748
- − Insurance
- −$250
- − Repairs & maintenance
- −$1,327
- − Management
- −$1,327
- − Depreciation
- −$1,452
- Taxable income
- $8,686
- Est. tax owed @ 24.0%
- −$2,085
- After-tax cash flow
- $6,879/yr
For passive investors: Depreciation is non-cash, so a rental often shows a tax loss while cash-flowing — sheltering income. Rental losses are passive: they offset passive income freely, and up to $25,000/yr can offset ordinary (W-2) income if you actively participate and your MAGI is under $100k (phasing out to $0 by $150k); unused losses carry forward. On sale, claimed depreciation is recaptured at up to 25%, and gains may owe capital-gains tax (a 1031 exchange can defer both). Figures are a year-1 estimate at your 24.0% rate — not tax advice; consult a CPA.
Schools (NCES district)
- District
- Glendale Union High School District (4285)
- NCES district ID
- 0403450
- Math proficiency
- 23% ▼ -38.00%
- Reading proficiency
- 31% ▼ -19.00%
- Median HH income
- $40,846
- Composite
- 22.81/100
- National rank
- #8020
- State rank
- #130 of 249 in AZ
Livability — Phoenix
- Score
- 75/100
- State rank
- #16
- US rank
- #3924
Category grades
Schools grade is shown separately in the Schools card above.
Census & demographics
- Census place
- Phoenix, AZ
- County
- Maricopa County · 4,537,380 people
- City population
- 1,500,198
- Metro
- Phoenix-Mesa-Chandler, AZ
- Population (ZIP)
- 39,828
- Household income
- $59,768
- Rent vs Own
- Severe rent burden
- 2553.0
Population outlook (Maricopa County) Hauer SSP2
- Today (2025)
- 4,979,203 people
- By 2030
- 5,378,229 · +8.0%
- By 2040
- 6,156,598 · +23.6%
- By 2050
- 6,872,376 · +38.0%
- By 2075
- 8,401,270 · +68.7%
- By 2100
- 9,247,439 · +85.7%
Race, ethnicity, and origin ACS 2023
- Neighborhood character
- Diverse neighborhood (Simpson 0.68)
- Race & ethnicity
- White 44% Hispanic / Latino 34% Two or more races 21% Black 12% Native American 4% Asian 2%
- Hispanic origin (detail)
- Mexican 27% Cuban 2%
- Common ancestry
- Italian 2% Slovak 1% Lithuanian 1%
- Foreign-born
- 16% · Canada
- Languages at home
- 73% English-only · Spanish 22% French/Haitian/Cajun 1% Other Asian/Pacific 1%
Political lean MEDSL · Maricopa
- 2024 margin
- Toss-up / Even · D 47.7% · R 51.2% · Other 1.1%
- 2008→2024 swing
- +7.1pp toward D · 2008: -10.6pp · 2024: -3.5pp
- All cycles
- 2024: R+3.5 2020: D+2.2 2016: R+3.5 2012: R+12.0 2008: R+10.6
Not yet ingested
- Civics
- —
Market trends
- HPI YoY
- ▼ -450.91%
- Current HPI
- 328.1754
- Rent YoY
- ▼ -3.08%
- Metro
- Phoenix-Mesa-Chandler, AZ
- State GDP YoY
- ▲ 4.54%
- F500 in state
- 20
Industry mix (Fortune 500 HQ in AZ)
| Industry | F500 HQs | Revenue |
|---|---|---|
| Technology | 2 | $13B |
|
||
| Mining / Metals | 1 | $23B |
|
||
| Environmental Services | 1 | $16B |
|
||
| Metals / Steel | 1 | $14B |
|
||
| Technology Distribution | 1 | $9B |
|
||
| Homebuilding | 1 | $8B |
|
||
Price history
1 event — show timeline
- 2025-06-11 Listed $49,900 ARMLS
Cash-flow waterfall
monthlySold comps — $/sqft
last 12 mo · ≤1 miLoading sold comps…