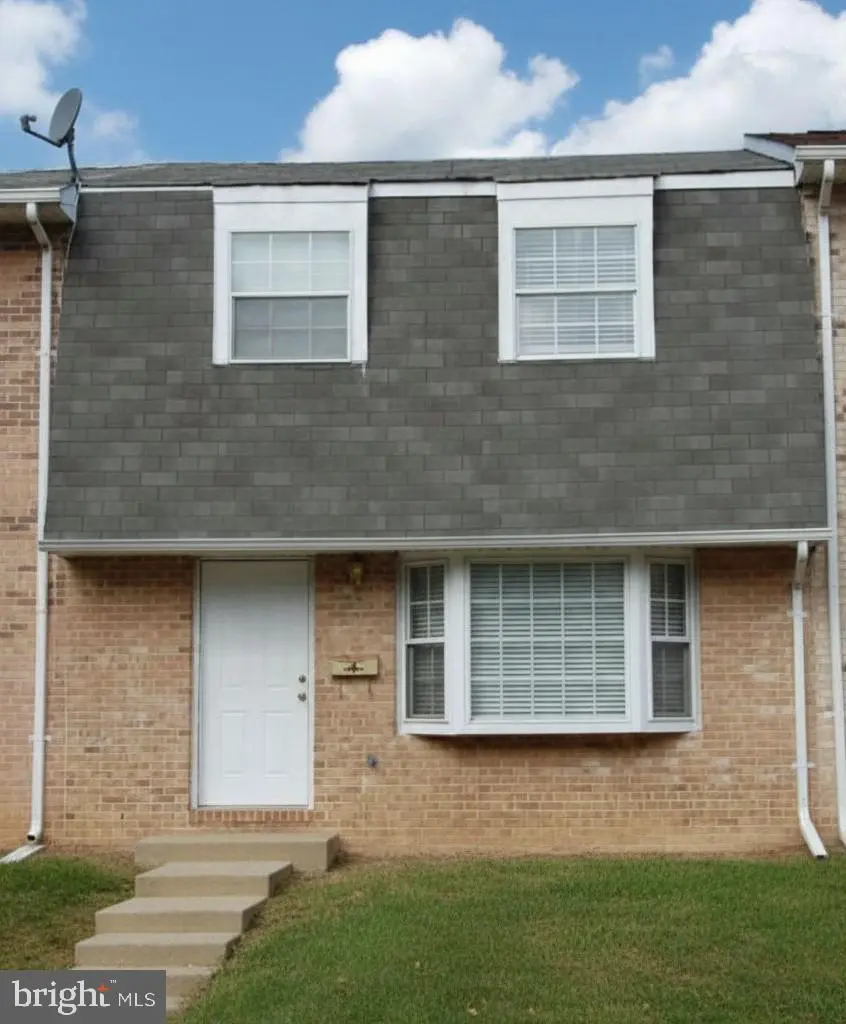
46842 Patuxent Rd · Lexington Park, MD
Flood risk 1/10 · Minimal
- FEMA flood zone
- X (unshaded)
- Chance of flooding over 30 yrs
- 0.0%
- Est. flood insurance / yr
- $507 – $1,088
Fire risk 4/10 · Minor
- Est. fire insurance / yr
- $755 – $1,403
Heat risk 9/10 · Severe
- Hot days now (above 100°F)
- 7 days/yr
- Hot days in 30 yrs
- 17 days/yr
Wind risk 6/10 · Moderate
- Chance of severe wind over 30 yrs
- 68.0%
Air-quality risk 2/10 · Minimal
- Unhealthy air days now
- 1 days/yr
- Unhealthy air days in 30 yrs
- 2 days/yr
Risk factors via First Street. Map © Google.
Why this score? — see what drove the B+ grade
The composite is a weighted blend of 9 inputs, each scored 0–100. Each bar is that input's sub-score; the figure is the points it added to the 100-point composite (weight × sub-score).
- Cash flow +30.0/30.0
- ARV discount +13.8/15.0
- DSCR +10.0/10.0
- 1% rule +7.9/10.0
- Appreciation +3.2/10.0
- Livability +3.1/5.0
- Schools +3.0/10.0
- Rent growth +2.6/5.0
- Condition / age +2.5/5.0
$169,000
🖨 Deal sheet (PDF) 📄 Offer letter ✓ Due diligence
Listing remarks MLS
Welcome Home! This charming 2-story townhome in Lexington Park is ready for its next owner! Featuring 3 comfortable bedrooms, 1.5 baths, a spacious living room, and a country kitchen with plenty of room for cooking and dining, this home offers both comfort and functionality. Enjoy the convenience of being close to shopping, schools, and NAS Patuxent River, making daily living easy and accessible. Whether you're a first-time buyer or looking to downsize, this home is a fantastic opportunity!
Key facts
- Country kitchen
- Close to schools
- 2 story townhome
Tags
Neighborhood map
What this means for you Summary
Snapshot
- This is a 3-bed/1.5-bath townhouse listed at $169k.
Deal economics
- At list price, monthly cash flow is $647 ($8k/yr) — positive.
- The deal already cash-flows at list — no discount required.
- Meets the 1% rule at list price ($2k rent vs $169k).
- Recommended offer: $159k (6.0% below list) — sets the bar for market timing.
- Cap rate 10.9% vs local median 4.0% in Lexington Park — top-decile yield for the area; either an underpriced asset or a hidden risk that comps aren't pricing in. Stress-test before assuming the spread holds.
Location & tenants
- Location reads 61/100 on livability (#331 in MD) — a middle-class / working-renter tenant base. Strengths: employment A+, housing A; Watch: schools D, crime F, amenities F.
- St. Mary'S County Public Schools (rural): math 23% / reading 38% proficiency, ranked #8 of 24 in MD (top 33%) — families likely to look elsewhere, expect single-tenant / working-renter base with shorter leases.
- Market conditions: Rents flat; 94 active listings in the ZIP; solid renter incomes; 265 units permitted in St. Mary's County in 2024 (0 in 5+ unit buildings).
Forward outlook
- Local home prices are declining (-3.0%/yr); year-one equity from $1k of loan paydown is wiped out by about $5k of value loss. Plan a longer hold.
- St. Mary's County population projected at +16% by 2050 — long-run rental-demand tailwind backs the buy-and-hold thesis.
- At projected returns (-3.0% appreciation + 0.5% rent growth), your $47k cash investment doubles in ~10 years — after that, you're playing with house money.
Negotiation context
- It's been on market 89 days — a 6% lower offer ($159k) is reasonable based on typical stale-listing flexibility.
- 16 sale attempts since 21y ago with the ask held roughly flat each time — persistent listings suggest the price (not the market) is what's stuck; bring a comps-based counter.
- Current owner paid $37k; list at $169k implies a 358% gain — meaningful room to come down on a strong offer.
Risks & watch-outs
- Climate carrying-cost: major wind risk, 68% chance of damaging wind over 30y; extreme-heat days projected 7→17/yr by 2055 (HVAC capex compounding) — expect insurance premiums to compound above CPI over the hold.
Questions for the listing agent
- It's been on market 89 days. Have you received any prior offers? Is the seller open to a 6% concession, seller financing, or rate buy-down credit?
- Built in 1976 — when were the roof, HVAC, electrical panel, plumbing, and water heater last replaced?
- Why hasn't it sold? Are there any deal-killer items the seller is aware of (foundation, flood, title, zoning, code violations)?
- Is there a deadline driving the sale (1031 exchange, divorce, estate, relocation)? That informs how much negotiation room exists.
- Schools are D-rated, which usually means shorter tenancies and higher turnover. Who's the typical renter profile here, and what's been the actual vacancy rate?
- Crime grade is F in this area — have there been break-ins, vandalism, or insurance claims at this property in the last 3 years? What carrier currently insures it and at what premium?
- What's the average days-on-market for RENTAL listings here right now (not sales)? A rising rental-DOM trend means longer vacancies and softer asking-rent achievability than the comps imply.
- What's the recent tenant-quality profile in this submarket — average credit score on applications, eviction rate, late-payment / NSF rate, and stable-employment percentage? A property-management company in the area should have these aggregated.
- How much new for-sale + rental construction is in the pipeline within 1–3 miles? Heavy new supply typically softens prices + rents 12–24 months out; constrained supply supports both.
Investment metrics
- 1% rule
- 1.29% ✓
- Cap rate
- 10.88%
- Cash-on-cash
- 16.40%
- DSCR
- 1.73
- GRM
- 6.5
CMA / ARV
- ARV (median comp)
- $196,717
- List price
- $169,000
- Delta
- -14.09%
- Verdict
- UNDERPRICED
- Comps
- 20 within 1.0 mi
Show comp detail 10 sales within ~0.75 mi
| Address | Dist | Beds/Ba | Sqft | Sold | Price | $/sf | Match |
|---|---|---|---|---|---|---|---|
| 46838 Rogers Dr | 0.05mi | 3/1.5 | 1,240 (0%) | 10mo | $199,000 | $160 | 90 |
| 46850 Patuxent Rd | 0.01mi | 3/1.5 | 1,240 (0%) | 12mo | $214,999 | $173 | 89 |
| 46855 Rogers Dr | 0.04mi | 3/1.5 | 1,240 (0%) | 13mo | $210,000 | $169 | 87 |
| 46829 Rogers Dr | 0.02mi | 3/1.5 | 1,240 (0%) | 20mo | $210,000 | $169 | 82 |
| 46834 Rogers Dr | 0.05mi | 3/1.5 | 1,240 (0%) | 21mo | $199,000 | $160 | 81 |
| 46856 Rogers Dr | 0.06mi | 3/1.5 | 1,272 (+3%) | 16mo | $210,000 | $165 | 80 |
| 46843 S Shangri La Dr | 0.15mi | 3/2.0 | 1,320 (+6%) | 5mo | $187,000 | $142 | 76 |
| 46832 Flower Dr | 0.09mi | 3/1.5 | 1,320 (+6%) | 18mo | $190,000 | $144 | 70 |
| 46874 Flower Dr | 0.11mi | 3/1.5 | 1,320 (+6%) | 18mo | $190,000 | $144 | 69 |
| 46827 S Shangri La Dr | 0.12mi | 3/1.5 | 1,320 (+6%) | 23mo | $195,000 | $148 | 65 |
Match score weights: distance 35% · size 25% · config 20% · recency 20%. Top-matched comps best support the ARV.
Projected returns pro-forma
-3.0% appreciation · 0.49% rent growth · sell at horizon
- IRR
- 4.7%
- Equity multiple
- 1.18×
- Total profit
- $8,406
- Equity at exit
- $25,198
- IRR
- 11.8%
- Equity multiple
- 1.83×
- Total profit
- $39,300
- Equity at exit
- $14,612
Cash invested: $47,320 (down + closing). Projections, not guarantees.
Landlord ↔ Tenant lean methodology
- Overall (STATE)
- 27 Tenant-Leaning
- State Maryland
- 27 Tenant-Leaning · D+14
- County
- — inherits STATE
- City
- — inherits STATE
ZIP-level market 20653
- Home prices YoY
- -1.4%
- Rents YoY
- 0.5%
- Active inventory
- 94
- Price-to-rent
- 6.5×
Monthly cashflow live
- Estimated rent
- $2,180 medium interval (Pro) →
- Mortgage (P&I)
- −$886
- Tax from tax record
- −$119 /mo · $1,422/yr
- Insurance
- −$70
- HOA
- −$0
- Vacancy / Maint / Mgmt
- −$458
- Net cashflow
- $647
Break-even live
Sensitivity live
| Price | -10% $742 | -5% $694 | +0% $647 | +5% $599 | +10% $551 |
|---|---|---|---|---|---|
| Rent | -10% $474 | -5% $561 | +0% $647 | +5% $733 | +10% $819 |
| Rate | -1.0pp $732 | -0.5pp $690 | base $647 | +0.5pp $603 | +1.0pp $558 |
UW: 25.0% down · 7.5% · 30yr · 1.5% tax · 5.0% vac · 8.0% maint · 8.0% mgmt
Financing live
Cash to close
- Down payment
- $42,250
- Closing costs
- $5,070
- Reserves months
- —
- Total cash needed
- —
Loan-product check · same deal, 3 products live
Conventional
25% down · 7.5% · 30yr
- Down + closing
- —
- Monthly P&I
- —
- Monthly cashflow
- —
- DSCR
- —
- Eligible?
- —
Personal DTI + credit; lowest rate.
DSCR
20% down · 8.5% · 30yr
- Down + closing
- —
- Monthly P&I
- —
- Monthly cashflow
- —
- DSCR
- —
- Eligible?
- —
No personal income docs; deal must DSCR.
Hard money
10% down · 12.0% · 12mo
- Down + closing
- —
- Monthly P&I
- —
- Monthly cashflow
- —
- DSCR
- —
- Eligible?
- —
Short-term bridge; refi at stabilization.
Listing history 50 events
-
2026-06-21days on market $169,000 Active 89 DOM
-
2026-06-19days on market $169,000 Active 87 DOM
-
2026-06-18days on market $169,000 Active 86 DOM
-
2026-06-17days on market $169,000 Active 85 DOM
-
2026-06-16days on market $169,000 Active 84 DOM
-
2026-06-15days on market $169,000 Active 83 DOM
-
2026-06-14days on market $169,000 Active 81 DOM
-
2026-06-12days on market $169,000 Active 80 DOM
-
2026-06-09days on market $169,000 Active 77 DOM
-
2026-06-08days on market $169,000 Active 76 DOM
-
2026-06-07days on market $169,000 Active 75 DOM
-
2026-06-05days on market $169,000 Active 72 DOM
-
2026-06-02days on market $169,000 Active 70 DOM
-
2026-06-01days on market $169,000 Active 69 DOM
-
2026-05-31days on market $169,000 Active 68 DOM
-
2026-05-30days on market $169,000 Active 67 DOM
-
2026-03-24$169,000 Active 495-char remark
Show marketing remark (495 chars)
Welcome Home! This charming 2-story townhome in Lexington Park is ready for its next owner! Featuring 3 comfortable bedrooms, 1.5 baths, a spacious living room, and a country kitchen with plenty of room for cooking and dining, this home offers both comfort and functionality. Enjoy the convenience of being close to shopping, schools, and NAS Patuxent River, making daily living easy and accessible. Whether you're a first-time buyer or looking to downsize, this home is a fantastic opportunity!
-
2026-03-24historical
Show marketing remark (495 chars)
Welcome Home! This charming 2-story townhome in Lexington Park is ready for its next owner! Featuring 3 comfortable bedrooms, 1.5 baths, a spacious living room, and a country kitchen with plenty of room for cooking and dining, this home offers both comfort and functionality. Enjoy the convenience of being close to shopping, schools, and NAS Patuxent River, making daily living easy and accessible. Whether you're a first-time buyer or looking to downsize, this home is a fantastic opportunity!
-
2025-10-21$179,000 Active
-
2025-10-08historical
-
2012-06-21soldstatus $36,915 Sold
-
2012-06-21soldstatus $36,915
-
2012-04-30status Contract
-
2012-04-30historical
-
2012-04-20price $35,000
-
2012-04-19status Active
-
2012-03-24historical Withdrawn
-
2012-02-27price $42,900
-
2012-01-23price $47,900
-
2011-12-31status Active
-
2011-12-24historical Expired
-
2011-12-23$49,900 Active
-
2011-12-23$35,000
-
2011-07-26historical
-
2011-07-26historical
-
2011-06-16price Active
-
2011-06-16status Active
-
2011-02-09status Contingent (No Kick Out)
-
2011-01-01status Active
-
2010-10-13historical
-
2010-09-04Active
-
2010-09-03$45,000
-
2010-06-01historical Expired
-
2010-06-01historical
-
2009-12-15price
-
2009-12-12price
-
2009-12-09status Active
-
2009-12-01historical Expired
-
2009-05-28price
-
2009-05-28status
ⓘ Source: listings_history table (triggers on properties + properties_extension) + one-shot
backfill from property_details.listing_events for pre-trigger history.
Tax reassessment forecast MD · Partial reset (capped growth)
- Current annual tax
- $1,422 · $119/mo
- Projected year-2 tax
- $1,632 · $136/mo
- Expected delta
- +$210/yr (+$18/mo · 14.8%)
ⓘ Screening estimate from a state-policy table — verify with the county assessor before closing.
Climate risk First Street
- Flood 1/10 Low FEMA zone X (unshaded) · 0% chance over 30 yrs
- Wildfire 4/10 Moderate
- Heat 9/10 Extreme 7 d/yr ≥100°F today · 17 d/yr by 30 yrs out
- Wind 6/10 Major 68% chance of damaging wind over 30 yrs
- Air quality 2/10 Low 1 unhealthy d/yr today · 2 by 30 yrs out
Nearby sold comps map
Loading sold comps map…
Walkable amenities ~0.75 mi
Loading nearby amenities…
Taxation est. · year 1
- Rental income
- $26,154
- − Mortgage interest
- −$9,467
- − Property taxes
- −$1,422
- − Insurance
- −$845
- − Repairs & maintenance
- −$2,092
- − Management
- −$2,092
- − Depreciation
- −$4,916
- Taxable income
- $5,320
- Est. tax owed @ 24.0%
- −$1,277
- After-tax cash flow
- $6,483/yr
For passive investors: Depreciation is non-cash, so a rental often shows a tax loss while cash-flowing — sheltering income. Rental losses are passive: they offset passive income freely, and up to $25,000/yr can offset ordinary (W-2) income if you actively participate and your MAGI is under $100k (phasing out to $0 by $150k); unused losses carry forward. On sale, claimed depreciation is recaptured at up to 25%, and gains may owe capital-gains tax (a 1031 exchange can defer both). Figures are a year-1 estimate at your 24.0% rate — not tax advice; consult a CPA.
Schools (NCES district)
- District
- St. Mary'S County Public Schools
- NCES district ID
- 2400600
- Math proficiency
- 23% ▼ -23.00%
- Reading proficiency
- 38% ▼ -12.00%
- Median HH income
- $83,240
- Composite
- 29.74/100
- National rank
- #6444
- State rank
- #8 of 24 in MD
Livability — Lexington Park
- Score
- 61/100
- State rank
- #331
- US rank
- #17418
Category grades
Schools grade is shown separately in the Schools card above.
Census & demographics
- Census place
- Lexington Park, MD
- County
- Saint Marys County · 48,152 people
- City population
- 26,852
- Metro
- California-Lexington Park, MD
- Population (ZIP)
- 26,852
- Household income
- $103,048
- Rent vs Own
- Severe rent burden
- 1571.0
Population outlook (St. Mary's County) Hauer SSP2
- Today (2025)
- 123,125 people
- By 2030
- 128,374 · +4.3%
- By 2040
- 137,305 · +11.5%
- By 2050
- 143,065 · +16.2%
- By 2075
- 153,408 · +24.6%
- By 2100
- 151,790 · +23.3%
Race, ethnicity, and origin ACS 2023
- Neighborhood character
- Diverse neighborhood (Simpson 0.63)
- Race & ethnicity
- White 54% Black 28% Two or more races 11% Hispanic / Latino 6% Asian 4%
- Hispanic origin (detail)
- Mexican 3% Puerto Rican 1%
- Common ancestry
- Romanian 2% Slovak 2% Italian 1%
- Foreign-born
- 6% · Canada, Jamaica
- Languages at home
- 92% English-only · Spanish 3% Tagalog/Filipino 3% Other Asian/Pacific 1%
Political lean MEDSL · St. Mary's
- 2024 margin
- R (+17.2) · D 40.2% · R 57.4% · Other 2.4%
- 2008→2024 swing
- -4.4pp toward R · 2008: -12.8pp · 2024: -17.2pp
- All cycles
- 2024: R+17.2 2020: R+13.8 2016: R+24.6 2012: R+16.1 2008: R+12.8
Not yet ingested
- Civics
- —
Market trends
- HPI YoY
- ▼ -3.67%
- Current HPI
- 256.5435
- Rent YoY
- ▲ 0.49%
- Metro
- California-Lexington Park, MD
- State GDP YoY
- ▲ 2.97%
- F500 in state
- 12
Industry mix (Fortune 500 HQ in MD)
| Industry | F500 HQs | Revenue |
|---|---|---|
| Aerospace / Defense | 1 | $71B |
|
||
| Utilities | 1 | $25B |
|
||
| Hotels | 1 | $24B |
|
||
| Consumer Goods | 1 | $7B |
|
||
| Real Estate | 1 | $6B |
|
||
| Chemicals | 1 | $2B |
|
||
Price history
+255.8% since first listed50 events — show timeline
- 2026-03-24 Listing Removed — BRIGHT MLS
- 2026-03-24 Listed $169,000 BRIGHT MLS
- 2025-10-21 Listed $179,000 BRIGHT MLS
- 2025-10-08 Coming Soon — BRIGHT MLS
- 2012-06-21 Sold (MLS) $36,915 BRIGHT MLS
- 2012-06-21 Sold (MLS) $36,915 MRIS
- 2012-04-30 Pending — MRIS
- 2012-04-30 Listing Removed — BRIGHT MLS
- 2012-04-20 Price Changed $35,000 MRIS
- 2012-04-19 Relisted — MRIS
- 2012-03-24 Delisted — MRIS
- 2012-02-27 Price Changed $42,900 MRIS
- 2012-01-23 Price Changed $47,900 MRIS
- 2011-12-31 Relisted — MRIS
- 2011-12-24 Delisted — MRIS
- 2011-12-23 Listed $49,900 MRIS
- 2011-12-23 Listed $35,000 BRIGHT MLS
- 2011-07-26 Delisted — MRIS
- 2011-07-26 Listing Removed — BRIGHT MLS
- 2011-06-16 Relisted — MRIS
- 2011-06-16 Price Changed — MRIS
- 2011-02-09 Pending — MRIS
- 2011-01-01 Relisted — MRIS
- 2010-10-13 Delisted — MRIS
- 2010-09-04 Listed — MRIS
- 2010-09-03 Listed $45,000 BRIGHT MLS
- 2010-06-01 Delisted — MRIS
- 2010-06-01 Listing Removed — BRIGHT MLS
- 2009-12-15 Price Changed — MRIS
- 2009-12-12 Price Changed — MRIS
- 2009-12-09 Relisted — MRIS
- 2009-12-01 Delisted — MRIS
- 2009-05-28 Relisted — MRIS
- 2009-05-28 Price Changed — MRIS
- 2009-05-01 Delisted — MRIS
- 2009-03-26 Price Changed — MRIS
- 2008-12-05 Price Changed — MRIS
- 2008-10-24 Listed — MRIS
- 2008-10-24 Listed $115,200 BRIGHT MLS
- 2005-11-01 Sold (Public Records) $141,000 Public Records
- 2005-10-25 Sold (MLS) $137,900 MRIS
- 2005-10-03 Delisted — MRIS
- 2005-09-02 Listed $141,900 MRIS
- 2005-07-29 Sold (Public Records) $75,000 Public Records
- 2005-07-29 Sold (Public Records) $75,000 Public Records
- 2005-07-15 Sold (MLS) $75,000 MRIS
- 2005-05-28 Delisted — MRIS
- 2005-05-23 Listed $71,000 MRIS
- 1981-04-14 Sold (Public Records) $47,368 Public Records
- 1978-09-29 Sold (Public Records) $47,500 Public Records
Property tax history
+2.0%/yrLatest (2025): $1,422 · +15.1% YoY. Source: county tax records.
Cash-flow waterfall
monthlySold comps — $/sqft
last 12 mo · ≤1 miLoading sold comps…