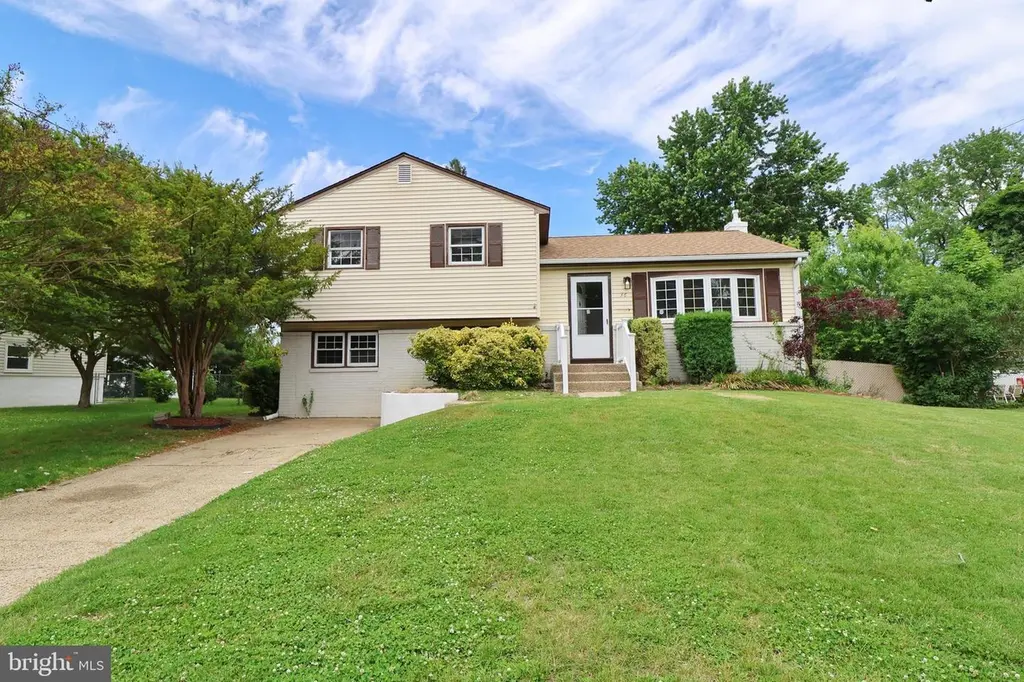
36 Hilton Rd · Jobstown, NJ
Flood risk 1/10 · Minimal
- FEMA flood zone
- X (unshaded)
- Chance of flooding over 30 yrs
- 0.0%
- Est. flood insurance / yr
- $507 – $1,088
Fire risk 1/10 · Minimal
- Est. fire insurance / yr
- $526 – $976
Heat risk 6/10 · Moderate
- Hot days now (above 104°F)
- 7 days/yr
- Hot days in 30 yrs
- 15 days/yr
Wind risk 6/10 · Moderate
- Chance of severe wind over 30 yrs
- 56.0%
Air-quality risk 4/10 · Minor
- Unhealthy air days now
- 5 days/yr
- Unhealthy air days in 30 yrs
- 7 days/yr
Risk factors via First Street. Map © Google.
Why this score? — see what drove the D+ grade
The composite is a weighted blend of 9 inputs, each scored 0–100. Each bar is that input's sub-score; the figure is the points it added to the 100-point composite (weight × sub-score).
- Cash flow +15.4/30.0
- ARV discount +10.8/15.0
- 1% rule +4.7/10.0
- DSCR +4.7/10.0
- Schools +3.4/10.0
- Rent growth +2.9/5.0
- Livability +2.5/5.0
- Condition / age +2.5/5.0
- Appreciation +0.0/10.0
$389,900
🖨 Deal sheet (PDF) 📄 Offer letter ✓ Due diligence
Listing remarks
Recently updated and completely move-in ready, this charming 3-bedroom, 1.5-bath split-level is just waiting for you to call it home! Inside, you'll find nearly 1,700 square feet of bright, sun-drenched living space featuring a fresh neutral palette and durable LVP flooring throughout. The updated kitchen is a chef’s delight, boasting crisp white cabinetry, a gas range, and ample counter space for meal prep. Its seamless flow into the dining area ensures you're always part of the conversation. Entertaining is a breeze thanks to the expansive, open-concept living and dining rooms. Upstairs, all three spacious bedrooms feature ceiling fans and share a pristine hall bath with a tub/showe
Key facts
- Updated kitchen
- Open-concept living
- Gas range
Tags
Property features AI
Exterior
- Parking: Driveway
- Utilities: Public water; Public sewer; Electric service (100 amp) available; Natural gas available; Hot water: natural gas
- Home design: Detached property; Main entrance faces south
- Construction: Vinyl siding; Block foundation; Building not winterized
- Exterior features: Patio(s); Gutter system
Interior
- Kitchen: Dishwasher; Gas oven/range; Range hood; Refrigerator
- Bedrooms: Three bedrooms on the upper level
- Flooring: Luxury vinyl plank; Ceramic tile
- Bathrooms: One full bathroom; One half bathroom
- Heating & cooling: Central heating (natural gas); Central air conditioning
- Interior features: Ceiling fans; Combination dining/living area; Traditional floor plan; Eat-in kitchen; Basement (unfinished)
- Laundry & utility: Laundry located in the basement
Neighborhood map
What this means for you Summary
Snapshot
- This is a 3-bed/1.5-bath single-family listed at $390k.
Deal economics
- At list price, monthly cash flow is $152 ($2k/yr) — positive.
- The deal already cash-flows at list — no discount required.
- To meet the 1% rule (rent ≥ 1% of price), the offer needs to be $377k (3.2% below list).
- Recommended offer: $377k (3.2% below list) — sets the bar for 1% rule.
- Cap rate 6.8% vs local median 1.9% in Jobstown — top-decile yield for the area; either an underpriced asset or a hidden risk that comps aren't pricing in. Stress-test before assuming the spread holds.
Location & tenants
- Location reads: area grade D — affects rentability + tenant quality, not the cash-flow math above.
- Rancocas Valley Regional High School District (suburban): math 29% / reading 49% proficiency, ranked #236 of 472 in NJ (top 50%) — families likely to look elsewhere, expect single-tenant / working-renter base with shorter leases.
- Market conditions: Rents rising (+1.4%/yr); 135 active listings in the ZIP; 12 comparable units currently listed for rent nearby; rentals leasing fast (median 0d on market — plan ~1-2 weeks tenant-placement turnaround); solid renter incomes; 2,161 units permitted in Burlington County in 2024 (988 in 5+ unit buildings).
- This rent runs 41% of the median local income ($109k/yr) — at the standard rent-burdened threshold; future hikes will face affordability resistance.
Forward outlook
- Local home prices are declining (-3.0%/yr); year-one equity from $3k of loan paydown is wiped out by about $12k of value loss. Plan a longer hold.
- Burlington County population projected to shrink 5% by 2050 — rents likely to lag national; underwrite the cash flow, not the appreciation.
Negotiation context
- Only 10 days on market — expect competitive offers; lowballing is unlikely to land.
- 4 sale attempts since 19y ago with the ask held roughly flat each time — persistent listings suggest the price (not the market) is what's stuck; bring a comps-based counter.
- Current owner paid $270k; 44% above their basis — modest negotiation headroom, anchor on the comps not their cost.
Risks & watch-outs
- Watch-outs: built in 1956 — expect roof / HVAC / electrical / plumbing capex.
- Climate carrying-cost: major wind risk, 56% chance of damaging wind over 30y; extreme-heat days projected 7→15/yr by 2055 (HVAC capex compounding) — expect insurance premiums to compound above CPI over the hold.
Questions for the listing agent
- Built in 1956 — when were the roof, HVAC, electrical panel, plumbing, and water heater last replaced?
- Is there a deadline driving the sale (1031 exchange, divorce, estate, relocation)? That informs how much negotiation room exists.
- The area grade is low — what's the realistic commute time and amenity access for the typical tenant pool here? Any planned neighborhood developments (good or bad) we should know about?
- What's the average days-on-market for RENTAL listings here right now (not sales)? A rising rental-DOM trend means longer vacancies and softer asking-rent achievability than the comps imply.
- What's the recent tenant-quality profile in this submarket — average credit score on applications, eviction rate, late-payment / NSF rate, and stable-employment percentage? A property-management company in the area should have these aggregated.
- How much new for-sale + rental construction is in the pipeline within 1–3 miles? Heavy new supply typically softens prices + rents 12–24 months out; constrained supply supports both.
Investment metrics
- 1% rule
- 0.97% ✗
- Cap rate
- 6.76%
- Cash-on-cash
- 1.67%
- DSCR
- 1.07
- GRM
- 8.6
CMA / ARV
- ARV (on-the-fly)
- $420,864
- Comps found
- 12
Show comp detail 12 sales within ~0.75 mi
| Address | Dist | Beds/Ba | Sqft | Sold | Price | $/sf | Match |
|---|---|---|---|---|---|---|---|
| 237 Front St | 0.07mi | 3/1.5 | 1,644 (0%) | 8mo | $366,000 | $223 | 90 |
| 38 Tinker Dr | 0.20mi | 4/2.0 (+1) | 1,663 (+1%) | 4mo | $460,000 | $277 | 78 |
| 216 Blue Jay Ln | 0.52mi | 3/1.0 | 1,685 (+2%) | 4mo | $335,000 | $199 | 66 |
| 200 Front St | 0.20mi | 4/2.0 (+1) | 1,444 (-12%) | 6mo | $406,000 | $281 | 58 |
| 142 Cherry St | 0.63mi | 3/1.5 | 1,508 (-8%) | 1mo | $170,000 | $113 | 56 |
| 7 Ridgley St | 0.47mi | 3/2.0 | 1,500 (-9%) | 7mo | $438,000 | $292 | 56 |
| 207 Canary Ln | 0.59mi | 3/1.5 | 1,802 (+10%) | 1mo | $369,900 | $205 | 55 |
| 76 Branch St | 0.71mi | 3/1.5 | 1,563 (-5%) | 4mo | $436,000 | $279 | 55 |
| 1010 Woodlane Rd | 0.52mi | 4/2.0 (+1) | 1,760 (+7%) | 6mo | $450,000 | $256 | 52 |
| 619 Holly Ln | 0.53mi | 2/1.5 (-1) | 1,421 (-14%) | 4mo | $280,000 | $197 | 44 |
| 43 Mount Holly Ave | 0.73mi | 4/2.5 (+1) | 1,779 (+8%) | 9mo | $400,000 | $225 | 36 |
| 710 Smith Ln | 0.63mi | 3/2.0 | 1,409 (-14%) | 10mo | $365,000 | $259 | 36 |
Match score weights: distance 35% · size 25% · config 20% · recency 20%. Top-matched comps best support the ARV.
Projected returns pro-forma
-3.0% appreciation · 1.42% rent growth · sell at horizon
- IRR
- -15.5%
- Equity multiple
- 0.46×
- Total profit
- $-59,279
- Equity at exit
- $58,135
- IRR
- -10.0%
- Equity multiple
- 0.43×
- Total profit
- $-62,076
- Equity at exit
- $33,711
Cash invested: $109,172 (down + closing). Projections, not guarantees.
Landlord ↔ Tenant lean methodology
- Overall (STATE)
- 21 Tenant-Leaning
- State New Jersey
- 21 Tenant-Leaning · D+6
- County
- — inherits STATE
- City
- — inherits STATE
ZIP-level market 08060
- Home prices YoY
- -34.5%
- Rents YoY
- 1.4%
- Active inventory
- 135
- Price-to-rent
- 8.6×
Monthly cashflow live
- Estimated rent
- $3,772 high interval (Pro) →
- Mortgage (P&I)
- −$2,045
- Tax from tax record
- −$621 /mo · $7,456/yr
- Insurance
- −$162
- HOA
- −$0
- Vacancy / Maint / Mgmt
- −$792
- Net cashflow
- $152
Break-even live
Sensitivity live
| Price | -10% $372 | -5% $262 | +0% $152 | +5% $41 | +10% $-69 |
|---|---|---|---|---|---|
| Rent | -10% $-146 | -5% $3 | +0% $152 | +5% $301 | +10% $450 |
| Rate | -1.0pp $348 | -0.5pp $251 | base $152 | +0.5pp $51 | +1.0pp $-52 |
UW: 25.0% down · 7.5% · 30yr · 1.5% tax · 5.0% vac · 8.0% maint · 8.0% mgmt
Financing live
Cash to close
- Down payment
- $97,475
- Closing costs
- $11,697
- Reserves months
- —
- Total cash needed
- —
Loan-product check · same deal, 3 products live
Conventional
25% down · 7.5% · 30yr
- Down + closing
- —
- Monthly P&I
- —
- Monthly cashflow
- —
- DSCR
- —
- Eligible?
- —
Personal DTI + credit; lowest rate.
DSCR
20% down · 8.5% · 30yr
- Down + closing
- —
- Monthly P&I
- —
- Monthly cashflow
- —
- DSCR
- —
- Eligible?
- —
No personal income docs; deal must DSCR.
Hard money
10% down · 12.0% · 12mo
- Down + closing
- —
- Monthly P&I
- —
- Monthly cashflow
- —
- DSCR
- —
- Eligible?
- —
Short-term bridge; refi at stabilization.
Rent comps 12 comps
| Address | Beds | Baths | Sqft | Rent | $/sqft | DOM | Units | Dist |
|---|---|---|---|---|---|---|---|---|
| 209 Front St Mount Holly, NJ | 4.0 | 2.5 | 1500 | $4,950 | $3.30 | 0d | 1 | 0.11mi |
| 3a Hunter Cir Eastampton Township, NJ | 1.0–2.0 | 1.0–1.5 | 865 | $2,255 | $2.61 | 0d | 25 | 0.65mi |
| 64 Regency Dr Mt Holly, NJ | 1.0–3.0 | 1.0–2.0 | 1066 | $2,800 | $2.63 | 0d | 1 | 0.66mi |
| 209 Mill St Mount Holly, NJ | 3.0 | 1.5 | 1274 | $2,400 | $1.88 | 2d | 1 | 0.82mi |
| 12000 Hamilton Way Eastampton Township, NJ | 1.0–2.0 | 1.0–2.5 | 1100 | $2,894 | $2.63 | 0d | 12 | 0.87mi |
| 1 Kirby Ct Mt Holly, NJ | 1.0–3.0 | 1.0–2.5 | 1349 | $3,125 | $2.32 | 0d | 13 | 0.87mi |
| 10 Stanton Rd Mount Holly, NJ | 3.0 | 2.5 | 2208 | $3,300 | $1.49 | 0d | 1 | 0.88mi |
| 302 Barrington Ct Mt Holly, NJ | 1.0–3.0 | 1.0–2.5 | 1226 | $2,959 | $2.41 | 0d | 11 | 0.97mi |
| 37 Church St Mount Holly, NJ | 3.0 | 1.5 | 1900 | $2,370 | $1.25 | 11d | 1 | 1.01mi |
| 501 Bloomfield Dr Westampton, NJ | 4.0 | 2.0 | 1975 | $4,950 | $2.51 | 0d | 1 | 1.15mi |
| 502 Bloomfield Dr Westampton, NJ | 4.0 | 3.0 | 1666 | $4,950 | $2.97 | 0d | 1 | 1.17mi |
| 144 Washington St Unit C Mt Holly, NJ | 3.0 | 1.0 | 1450 | $2,370 | $1.63 | 16d | 1 | 1.22mi |
Listing history 8 events
-
2026-06-21days on market $389,900 Active 10 DOM
-
2026-06-18days on market $389,900 Active 7 DOM
-
2026-06-17days on market $389,900 Active 6 DOM
-
2026-06-16days on market $389,900 Active 5 DOM
-
2026-06-15days on market $389,900 Active 4 DOM
-
2026-06-13days on market $389,900 Active 2 DOM
-
2026-06-13remarks 693-char remark
-
2026-06-13$389,900 Active 1 DOM
ⓘ Source: listings_history table (triggers on properties + properties_extension) + one-shot
backfill from property_details.listing_events for pre-trigger history.
Tax reassessment forecast NJ · Partial reset (capped growth)
- Current annual tax
- $7,456 · $621/mo
- Projected year-2 tax
- $8,582 · $715/mo
- Expected delta
- +$1,126/yr (+$94/mo · 15.1%)
ⓘ Screening estimate from a state-policy table — verify with the county assessor before closing.
Climate risk First Street
- Flood 1/10 Low FEMA zone X (unshaded) · 0% chance over 30 yrs
- Wildfire 1/10 Low
- Heat 6/10 Major 7 d/yr ≥104°F today · 15 d/yr by 30 yrs out
- Wind 6/10 Major 56% chance of damaging wind over 30 yrs
- Air quality 4/10 Moderate 5 unhealthy d/yr today · 7 by 30 yrs out
Nearby sold comps map
Loading sold comps map…
Walkable amenities ~0.75 mi
Loading nearby amenities…
Taxation est. · year 1
- Rental income
- $45,270
- − Mortgage interest
- −$21,840
- − Property taxes
- −$7,456
- − Insurance
- −$1,950
- − Repairs & maintenance
- −$3,622
- − Management
- −$3,622
- − Depreciation
- −$11,343
- Taxable loss
- −$4,562
- Est. tax savings @ 24.0%
- +$1,095
- After-tax cash flow
- $2,916/yr
For passive investors: Depreciation is non-cash, so a rental often shows a tax loss while cash-flowing — sheltering income. Rental losses are passive: they offset passive income freely, and up to $25,000/yr can offset ordinary (W-2) income if you actively participate and your MAGI is under $100k (phasing out to $0 by $150k); unused losses carry forward. On sale, claimed depreciation is recaptured at up to 25%, and gains may owe capital-gains tax (a 1031 exchange can defer both). Figures are a year-1 estimate at your 24.0% rate — not tax advice; consult a CPA.
Schools (NCES district)
- District
- Rancocas Valley Regional High School District
- NCES district ID
- 3413620
- Math proficiency
- 29% ▼ -18.00%
- Reading proficiency
- 49% ▼ -4.00%
- Median HH income
- $58,992
- Composite
- 34.45/100
- National rank
- #5195
- State rank
- #236 of 472 in NJ
Livability — Jobstown
No livability data for this city. (Only ~50 U.S. cities are tracked.)
Census & demographics
- County
- Burlington County · 323,710 people
- City population
- 788
- Metro
- Philadelphia-Camden-Wilmington, PA-NJ-DE-MD
- Population (ZIP)
- 25,835
- Household income
- $109,292
- Rent vs Own
- Severe rent burden
- 562.0
Population outlook (Burlington County) Hauer SSP2
- Today (2025)
- 453,425 people
- By 2030
- 452,359 · -0.2%
- By 2040
- 445,033 · -1.9%
- By 2050
- 431,760 · -4.8%
- By 2075
- 406,277 · -10.4%
- By 2100
- 364,732 · -19.6%
Race, ethnicity, and origin ACS 2023
- Neighborhood character
- Diverse neighborhood (Simpson 0.68)
- Race & ethnicity
- White 49% Black 25% Two or more races 15% Hispanic / Latino 13% Asian 4%
- Hispanic origin (detail)
- Mexican 2% Puerto Rican 7%
- Common ancestry
- Romanian 4% Lithuanian 2% Italian 1%
- Foreign-born
- 11% · Canada, Dominican Republic, China
- Languages at home
- 87% English-only · Spanish 7% Other Indo-European 2% French/Haitian/Cajun 1%
Political lean MEDSL · Burlington
- 2024 margin
- D (+16.6) · D 57.6% · R 41.0% · Other 1.3%
- 2008→2024 swing
- -2.0pp toward R · 2008: 18.6pp · 2024: 16.6pp
- All cycles
- 2024: D+16.6 2020: D+19.5 2016: D+14.8 2012: D+18.7 2008: D+18.6
Not yet ingested
- Civics
- —
Market trends
- HPI YoY
- ▼ -156.50%
- Current HPI
- 296.564
- Rent YoY
- ▲ 1.42%
- Metro
- Philadelphia-Camden-Wilmington, PA-NJ-DE-MD
- State GDP YoY
- ▲ 2.05%
- F500 in state
- 34
Industry mix (Fortune 500 HQ in NJ)
| Industry | F500 HQs | Revenue |
|---|---|---|
| Consumer Goods | 3 | $31B |
|
||
| Pharmaceuticals | 2 | $153B |
|
||
| Technology | 2 | $21B |
|
||
| Insurance | 2 | $20B |
|
||
| Healthcare | 2 | $19B |
|
||
| Financial Services | 1 | $70B |
|
||
Price history
+862.7% since first listed12 events — show timeline
- 2026-06-11 Listed $389,900 BRIGHT MLS
- 2016-04-19 Listing Removed — BRIGHT MLS
- 2015-02-20 Listed $134,900 BRIGHT MLS
- 2014-11-27 Listing Removed — BRIGHT MLS
- 2014-05-30 Listed $139,900 BRIGHT MLS
- 2007-12-13 Sold (Public Records) $270,000 Public Records
- 2007-09-14 Sold (MLS) $265,000 BRIGHT MLS
- 2007-08-07 Listing Removed — BRIGHT MLS
- 2007-06-08 Listed $265,000 BRIGHT MLS
- 1984-10-31 Sold (Public Records) $65,000 Public Records
- 1984-10-01 Sold (Public Records) $65,000 Public Records
- 1978-06-01 Sold (Public Records) $40,500 Public Records
Property tax history
+1.4%/yrLatest (2025): $7,456 · +6.6% YoY. Source: county tax records.
Cash-flow waterfall
monthlySold comps — $/sqft
last 12 mo · ≤1 miLoading sold comps…