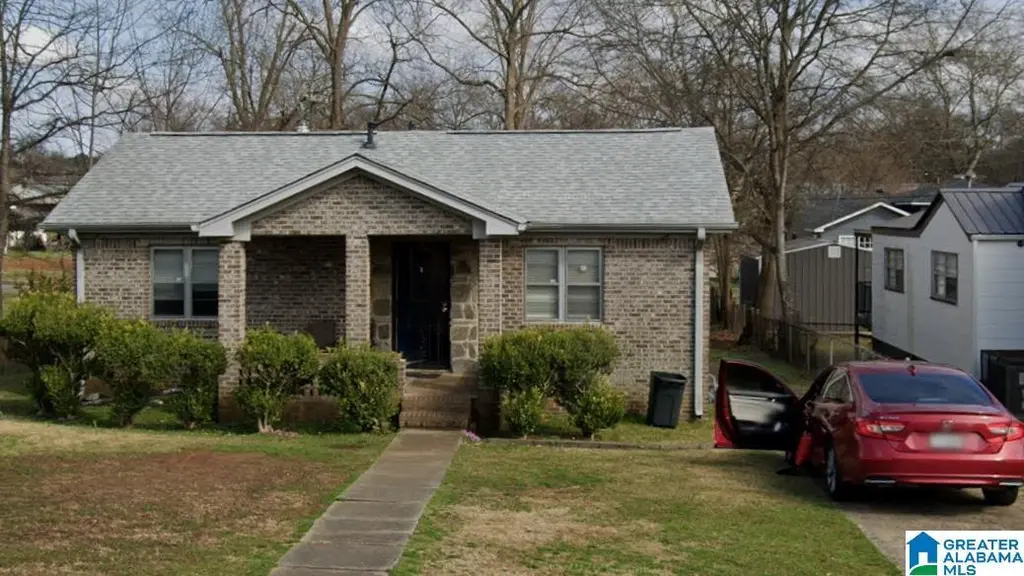
937 21st St SW · Birmingham, AL
Flood risk 1/10 · Minimal
- FEMA flood zone
- X (unshaded)
- Chance of flooding over 30 yrs
- 0.0%
- Est. flood insurance / yr
- $507 – $1,088
Fire risk 1/10 · Minimal
- Est. fire insurance / yr
- $916 – $1,700
Heat risk 6/10 · Moderate
- Hot days now (above 106°F)
- 7 days/yr
- Hot days in 30 yrs
- 19 days/yr
Wind risk 6/10 · Moderate
- Chance of severe wind over 30 yrs
- 27.0%
Air-quality risk 4/10 · Minor
- Unhealthy air days now
- 5 days/yr
- Unhealthy air days in 30 yrs
- 5 days/yr
Risk factors via First Street. Map © Google.
Why this score? — see what drove the B- grade
The composite is a weighted blend of 9 inputs, each scored 0–100. Each bar is that input's sub-score; the figure is the points it added to the 100-point composite (weight × sub-score).
- Cash flow +30.0/30.0
- DSCR +10.0/10.0
- 1% rule +8.4/10.0
- ARV discount +7.5/15.0
- Livability +3.4/5.0
- Rent growth +2.5/5.0
- Condition / age +2.5/5.0
- Schools +0.9/10.0
- Appreciation +0.0/10.0
$89,900
🖨 Deal sheet (PDF) 📄 Offer letter ✓ Due diligence
Listing remarks
Nice starter home or a great investment property. This all brick 3 bedroom 1 bath home has been updated with newer paint, flooring and HVAC. Home has a second building, also all brick, in back.
Key facts
- All brick
- Updated flooring
- Updated hvac
Tags
Property features AI
Finance
- Other: Lot size approximately 0.18 acres; Subdivision: Maplehurst
- HOA & community: No association fee
Exterior
- Parking: Driveway parking; On-street parking
- Utilities: Public water; Connected sewer; Electric water heater; Internet service availability (provider TBD)
- Home design: Single-story living spaces (all listed rooms on main level); Existing construction; 4-side brick exterior
- Construction: Crawl space foundation
- Exterior features: Open patio; Storage building; No pool; No garden/yard features listed; Not waterfront
Interior
- Kitchen: Laminate countertops; Kitchen on main level
- Bedrooms: Three bedrooms on the main level
- Flooring: Hardwood and laminate flooring
- Bathrooms: One full bathroom with tub/shower combo
- Heating & cooling: Central heating; Central cooling
- Interior features: Ceilings: Other (see remarks); No special interior features listed
- Laundry & utility: Washer hookup; Electric dryer hookup; Laundry located on the main level in a closet
Neighborhood map
What this means for you Summary
Snapshot
- This is a 3-bed/1.0-bath single-family listed at $90k.
Deal economics
- At list price, monthly cash flow is $368 ($4k/yr) — positive.
- The deal already cash-flows at list — no discount required.
- Meets the 1% rule at list price ($1k rent vs $90k).
- Recommended offer: $89k (1.5% below list) — sets the bar for market timing.
- Cap rate 11.2% vs local median 6.2% in Birmingham — top-decile yield for the area; either an underpriced asset or a hidden risk that comps aren't pricing in. Stress-test before assuming the spread holds.
Location & tenants
- Location reads 67/100 on livability (#78 in AL) — a middle-class / working-renter tenant base. Strengths: commute A+, cost of living A+, housing A+; Watch: amenities C-, crime F, employment F.
- Birmingham City (urban): math 4% / reading 20% proficiency, ranked #116 of 129 in AL (top 90%) — low school quality limits family demand, transient renter base, plan for 1-2y turnover; 82% free/reduced lunch — lower-income household profile, screen leases tightly.
- Zoned schools: West End Academy (math 2% / reading 12%, grade F, #601 of 627 statewide, top 98%, 503 students, 81% FRL); Wenonah High School (math 2% / reading 2%, grade F, #291 of 305 statewide, top 100%, 656 students, 85% FRL) — zoned schools at 83% FRL track the district average.
- Market conditions: Rents soft (-0.0%/yr); 155 active listings in the ZIP; 40 comparable units currently listed for rent nearby; rentals lingering (median 46d on market — plan ~5-8 weeks vacancy on turnover, expect pricing pressure); 50% of comp listings sitting > 30 days — soft ceiling on asking rent; lower-income renter base — watch delinquency; 2,114 units permitted in Jefferson County in 2024 (556 in 5+ unit buildings).
- This rent runs 41% of the median local income ($35k/yr) — at the standard rent-burdened threshold; future hikes will face affordability resistance.
Forward outlook
- Local home prices are declining (-3.0%/yr); year-one equity from $622 of loan paydown is wiped out by about $3k of value loss. Plan a longer hold.
- Jefferson County population projected to shrink 4% by 2050 — rents likely to lag national; underwrite the cash flow, not the appreciation.
- At projected returns (-3.0% appreciation + 0.0% rent growth), your $25k cash investment doubles in ~10 years — after that, you're playing with house money.
Negotiation context
- It's been on market 20 days — a 2% lower offer ($89k) is reasonable based on typical stale-listing flexibility.
Risks & watch-outs
- Watch-outs: built in 1950 — expect roof / HVAC / electrical / plumbing capex.
- Climate carrying-cost: major wind risk, 27% chance of damaging wind over 30y; extreme-heat days projected 7→19/yr by 2055 (HVAC capex compounding) — expect insurance premiums to compound above CPI over the hold.
Questions for the listing agent
- Built in 1950 — when were the roof, HVAC, electrical panel, plumbing, and water heater last replaced?
- Is there a deadline driving the sale (1031 exchange, divorce, estate, relocation)? That informs how much negotiation room exists.
- Schools are F-rated, which usually means shorter tenancies and higher turnover. Who's the typical renter profile here, and what's been the actual vacancy rate?
- Crime grade is F in this area — have there been break-ins, vandalism, or insurance claims at this property in the last 3 years? What carrier currently insures it and at what premium?
- What's the average days-on-market for RENTAL listings here right now (not sales)? A rising rental-DOM trend means longer vacancies and softer asking-rent achievability than the comps imply.
- What's the recent tenant-quality profile in this submarket — average credit score on applications, eviction rate, late-payment / NSF rate, and stable-employment percentage? A property-management company in the area should have these aggregated.
- How much new for-sale + rental construction is in the pipeline within 1–3 miles? Heavy new supply typically softens prices + rents 12–24 months out; constrained supply supports both.
Investment metrics
- 1% rule
- 1.34% ✓
- Cap rate
- 11.21%
- Cash-on-cash
- 17.57%
- DSCR
- 1.78
- GRM
- 6.2
CMA / ARV
- ARV (on-the-fly)
- $50,490
- Comps found
- 12
Show comp detail 12 sales within ~0.75 mi
| Address | Dist | Beds/Ba | Sqft | Sold | Price | $/sf | Match |
|---|---|---|---|---|---|---|---|
| 700 18th Place Ln SW | 0.34mi | 3/2.0 | 1,152 (+3%) | 3mo | $100,833 | $88 | 73 |
| 2526 SW Lee Ave | 0.39mi | 3/1.5 | 1,095 (-2%) | 6mo | $18,000 | $16 | 71 |
| 1744 Lincoln Pl SW | 0.56mi | 3/1.0 | 1,140 (+2%) | 1mo | $99,000 | $87 | 70 |
| 1311 18th Way SW | 0.30mi | 3/1.0 | 979 (-13%) | 4mo | $20,500 | $21 | 61 |
| 1228 19th Pl SW | 0.26mi | 3/1.0 | 978 (-13%) | 8mo | $66,500 | $68 | 60 |
| 1657 19th Pl | 0.69mi | 3/1.0 | 1,074 (-4%) | 3mo | $40,000 | $37 | 58 |
| 2200 Fulton Ave SW | 0.53mi | 2/1.0 (-1) | 1,205 (+7%) | 7mo | $42,000 | $35 | 53 |
| 213 SW 22nd St | 0.47mi | 3/1.0 | 1,260 (+12%) | 8mo | $110,000 | $87 | 51 |
| 2724 Lee Ave SW | 0.52mi | 3/1.0 | 960 (-14%) | 1mo | $72,000 | $75 | 51 |
| 201 21st St SW | 0.51mi | 3/2.0 | 1,258 (+12%) | 8mo | $30,000 | $24 | 46 |
| 1524 Elm St SW | 0.70mi | 3/1.0 | 960 (-14%) | 1mo | $43,000 | $45 | 42 |
| 4929 Avenue R | 0.73mi | 2/1.0 (-1) | 962 (-14%) | 5mo | $43,000 | $45 | 33 |
Match score weights: distance 35% · size 25% · config 20% · recency 20%. Top-matched comps best support the ARV.
Projected returns pro-forma
-3.0% appreciation · 0.0% rent growth · sell at horizon
- IRR
- 5.7%
- Equity multiple
- 1.21×
- Total profit
- $5,363
- Equity at exit
- $13,404
- IRR
- 12.3%
- Equity multiple
- 1.84×
- Total profit
- $21,214
- Equity at exit
- $7,773
Cash invested: $25,172 (down + closing). Projections, not guarantees.
Landlord ↔ Tenant lean methodology
- Overall (STATE)
- 90 Strongly Landlord-Friendly
- State Alabama
- 90 Strongly Landlord-Friendly · R+15
- County
- — inherits STATE
- City
- — inherits STATE
ZIP-level market 35211
- Rents YoY
- -0.0%
- Active inventory
- 155
- Price-to-rent
- 6.2×
Monthly cashflow live
- Estimated rent
- $1,206 high interval (Pro) →
- Mortgage (P&I)
- −$471
- Tax from tax record
- −$75 /mo · $903/yr
- Insurance
- −$37
- HOA
- −$0
- Vacancy / Maint / Mgmt
- −$253
- Net cashflow
- $368
Break-even live
Sensitivity live
| Price | -10% $419 | -5% $394 | +0% $368 | +5% $343 | +10% $318 |
|---|---|---|---|---|---|
| Rent | -10% $273 | -5% $321 | +0% $368 | +5% $416 | +10% $464 |
| Rate | -1.0pp $414 | -0.5pp $391 | base $368 | +0.5pp $345 | +1.0pp $321 |
UW: 25.0% down · 7.5% · 30yr · 1.5% tax · 5.0% vac · 8.0% maint · 8.0% mgmt
Financing live
Cash to close
- Down payment
- $22,475
- Closing costs
- $2,697
- Reserves months
- —
- Total cash needed
- —
Loan-product check · same deal, 3 products live
Conventional
25% down · 7.5% · 30yr
- Down + closing
- —
- Monthly P&I
- —
- Monthly cashflow
- —
- DSCR
- —
- Eligible?
- —
Personal DTI + credit; lowest rate.
DSCR
20% down · 8.5% · 30yr
- Down + closing
- —
- Monthly P&I
- —
- Monthly cashflow
- —
- DSCR
- —
- Eligible?
- —
No personal income docs; deal must DSCR.
Hard money
10% down · 12.0% · 12mo
- Down + closing
- —
- Monthly P&I
- —
- Monthly cashflow
- —
- DSCR
- —
- Eligible?
- —
Short-term bridge; refi at stabilization.
Rent comps 40 comps
| Address | Beds | Baths | Sqft | Rent | $/sqft | DOM | Units | Dist |
|---|---|---|---|---|---|---|---|---|
| 914 21st St SW Birmingham, AL | 3.0 | 1.0 | 784 | $1,200 | $1.53 | 23d | 1 | 0.09mi |
| 1209 19th Pl SW Birmingham, AL | 3.0 | 1.0 | 1050 | $1,275 | $1.21 | 46d | 1 | 0.19mi |
| 2304 Beulah Ave SW Birmingham, AL | 3.0 | 1.0 | 1283 | $1,025 | $0.80 | 4d | 1 | 0.21mi |
| 1228 19th Pl SW Birmingham, AL | 3.0 | 2.0 | 978 | $1,195 | $1.22 | 5d | 1 | 0.24mi |
| 1252 18th Pl SW Birmingham, AL | 3.0 | 1.0 | 950 | $1,000 | $1.05 | 18d | 1 | 0.27mi |
| 407 S Park Rd SW Birmingham, AL | 3.0 | 1.0 | 1050 | $900 | $0.86 | 46d | 1 | 0.28mi |
| 1319 18th Way SW Birmingham, AL | 4.0 | 2.0 | 1337 | $1,345 | $1.01 | 26d | 1 | 0.29mi |
| 2216 Lee Ave SW Birmingham, AL | 3.0 | 1.0 | 902 | $900 | $1.00 | 26d | 1 | 0.39mi |
| 312 25th St SW Birmingham, AL | 4.0 | 1.0 | 1159 | $1,000 | $0.86 | 26d | 1 | 0.42mi |
| 2026 Lee Ct SW Birmingham, AL | 3.0 | 1.0 | 1204 | $1,100 | $0.91 | 46d | 1 | 0.42mi |
| 612 26th St SW Birmingham, AL | 2.0 | 1.0 | 988 | $825 | $0.84 | 46d | 1 | 0.43mi |
| 2409 Garrison Ave SW Birmingham, AL | 4.0 | 2.0 | 1000 | $1,295 | $1.29 | 46d | 1 | 0.45mi |
| 2519 Saint Charles Ave SW Birmingham, AL | 2.0 | 1.0 | 990 | $975 | $0.98 | 46d | 1 | 0.47mi |
| 2028 Lee Ter SW Birmingham, AL | 2.0 | 1.0 | 884 | $695 | $0.79 | 46d | 1 | 0.51mi |
| 208 22nd St SW Birmingham, AL | 2.0 | 1.0 | 926 | $1,050 | $1.13 | 5d | 1 | 0.51mi |
| 1000 17th Pl SW Birmingham, AL | 3.0 | 2.0 | 1200 | $1,275 | $1.06 | 21d | 1 | 0.56mi |
| 2904 Garrison Ave SW Birmingham, AL | 4.0 | 2.0 | 952 | $1,050 | $1.10 | 26d | 1 | 0.59mi |
| 1537 18th St SW Birmingham, AL | 3.0 | 1.0 | 1049 | $1,130 | $1.08 | 46d | 1 | 0.60mi |
| 1544 18th St SW Birmingham, AL | 3.0 | 1.0 | 950 | $1,130 | $1.19 | 46d | 1 | 0.60mi |
| 1520 17th Way SW Birmingham, AL | 3.0 | 1.0 | 900 | $900 | $1.00 | 23d | 1 | 0.61mi |
| 1520 17th Way SW Birmingham, AL | 3.0 | 1.0 | 900 | $900 | $1.00 | 14d | 1 | 0.61mi |
| 1734 Lee Ave SW Birmingham, AL | 4.0 | 1.0 | 1142 | $1,150 | $1.01 | 21d | 1 | 0.61mi |
| 709 30th St SW Birmingham, AL | 3.0 | 1.0 | 1273 | $1,000 | $0.79 | 46d | 1 | 0.63mi |
| 2128 Mayfield Ave SW Birmingham, AL | 3.0 | 1.0 | 1196 | $1,200 | $1.00 | 26d | 1 | 0.65mi |
| 1728 Princeton Ave SW Birmingham, AL | 4.0 | 2.0 | 1334 | $1,300 | $0.97 | 46d | 1 | 0.65mi |
| 1816 Saint Charles Ave SW Birmingham, AL | 3.0 | 1.0 | 1395 | $1,295 | $0.93 | 26d | 1 | 0.69mi |
| 1669 19th Pl SW Birmingham, AL | 4.0 | 2.0 | 1373 | $1,325 | $0.97 | 26d | 1 | 0.71mi |
| 1933 Saint Charles Ct SW Birmingham, AL | 3.0 | 1.0 | 1106 | $1,050 | $0.95 | 26d | 1 | 0.72mi |
| 4929 Avenue R Unit R Birmingham, AL | 2.0 | 1.0 | 962 | $950 | $0.99 | 46d | 1 | 0.76mi |
| 2516 Powderly Ave SW Birmingham, AL | 3.0 | 1.0 | 1236 | $1,050 | $0.85 | 46d | 1 | 0.79mi |
| 1620 Alemeda Ave SW Birmingham, AL | 3.0 | 2.0 | 1314 | $1,295 | $0.99 | 4d | 1 | 0.82mi |
| 1781 51st Street Ensley Unit ENSLEY Birmingham, AL | 3.0 | 1.5 | 1069 | $950 | $0.89 | 46d | 1 | 0.84mi |
| 2709 Powderly Ave SW Birmingham, AL | 3.0 | 2.0 | 1056 | $950 | $0.90 | 26d | 1 | 0.84mi |
| 4825 Avenue S Birmingham, AL | 3.0 | 1.0 | 1310 | $1,050 | $0.80 | 18d | 1 | 0.85mi |
| 2005 Snavely Ave SW Birmingham, AL | 3.0 | 2.0 | 1380 | $1,150 | $0.83 | 46d | 1 | 0.87mi |
| 4813 Court S Birmingham, AL | 3.0 | 2.0 | 1118 | $1,125 | $1.01 | 46d | 1 | 0.88mi |
| 5211 Ter Q Unit Q Birmingham, AL | 2.0 | 1.0 | 756 | $775 | $1.03 | 46d | 1 | 0.89mi |
| 3116 Steiner Ave SW Birmingham, AL | 3.0 | 1.0 | 1362 | $1,200 | $0.88 | 46d | 1 | 0.91mi |
| 4801 Avenue S Birmingham, AL | 3.0 | 1.0 | 1310 | $1,000 | $0.76 | 46d | 1 | 0.91mi |
| 5320 Ter Q Unit Q Birmingham, AL | 3.0 | 2.0 | 1116 | $1,250 | $1.12 | 46d | 1 | 0.91mi |
Listing history 13 events
-
2026-06-22days on market $89,900 Active 20 DOM
-
2026-06-21days on market $89,900 Active 19 DOM
-
2026-06-18days on market $89,900 Active 16 DOM
-
2026-06-17days on market $89,900 Active 15 DOM
-
2026-06-16days on market $89,900 Active 14 DOM
-
2026-06-15days on market $89,900 Active 13 DOM
-
2026-06-13days on market $89,900 Active 11 DOM
-
2026-06-10days on market $89,900 Active 8 DOM
-
2026-06-09days on market $89,900 Active 7 DOM
-
2026-06-08days on market $89,900 Active 6 DOM
-
2026-06-07days on market $89,900 Active 5 DOM
-
2026-06-03remarks 193-char remark
-
2026-06-03$89,900 Active 1 DOM
ⓘ Source: listings_history table (triggers on properties + properties_extension) + one-shot
backfill from property_details.listing_events for pre-trigger history.
Tax reassessment forecast AL · Resets to sale price
- Current annual tax
- $903 · $75/mo
- Projected year-2 tax
- $903 · $75/mo
- Expected delta
- $0/yr ($0/mo · 0.0%)
ⓘ Screening estimate from a state-policy table — verify with the county assessor before closing.
Climate risk First Street
- Flood 1/10 Low FEMA zone X (unshaded) · 0% chance over 30 yrs
- Wildfire 1/10 Low
- Heat 6/10 Major 7 d/yr ≥106°F today · 19 d/yr by 30 yrs out
- Wind 6/10 Major 27% chance of damaging wind over 30 yrs
- Air quality 4/10 Moderate 5 unhealthy d/yr today · 5 by 30 yrs out
Nearby sold comps map
Loading sold comps map…
Walkable amenities ~0.75 mi
Loading nearby amenities…
Taxation est. · year 1
- Rental income
- $14,471
- − Mortgage interest
- −$5,036
- − Property taxes
- −$903
- − Insurance
- −$450
- − Repairs & maintenance
- −$1,158
- − Management
- −$1,158
- − Depreciation
- −$2,615
- Taxable income
- $3,152
- Est. tax owed @ 24.0%
- −$756
- After-tax cash flow
- $3,665/yr
For passive investors: Depreciation is non-cash, so a rental often shows a tax loss while cash-flowing — sheltering income. Rental losses are passive: they offset passive income freely, and up to $25,000/yr can offset ordinary (W-2) income if you actively participate and your MAGI is under $100k (phasing out to $0 by $150k); unused losses carry forward. On sale, claimed depreciation is recaptured at up to 25%, and gains may owe capital-gains tax (a 1031 exchange can defer both). Figures are a year-1 estimate at your 24.0% rate — not tax advice; consult a CPA.
Schools (NCES district)
- District
- Birmingham City
- NCES district ID
- 0100390
- Math proficiency
- 4% ▼ -17.00%
- Reading proficiency
- 20% ▼ -4.00%
- Median HH income
- $31,988
- Composite
- 9.49/100
- National rank
- #9850
- State rank
- #116 of 129 in AL
Livability — Birmingham
- Score
- 67/100
- State rank
- #78
- US rank
- #10412
Category grades
Schools grade is shown separately in the Schools card above.
Census & demographics
- Census place
- Birmingham, AL
- County
- Jefferson County · 527,445 people
- City population
- 210,422
- Metro
- Birmingham-Hoover, AL
- Population (ZIP)
- 24,924
- Household income
- $34,884
- Rent vs Own
- Severe rent burden
- 2161.0
Population outlook (Jefferson County) Hauer SSP2
- Today (2025)
- 669,185 people
- By 2030
- 669,694 · +0.1%
- By 2040
- 661,388 · -1.2%
- By 2050
- 643,086 · -3.9%
- By 2075
- 577,267 · -13.7%
- By 2100
- 474,758 · -29.1%
Race, ethnicity, and origin ACS 2023
- Neighborhood character
- Predominantly Black (77%)
- Race & ethnicity
- Black 77% White 10% Hispanic / Latino 10% Two or more races 4%
- Hispanic origin (detail)
- Mexican 7%
- Foreign-born
- 6% · Canada
- Languages at home
- 91% English-only · Spanish 8% French/Haitian/Cajun 1%
Political lean MEDSL · Jefferson
- 2024 margin
- D (+10.4) · D 54.6% · R 44.2% · Other 1.2%
- 2008→2024 swing
- +5.4pp toward D · 2008: 5.1pp · 2024: 10.4pp
- All cycles
- 2024: D+10.4 2020: D+13.2 2016: D+7.2 2012: D+6.0 2008: D+5.1
Not yet ingested
- Civics
- —
Market trends
- HPI YoY
- ▼ -49.29%
- Current HPI
- 91.2903
- Rent YoY
- ▬ -0.01%
- Metro
- Birmingham-Hoover, AL
- State GDP YoY
- ▲ 2.94%
- F500 in state
- 4
Industry mix (Fortune 500 HQ in AL)
| Industry | F500 HQs | Revenue |
|---|---|---|
| Financial Services | 1 | $8B |
|
||
| Healthcare | 1 | $5B |
|
||
Price history
1 event — show timeline
- 2026-06-02 Listed $89,900 Greater Alabama MLS
Property tax history
+12.8%/yrLatest (2025): $903 · -0.2% YoY. Source: county tax records.
Cash-flow waterfall
monthlySold comps — $/sqft
last 12 mo · ≤1 miLoading sold comps…