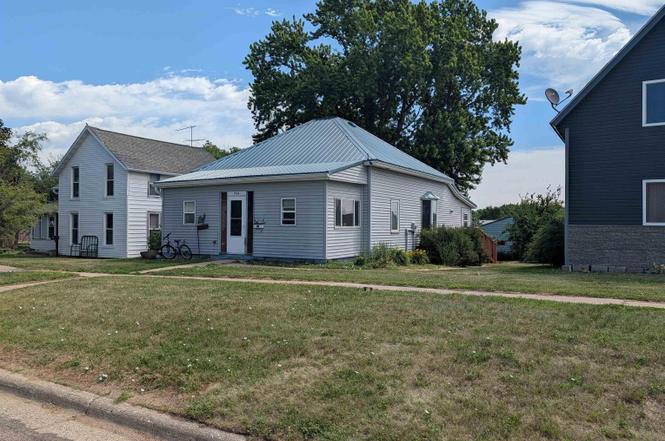
704 Ave H · Hawarden, IA
Flood risk 1/10 · Minimal
- FEMA flood zone
- X (unshaded)
- Chance of flooding over 30 yrs
- 0.0%
- Est. flood insurance / yr
- $473 – $860
Fire risk 4/10 · Minor
- Est. fire insurance / yr
- $902 – $1,676
Heat risk 3/10 · Minor
- Hot days now (above 103°F)
- 7 days/yr
- Hot days in 30 yrs
- 14 days/yr
Wind risk 2/10 · Minimal
- Chance of severe wind over 30 yrs
- —
Air-quality risk 2/10 · Minimal
- Unhealthy air days now
- 1 days/yr
- Unhealthy air days in 30 yrs
- 1 days/yr
Risk factors via First Street. Map © Google.
Why this score? — see what drove the C+ grade
The composite is a weighted blend of 9 inputs, each scored 0–100. Each bar is that input's sub-score; the figure is the points it added to the 100-point composite (weight × sub-score).
- ARV discount +15.0/15.0
- Cash flow +13.9/30.0
- Appreciation +10.0/10.0
- Schools +5.2/10.0
- DSCR +4.2/10.0
- Livability +3.8/5.0
- 1% rule +3.2/10.0
- Rent growth +2.5/5.0
- Condition / age +2.5/5.0
$125,000
🖨 Deal sheet (PDF) 📄 Offer letter ✓ Due diligence
Listing remarks
* * Charming Ranch Home Close to Downtown * * This cute ranch-style 2-bedroom home offers comfortable living, great updates, and a convenient location close to downtown. The inviting layout features an open-concept dining and living area, creating a spacious feel perfect for everyday living and entertaining. Enjoy the convenience of main-floor laundry, a full bathroom with a jetted tub/shower combination, and both front and back porches for relaxing and enjoying the outdoors. The home also features a durable steel roof, along with newer windows and electrical updates for added peace of mind. The unfinished basement provides great usable space with plenty of storage options, a functional
Key facts
- Electrical updates
- Newer windows
- Durable steel roof
Tags
Property features AI
Exterior
- Parking: Detached 2-car garage with garage door opener
- Utilities: Public water; Public sewer
- Home design: Single-family residential property
- Construction: Vinyl siding; Metal roof
- Exterior features: Deck; Porch
Interior
- Bathrooms: 1 full bathroom; 1 half bathroom
- Heating & cooling: Central air conditioning; Natural gas forced-air heating
- Interior features: Partial basement
Neighborhood map
What this means for you Summary
Snapshot
- This is a 2-bed/2.0-bath single-family listed at $125k.
Deal economics
- At list price, monthly cash flow is $14 ($166/yr) — positive.
- The deal already cash-flows at list — no discount required.
- To meet the 1% rule (rent ≥ 1% of price), the offer needs to be $102k (18.0% below list).
- Recommended offer: $102k (18.0% below list) — sets the bar for 1% rule.
Location & tenants
- Location reads 76/100 on livability (#201 in IA, #3,671 nationally) — a middle-class / working-renter tenant base. Strengths: crime A+, cost of living A+, housing A+; Watch: employment D, amenities F, commute F.
- West Sioux Community School District (rural): math 60% / reading 62% proficiency, ranked #239 of 289 in IA (top 83%) — acceptable for families but not a draw, mixed tenant base, ~2y average lease.
- Zoned schools: Hawarden Elementary School (math 62% / reading 57%, grade B-, #390 of 616 statewide, top 69%, 196 students, 61% FRL); West Sioux Middle School (math 62% / reading 57%, grade B, #185 of 246 statewide, top 78%, 168 students, 56% FRL); West Sioux High School (math 57% / reading 72%, grade B-, #211 of 336 statewide, top 70%, 265 students, 51% FRL).
- Market conditions: 14 active listings in the ZIP; 201 units permitted in Sioux County in 2024 (52 in 5+ unit buildings).
Forward outlook
- In year one you build about $13k of equity ($864 loan paydown + $12k appreciation (10.0% local appreciation)).
- Sioux County population projected at +6% by 2050 — modest demand growth; plan on rents tracking national, not racing it.
- At projected returns (10.0% appreciation + 3.0% rent growth), your $35k cash investment doubles in ~3 years — after that, you're playing with house money.
- By year 3, paydown + projected appreciation supports a ~$34k cash-out refi (75% LTV) — recoverable capital for the next deal without selling this one.
Negotiation context
- Only 6 days on market — expect competitive offers; lowballing is unlikely to land.
Risks & watch-outs
- Watch-outs: built in 1930 — expect roof / HVAC / electrical / plumbing capex.
Questions for the listing agent
- Built in 1930 — when were the roof, HVAC, electrical panel, plumbing, and water heater last replaced?
- Is there a deadline driving the sale (1031 exchange, divorce, estate, relocation)? That informs how much negotiation room exists.
- What's the average days-on-market for RENTAL listings here right now (not sales)? A rising rental-DOM trend means longer vacancies and softer asking-rent achievability than the comps imply.
- What's the recent tenant-quality profile in this submarket — average credit score on applications, eviction rate, late-payment / NSF rate, and stable-employment percentage? A property-management company in the area should have these aggregated.
- How much new for-sale + rental construction is in the pipeline within 1–3 miles? Heavy new supply typically softens prices + rents 12–24 months out; constrained supply supports both.
Investment metrics
- 1% rule
- 0.82% ✗
- Cap rate
- 6.43%
- Cash-on-cash
- 0.47%
- DSCR
- 1.02
- GRM
- 10.2
CMA / ARV
- ARV (on-the-fly)
- $151,008
- Comps found
- 5
Show comp detail 5 sales within ~0.75 mi
| Address | Dist | Beds/Ba | Sqft | Sold | Price | $/sf | Match |
|---|---|---|---|---|---|---|---|
| 1322 Avenue I | 0.57mi | 2/1.0 | 1,232 (+8%) | 1mo | $175,000 | $142 | 56 |
| 1420 Avenue F | 0.65mi | 3/1.5 (+1) | 1,139 (-0%) | 20mo | $41,000 | $36 | 45 |
| 1504 Avenue H | 0.67mi | 2/1.0 | 1,060 (-7%) | 13mo | $140,000 | $132 | 42 |
| 1511 Avenue I | 0.68mi | 2/2.0 | 1,264 (+10%) | 14mo | $175,000 | $138 | 39 |
| 722 1st St | 0.51mi | 3/1.0 (+1) | 1,219 (+7%) | 24mo | $77,500 | $64 | 36 |
Match score weights: distance 35% · size 25% · config 20% · recency 20%. Top-matched comps best support the ARV.
Projected returns pro-forma
10.0% appreciation · 3.0% rent growth · sell at horizon
- IRR
- 24.6%
- Equity multiple
- 2.97×
- Total profit
- $68,932
- Equity at exit
- $112,610
- IRR
- 21.8%
- Equity multiple
- 6.78×
- Total profit
- $202,249
- Equity at exit
- $242,848
Cash invested: $35,000 (down + closing). Projections, not guarantees.
Landlord ↔ Tenant lean methodology
- Overall (STATE)
- 83 Strongly Landlord-Friendly
- State Iowa
- 83 Strongly Landlord-Friendly · R+6
- County
- — inherits STATE
- City
- — inherits STATE
ZIP-level market 51023
- Home prices YoY
- 12.6%
- Active inventory
- 14
- Price-to-rent
- 10.2×
Monthly cashflow live
- Estimated rent
- $1,025 medium interval (Pro) →
- Mortgage (P&I)
- −$656
- Tax from tax record
- −$88 /mo · $1,060/yr
- Insurance
- −$52
- HOA
- −$0
- Vacancy / Maint / Mgmt
- −$215
- Net cashflow
- $14
Break-even live
Sensitivity live
| Price | -10% $85 | -5% $49 | +0% $14 | +5% $-22 | +10% $-57 |
|---|---|---|---|---|---|
| Rent | -10% $-67 | -5% $-27 | +0% $14 | +5% $54 | +10% $95 |
| Rate | -1.0pp $77 | -0.5pp $46 | base $14 | +0.5pp $-19 | +1.0pp $-52 |
UW: 25.0% down · 7.5% · 30yr · 1.5% tax · 5.0% vac · 8.0% maint · 8.0% mgmt
Financing live
Cash to close
- Down payment
- $31,250
- Closing costs
- $3,750
- Reserves months
- —
- Total cash needed
- —
Loan-product check · same deal, 3 products live
Conventional
25% down · 7.5% · 30yr
- Down + closing
- —
- Monthly P&I
- —
- Monthly cashflow
- —
- DSCR
- —
- Eligible?
- —
Personal DTI + credit; lowest rate.
DSCR
20% down · 8.5% · 30yr
- Down + closing
- —
- Monthly P&I
- —
- Monthly cashflow
- —
- DSCR
- —
- Eligible?
- —
No personal income docs; deal must DSCR.
Hard money
10% down · 12.0% · 12mo
- Down + closing
- —
- Monthly P&I
- —
- Monthly cashflow
- —
- DSCR
- —
- Eligible?
- —
Short-term bridge; refi at stabilization.
Listing history 6 events
-
2026-06-21days on market $125,000 Active 6 DOM
-
2026-06-21days on market $125,000 Active 5 DOM
-
2026-06-18days on market $125,000 Active 3 DOM
-
2026-06-17days on market $125,000 Active 2 DOM
-
2026-06-16remarks 699-char remark
-
2026-06-16$125,000 Active 1 DOM
ⓘ Source: listings_history table (triggers on properties + properties_extension) + one-shot
backfill from property_details.listing_events for pre-trigger history.
Tax reassessment forecast IA · Partial reset (capped growth)
- Current annual tax
- $1,060 · $88/mo
- Projected year-2 tax
- $1,511 · $126/mo
- Expected delta
- +$451/yr (+$38/mo · 42.6%)
ⓘ Screening estimate from a state-policy table — verify with the county assessor before closing.
Climate risk First Street
- Flood 1/10 Low FEMA zone X (unshaded) · 0% chance over 30 yrs
- Wildfire 4/10 Moderate
- Heat 3/10 Moderate 7 d/yr ≥103°F today · 14 d/yr by 30 yrs out
- Wind 2/10 Low
- Air quality 2/10 Low 1 unhealthy d/yr today · 1 by 30 yrs out
Nearby sold comps map
Loading sold comps map…
Walkable amenities ~0.75 mi
Loading nearby amenities…
Taxation est. · year 1
- Rental income
- $12,300
- − Mortgage interest
- −$7,002
- − Property taxes
- −$1,060
- − Insurance
- −$625
- − Repairs & maintenance
- −$984
- − Management
- −$984
- − Depreciation
- −$3,636
- Taxable loss
- −$1,991
- Est. tax savings @ 24.0%
- +$478
- After-tax cash flow
- $644/yr
For passive investors: Depreciation is non-cash, so a rental often shows a tax loss while cash-flowing — sheltering income. Rental losses are passive: they offset passive income freely, and up to $25,000/yr can offset ordinary (W-2) income if you actively participate and your MAGI is under $100k (phasing out to $0 by $150k); unused losses carry forward. On sale, claimed depreciation is recaptured at up to 25%, and gains may owe capital-gains tax (a 1031 exchange can defer both). Figures are a year-1 estimate at your 24.0% rate — not tax advice; consult a CPA.
Schools (NCES district)
- District
- West Sioux Community School District
- NCES district ID
- 1931290
- Math proficiency
- 60% ▲ 2.00%
- Reading proficiency
- 62% ▲ 14.00%
- Median HH income
- $47,848
- Composite
- 51.7/100
- National rank
- #1690
- State rank
- #239 of 289 in IA
Livability — Hawarden
- Score
- 76/100
- State rank
- #201
- US rank
- #3671
Category grades
Schools grade is shown separately in the Schools card above.
Census & demographics
- Census place
- Hawarden, IA
- Population (ZIP)
- 3,437
Population outlook (Sioux County) Hauer SSP2
- Today (2025)
- 35,762 people
- By 2030
- 36,317 · +1.6%
- By 2040
- 37,204 · +4.0%
- By 2050
- 37,990 · +6.2%
- By 2075
- 39,504 · +10.5%
- By 2100
- 39,809 · +11.3%
Race, ethnicity, and origin ACS 2023
- Neighborhood character
- Predominantly White (71%)
- Race & ethnicity
- White 71% Hispanic / Latino 29% Two or more races 14% Native American 2%
- Hispanic origin (detail)
- Mexican 28%
- Common ancestry
- Iranian 16% Portuguese 4% Lithuanian 3%
- Foreign-born
- 19% · Canada
- Languages at home
- 79% English-only · Spanish 20%
Political lean MEDSL · Sioux
- 2024 margin
- Solid R (+71.1) · D 13.9% · R 85.0% · Other 1.1%
- 2008→2024 swing
- -8.3pp toward R · 2008: -62.8pp · 2024: -71.1pp
- All cycles
- 2024: R+71.1 2020: R+66.5 2016: R+69.3 2012: R+68.0 2008: R+62.8
Not yet ingested
- Civics
- —
Market trends
- HPI YoY
- ▲ 31.32%
- Current HPI
- 280.7825
- Rent YoY
- —
- Metro
- —
- State GDP YoY
- ▲ 2.48%
- F500 in state
- 4
Industry mix (Fortune 500 HQ in IA)
| Industry | F500 HQs | Revenue |
|---|---|---|
| Financial Services | 1 | $16B |
|
||
| Retail / Convenience | 1 | $15B |
|
||
Price history
1 event — show timeline
- 2026-06-15 Listed $125,000 NWIA
Property tax history
+2.0%/yrLatest (2025): $1,060 · -17.1% YoY. Source: county tax records.
Cash-flow waterfall
monthlySold comps — $/sqft
last 12 mo · ≤1 miLoading sold comps…