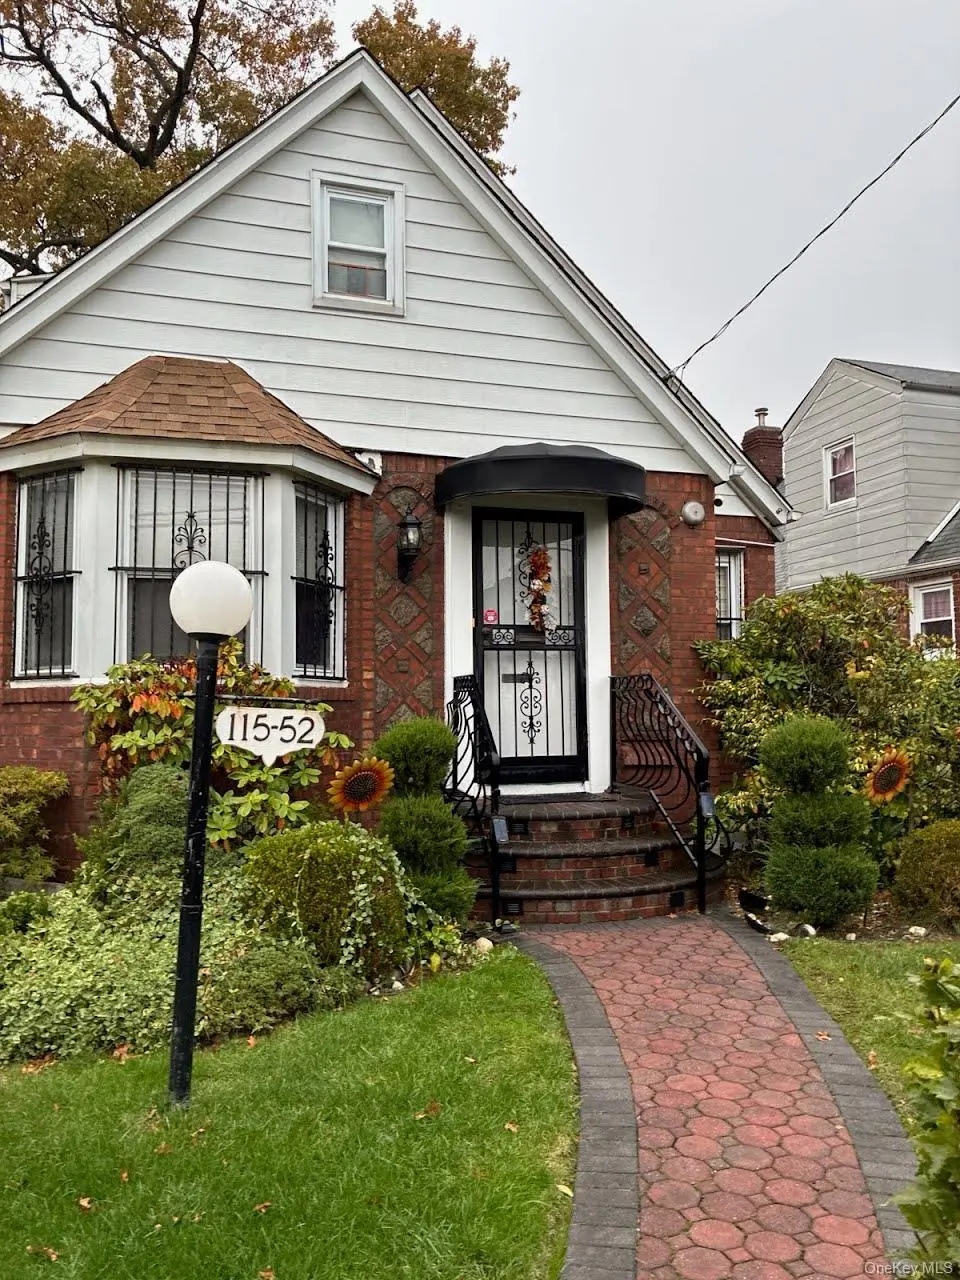
11552 229th St · New York, NY
Flood risk 1/10 · Minimal
- FEMA flood zone
- X (unshaded)
- Chance of flooding over 30 yrs
- 0.0%
- Est. flood insurance / yr
- $507 – $1,088
Fire risk 1/10 · Minimal
- Est. fire insurance / yr
- $691 – $1,283
Heat risk 6/10 · Moderate
- Hot days now (above 97°F)
- 7 days/yr
- Hot days in 30 yrs
- 16 days/yr
Wind risk 6/10 · Moderate
- Chance of severe wind over 30 yrs
- 54.0%
Air-quality risk 3/10 · Minor
- Unhealthy air days now
- 4 days/yr
- Unhealthy air days in 30 yrs
- 4 days/yr
Risk factors via First Street. Map © Google.
Why this score? — see what drove the C grade
The composite is a weighted blend of 9 inputs, each scored 0–100. Each bar is that input's sub-score; the figure is the points it added to the 100-point composite (weight × sub-score).
- Cash flow +18.4/30.0
- ARV discount +15.0/15.0
- DSCR +5.8/10.0
- Schools +5.0/10.0
- 1% rule +4.9/10.0
- Livability +3.8/5.0
- Rent growth +2.5/5.0
- Condition / age +2.5/5.0
- Appreciation +0.0/10.0
$440,000
🖨 Deal sheet 📄 Offer letter ✓ Due diligence
Listing remarks
Welcome to Cambria Heights! Great opportunity to own a detached home featuring 5 bedrooms and 3 bathrooms. The home offers a spacious living room, dining area, and a large eat-in kitchen. Unfinished basement with plenty of potential for additional space or storage. Conveniently located near public transportation, schools, and shopping.
Key facts
- Large eat-in kitchen
- Unfinished basement
- Detached home
Tags
Neighborhood map
What this means for you Summary
Snapshot
- This is a 5-bed/3.0-bath single-family listed at $440k.
Deal economics
- At list price, monthly cash flow is $409 ($5k/yr) — positive.
- The deal already cash-flows at list — no discount required.
- To meet the 1% rule (rent ≥ 1% of price), the offer needs to be $436k (0.9% below list).
- Recommended offer: $433k (1.5% below list) — sets the bar for market timing.
- Cap rate 7.4% vs local median 2.6% in New York — top-decile yield for the area; either an underpriced asset or a hidden risk that comps aren't pricing in. Stress-test before assuming the spread holds.
Location & tenants
- Location reads 75/100 on livability (#268 in NY, #4,188 nationally) — a middle-class / working-renter tenant base. Strengths: amenities A+, commute A+, health & safety A; Watch: crime F, cost of living F.
- Market conditions: 76 active listings in the ZIP; 3 comparable units currently listed for rent nearby; rentals at typical pace (median 20d on market — plan ~3-4 weeks tenant-placement turnaround); 5,302 units permitted in Queens County in 2024 (4,918 in 5+ unit buildings).
Forward outlook
- Local home prices are declining (-3.0%/yr); year-one equity from $3k of loan paydown is wiped out by about $13k of value loss. Plan a longer hold.
- Queens County population projected at +16% by 2050 — long-run rental-demand tailwind backs the buy-and-hold thesis.
Negotiation context
- It's been on market 18 days — a 2% lower offer ($433k) is reasonable based on typical stale-listing flexibility.
Risks & watch-outs
- Watch-outs: built in 1955 — expect roof / HVAC / electrical / plumbing capex.
- Climate carrying-cost: major wind risk, 54% chance of damaging wind over 30y; extreme-heat days projected 7→16/yr by 2055 (HVAC capex compounding) — expect insurance premiums to compound above CPI over the hold.
Questions for the listing agent
- Built in 1955 — when were the roof, HVAC, electrical panel, plumbing, and water heater last replaced?
- Is there a deadline driving the sale (1031 exchange, divorce, estate, relocation)? That informs how much negotiation room exists.
- Schools are B-rated — typically a magnet for longer-tenancy family renters. What's the average tenant stay here, and is there a school-zone premium baked into asking?
- Crime grade is F in this area — have there been break-ins, vandalism, or insurance claims at this property in the last 3 years? What carrier currently insures it and at what premium?
- What's the average days-on-market for RENTAL listings here right now (not sales)? A rising rental-DOM trend means longer vacancies and softer asking-rent achievability than the comps imply.
- What's the recent tenant-quality profile in this submarket — average credit score on applications, eviction rate, late-payment / NSF rate, and stable-employment percentage? A property-management company in the area should have these aggregated.
- How much new for-sale + rental construction is in the pipeline within 1–3 miles? Heavy new supply typically softens prices + rents 12–24 months out; constrained supply supports both.
Investment metrics
- 1% rule
- 0.99% ✗
- Cap rate
- 7.41%
- Cash-on-cash
- 3.99%
- DSCR
- 1.18
- GRM
- 8.4
CMA / ARV
- ARV (on-the-fly)
- $687,932
- Comps found
- 12
Show comp detail 12 sales within ~0.75 mi
| Address | Dist | Beds/Ba | Sqft | Sold | Price | $/sf | Match |
|---|---|---|---|---|---|---|---|
| 11552 229th St | 0.00mi | 5/3.0 | 1,106 (0%) | 0mo | $419,000 | $379 | 100 |
| 114-66 225th St | 0.25mi | 4/2.5 (-1) | 1,100 (-0%) | 5mo | $739,000 | $672 | 76 |
| 22117 Murdock Ave | 0.54mi | 4/2.0 (-1) | 1,144 (+3%) | 4mo | $711,000 | $622 | 57 |
| 505 Parkway Dr | 0.30mi | 4/2.0 (-1) | 1,170 (+6%) | 13mo | $750,000 | $641 | 56 |
| 116-24 238th St | 0.48mi | 4/1.0 (-1) | 1,084 (-2%) | 6mo | $655,000 | $604 | 56 |
| 115-31 237th St | 0.31mi | 4/2.0 (-1) | 1,271 (+15%) | 3mo | $657,000 | $517 | 50 |
| 219-43 113th Ave | 0.61mi | 4/2.0 (-1) | 1,026 (-7%) | 2mo | $750,000 | $731 | 49 |
| 114-35 223rd St | 0.33mi | 4/2.0 (-1) | 1,190 (+8%) | 17mo | $675,000 | $567 | 49 |
| 11909 224th St | 0.59mi | 4/3.0 (-1) | 1,268 (+15%) | 0mo | $800,000 | $631 | 43 |
| 11580 217th St | 0.61mi | 4/3.0 (-1) | 1,200 (+8%) | 12mo | $760,000 | $633 | 42 |
| 216-24 115th Ter | 0.61mi | 4/2.0 (-1) | 972 (-12%) | 12mo | $570,000 | $586 | 33 |
| 119-34 230th St | 0.59mi | 4/1.0 (-1) | 1,239 (+12%) | 9mo | $755,000 | $609 | 32 |
Match score weights: distance 35% · size 25% · config 20% · recency 20%. Top-matched comps best support the ARV.
Projected returns pro-forma
-3.0% appreciation · 3.0% rent growth · sell at horizon
- IRR
- -10.0%
- Equity multiple
- 0.63×
- Total profit
- $-45,160
- Equity at exit
- $65,605
- IRR
- -0.6%
- Equity multiple
- 0.96×
- Total profit
- $-5,496
- Equity at exit
- $38,043
Cash invested: $123,200 (down + closing). Projections, not guarantees.
Landlord ↔ Tenant lean methodology
- Overall (CITY)
- 0 Strongly Tenant-Friendly
- State New York
- 15 Strongly Tenant-Friendly · D+10
- County
- — inherits STATE
- City New York
- 0 Strongly Tenant-Friendly · D+34
ZIP-level market 11411
- Active inventory
- 76
- Price-to-rent
- 8.4×
Monthly cashflow live
- Estimated rent
- $4,359 medium interval (Pro) →
- Mortgage (P&I)
- −$2,307
- Tax from tax record
- −$543 /mo · $6,517/yr
- Insurance
- −$183
- HOA
- −$0
- Vacancy / Maint / Mgmt
- −$915
- Net cashflow
- $409
Break-even live
UW: 25.0% down · 7.5% · 30yr · 1.5% tax · 5.0% vac · 8.0% maint · 8.0% mgmt
Financing live
Cash to close
- Down payment
- $110,000
- Closing costs
- $13,200
- Reserves months
- —
- Total cash needed
- —
Loan-product check · same deal, 3 products live
Conventional
25% down · 7.5% · 30yr
- Down + closing
- —
- Monthly P&I
- —
- Monthly cashflow
- —
- DSCR
- —
- Eligible?
- —
Personal DTI + credit; lowest rate.
DSCR
20% down · 8.5% · 30yr
- Down + closing
- —
- Monthly P&I
- —
- Monthly cashflow
- —
- DSCR
- —
- Eligible?
- —
No personal income docs; deal must DSCR.
Hard money
10% down · 12.0% · 12mo
- Down + closing
- —
- Monthly P&I
- —
- Monthly cashflow
- —
- DSCR
- —
- Eligible?
- —
Short-term bridge; refi at stabilization.
Rent comps 3 comps
| Address | Beds | Baths | Sqft | Rent | $/sqft | DOM | Units | Dist |
|---|---|---|---|---|---|---|---|---|
| 10713 220th St Queens Village, NY | 4.0 | 2.0 | 1350 | $4,999 | $3.70 | 20d | 1 | 0.88mi |
| 218-13 Jamaica Ave Unit 2FL Jamaica, NY | 4.0 | 2.0 | 1200 | $3,800 | $3.17 | 24d | 1 | 1.50mi |
| 218-13 Jamaica Ave Jamaica, NY | 4.0 | 2.0 | 750 | $3,800 | $5.07 | 7d | 1 | 1.50mi |
Listing history 2 events
-
2025-11-18status Pending
-
2025-10-30$440,000 Active
ⓘ Source: listings_history table (triggers on properties + properties_extension) + one-shot
backfill from property_details.listing_events for pre-trigger history.
Tax reassessment forecast NY · Partial reset (capped growth)
- Current annual tax
- $6,517 · $543/mo
- Projected year-2 tax
- $6,976 · $581/mo
- Expected delta
- +$460/yr (+$38/mo · 7.1%)
ⓘ Screening estimate from a state-policy table — verify with the county assessor before closing.
Climate risk First Street
- Flood 1/10 Low FEMA zone X (unshaded) · 0% chance over 30 yrs
- Wildfire 1/10 Low
- Heat 6/10 Major 7 d/yr ≥97°F today · 16 d/yr by 30 yrs out
- Wind 6/10 Major 54% chance of damaging wind over 30 yrs
- Air quality 3/10 Moderate 4 unhealthy d/yr today · 4 by 30 yrs out
Nearby sold comps map
Loading sold comps map…
Walkable amenities ~0.75 mi
Loading nearby amenities…
Taxation est. · year 1
- Rental income
- $52,303
- − Mortgage interest
- −$24,647
- − Property taxes
- −$6,517
- − Insurance
- −$2,200
- − Repairs & maintenance
- −$4,184
- − Management
- −$4,184
- − Depreciation
- −$12,800
- Taxable loss
- −$2,230
- Est. tax savings @ 24.0%
- +$535
- After-tax cash flow
- $5,448/yr
For passive investors: Depreciation is non-cash, so a rental often shows a tax loss while cash-flowing — sheltering income. Rental losses are passive: they offset passive income freely, and up to $25,000/yr can offset ordinary (W-2) income if you actively participate and your MAGI is under $100k (phasing out to $0 by $150k); unused losses carry forward. On sale, claimed depreciation is recaptured at up to 25%, and gains may owe capital-gains tax (a 1031 exchange can defer both). Figures are a year-1 estimate at your 24.0% rate — not tax advice; consult a CPA.
Schools (NCES district)
No district data.
Livability — New York
- Score
- 75/100
- State rank
- #268
- US rank
- #4188
Category grades
Schools grade is shown separately in the Schools card above.
Census & demographics
- Census place
- New York, NY
- City population
- 7,731,280
- Population (ZIP)
- 20,501
Population outlook (Queens County) Hauer SSP2
- Today (2025)
- 2,546,320 people
- By 2030
- 2,643,059 · +3.8%
- By 2040
- 2,815,563 · +10.6%
- By 2050
- 2,944,423 · +15.6%
- By 2075
- 3,123,338 · +22.7%
- By 2100
- 3,098,688 · +21.7%
Race, ethnicity, and origin ACS 2023
- Neighborhood character
- Predominantly Black (84%)
- Race & ethnicity
- Black 84% Hispanic / Latino 8% Two or more races 5% Asian 2% White 2%
- Hispanic origin (detail)
- Puerto Rican 2% Dominican 2%
- Common ancestry
- Hispanic 8%
- Foreign-born
- 41% · Canada, Mexico, China
- Languages at home
- 80% English-only · French/Haitian/Cajun 9% Spanish 7% Other Indo-European 1%
Political lean MEDSL · Queens
- 2024 margin
- Strong D (+24.6) · D 62.3% · R 37.7%
- 2008→2024 swing
- -26.2pp toward R · 2008: 50.8pp · 2024: 24.6pp
- All cycles
- 2024: D+24.6 2020: D+45.2 2016: D+53.4 2012: D+58.5 2008: D+50.8
Not yet ingested
- Civics
- —
Market trends
- HPI YoY
- ▼ -298.42%
- Current HPI
- 299.6176
- Rent YoY
- —
- Metro
- —
- State GDP YoY
- ▲ 2.60%
- F500 in state
- 92
Industry mix (Fortune 500 HQ in NY)
| Industry | F500 HQs | Revenue |
|---|---|---|
| Financial Services | 10 | $950B |
|
||
| Consumer Goods | 9 | $162B |
|
||
| Insurance | 4 | $225B |
|
||
| Telecommunications | 2 | $144B |
|
||
| Pharmaceuticals | 2 | $112B |
|
||
| Media / Entertainment | 2 | $69B |
|
||
Price history
2 events — show timeline
- 2025-11-18 Pending — OneKey® MLS as Distributed by MLS Grid
- 2025-10-30 Listed $440,000 OneKey® MLS as Distributed by MLS Grid
Property tax history
+5.3%/yrLatest (2025): $6,517 · +3.4% YoY. Source: county tax records.
Cash-flow waterfall
monthlySold comps — $/sqft
last 12 mo · ≤1 miLoading sold comps…