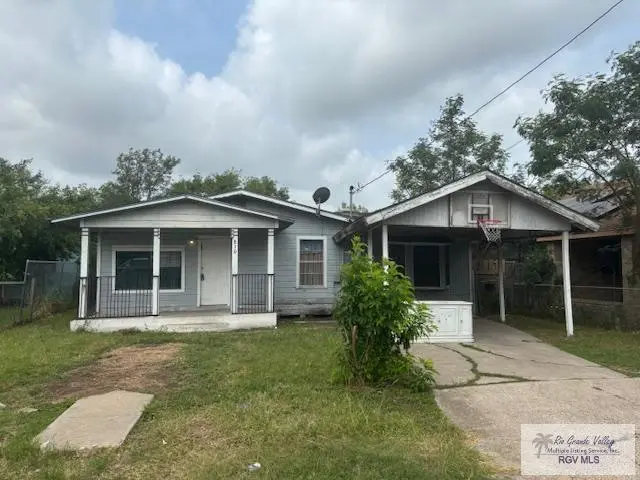
810 Alamo St · San Benito, TX
Flood risk 6/10 · Moderate
- FEMA flood zone
- AH
- Chance of flooding over 30 yrs
- 0.91%
- Est. flood insurance / yr
- $1,142 – $2,507
Fire risk 5/10 · Moderate
- Est. fire insurance / yr
- $1,222 – $2,270
Heat risk 9/10 · Severe
- Hot days now (above 110°F)
- 7 days/yr
- Hot days in 30 yrs
- 25 days/yr
Wind risk 8/10 · Major
- Chance of severe wind over 30 yrs
- 99.0%
Air-quality risk 2/10 · Minimal
- Unhealthy air days now
- 1 days/yr
- Unhealthy air days in 30 yrs
- 1 days/yr
Risk factors via First Street. Map © Google.
Why this score? — see what drove the B grade
The composite is a weighted blend of 9 inputs, each scored 0–100. Each bar is that input's sub-score; the figure is the points it added to the 100-point composite (weight × sub-score).
- Cash flow +30.0/30.0
- ARV discount +15.0/15.0
- DSCR +10.0/10.0
- 1% rule +9.8/10.0
- Livability +3.3/5.0
- Rent growth +2.5/5.0
- Condition / age +2.5/5.0
- Schools +1.6/10.0
- Appreciation +0.0/10.0
$98,500
🖨 Deal sheet 📄 Offer letter ✓ Due diligence
Listing remarks MLS
INVESTOR ALERT!! This home offers an open floor plan with 3 bedrooms and a spacious bath. There is a patio in the back yard and a large backyard that you can make it your own. This home needs some repair and the home is being Sold AS IS!
Key facts
- Open floor plan
- Large backyard
- Patio
Tags
Neighborhood map
What this means for you Summary
Snapshot
- This is a 3-bed/1.0-bath single-family listed at $98k.
Deal economics
- At list price, monthly cash flow is $311 ($4k/yr) — positive.
- The deal already cash-flows at list — no discount required.
- Meets the 1% rule at list price ($1k rent vs $98k).
- Recommended offer: $87k (12.0% below list) — sets the bar for market timing.
- Cap rate 11.9% vs local median 3.7% in San Benito — top-decile yield for the area; either an underpriced asset or a hidden risk that comps aren't pricing in. Stress-test before assuming the spread holds.
Location & tenants
- Location reads 66/100 on livability (#621 in TX) — a middle-class / working-renter tenant base. Strengths: cost of living A+, housing A+; Watch: crime C-, schools D-, amenities F.
- San Benito CISD (suburban): math 14% / reading 27% proficiency, ranked #782 of 826 in TX (top 95%) — low school quality limits family demand, transient renter base, plan for 1-2y turnover; 78% free/reduced lunch — lower-income household profile, screen leases tightly.
- Market conditions: 441 active listings in the ZIP; 4 comparable units currently listed for rent nearby; rentals lingering (median 44d on market — plan ~5-8 weeks vacancy on turnover, expect pricing pressure); 50% of comp listings sitting > 30 days — soft ceiling on asking rent; 2,326 units permitted in Cameron County in 2024 (503 in 5+ unit buildings).
Forward outlook
- Local home prices are declining (-3.0%/yr); year-one equity from $681 of loan paydown is wiped out by about $3k of value loss. Plan a longer hold.
- Cameron County population projected at +3% by 2050 — modest demand growth; plan on rents tracking national, not racing it.
- At projected returns (-3.0% appreciation + 3.0% rent growth), your $28k cash investment doubles in ~9 years — after that, you're playing with house money.
Negotiation context
- It's been on market 357 days — a 12% lower offer ($87k) is reasonable based on typical stale-listing flexibility.
Risks & watch-outs
- Watch-outs: flood insurance adds $152/mo.
- Climate carrying-cost: in FEMA flood zone AH (mandatory federal flood insurance); severe wind risk, 99% chance of damaging wind over 30y; moderate wildfire risk; extreme-heat days projected 7→25/yr by 2055 (HVAC capex compounding) — expect insurance premiums to compound above CPI over the hold.
Questions for the listing agent
- It's been on market 357 days. Have you received any prior offers? Is the seller open to a 12% concession, seller financing, or rate buy-down credit?
- Built in 1968 — when were the roof, HVAC, electrical panel, plumbing, and water heater last replaced?
- What's the actual annual flood-insurance premium (NFIP or private), and is the property in a SFHA with mandatory coverage?
- Why hasn't it sold? Are there any deal-killer items the seller is aware of (foundation, flood, title, zoning, code violations)?
- Is there a deadline driving the sale (1031 exchange, divorce, estate, relocation)? That informs how much negotiation room exists.
- Schools are D-rated, which usually means shorter tenancies and higher turnover. Who's the typical renter profile here, and what's been the actual vacancy rate?
- What's the average days-on-market for RENTAL listings here right now (not sales)? A rising rental-DOM trend means longer vacancies and softer asking-rent achievability than the comps imply.
- What's the recent tenant-quality profile in this submarket — average credit score on applications, eviction rate, late-payment / NSF rate, and stable-employment percentage? A property-management company in the area should have these aggregated.
- How much new for-sale + rental construction is in the pipeline within 1–3 miles? Heavy new supply typically softens prices + rents 12–24 months out; constrained supply supports both.
Investment metrics
- 1% rule
- 1.48% ✓
- Cap rate
- 11.93%
- Cash-on-cash
- 20.13%
- DSCR
- 1.90
- GRM
- 5.6
CMA / ARV
- ARV (median comp)
- $150,117
- List price
- $98,500
- Delta
- -34.38%
- Verdict
- UNDERPRICED
- Comps
- 11 within 1.0 mi
Show comp detail 2 sales within ~0.75 mi
| Address | Dist | Beds/Ba | Sqft | Sold | Price | $/sf | Match |
|---|---|---|---|---|---|---|---|
| 470 Jay St | 0.09mi | 3/2.0 | 1,385 (+7%) | 12mo | $95,000 | $69 | 69 |
| 234 Chapman St | 0.68mi | 3/2.0 | 1,300 (+1%) | 16mo | $152,900 | $118 | 50 |
Match score weights: distance 35% · size 25% · config 20% · recency 20%. Top-matched comps best support the ARV.
Projected returns pro-forma
-3.0% appreciation · 3.0% rent growth · sell at horizon
- IRR
- 3.7%
- Equity multiple
- 1.14×
- Total profit
- $3,946
- Equity at exit
- $14,687
- IRR
- 13.3%
- Equity multiple
- 2.07×
- Total profit
- $29,410
- Equity at exit
- $8,516
Cash invested: $27,580 (down + closing). Projections, not guarantees.
Landlord ↔ Tenant lean methodology
- Overall (STATE)
- 87 Strongly Landlord-Friendly
- State Texas
- 87 Strongly Landlord-Friendly · R+5
- County
- — inherits STATE
- City
- — inherits STATE
ZIP-level market 78586
- Home prices YoY
- -24.9%
- Active inventory
- 441
- Price-to-rent
- 5.6×
Monthly cashflow live
- Estimated rent
- $1,461 medium interval (Pro) →
- Mortgage (P&I)
- −$517
- Tax from tax record
- −$134 /mo · $1,612/yr
- Insurance
- −$41
- Flood insurance flood zone
- −$152 /mo · $1,824/yr
- HOA
- −$0
- Vacancy / Maint / Mgmt
- −$307
- Net cashflow
- $311
Break-even live
UW: 25.0% down · 7.5% · 30yr · 1.5% tax · 5.0% vac · 8.0% maint · 8.0% mgmt
Financing live
Cash to close
- Down payment
- $24,625
- Closing costs
- $2,955
- Reserves months
- —
- Total cash needed
- —
Loan-product check · same deal, 3 products live
Conventional
25% down · 7.5% · 30yr
- Down + closing
- —
- Monthly P&I
- —
- Monthly cashflow
- —
- DSCR
- —
- Eligible?
- —
Personal DTI + credit; lowest rate.
DSCR
20% down · 8.5% · 30yr
- Down + closing
- —
- Monthly P&I
- —
- Monthly cashflow
- —
- DSCR
- —
- Eligible?
- —
No personal income docs; deal must DSCR.
Hard money
10% down · 12.0% · 12mo
- Down + closing
- —
- Monthly P&I
- —
- Monthly cashflow
- —
- DSCR
- —
- Eligible?
- —
Short-term bridge; refi at stabilization.
Rent comps 4 comps
| Address | Beds | Baths | Sqft | Rent | $/sqft | DOM | Units | Dist |
|---|---|---|---|---|---|---|---|---|
| 100 Woodford St Unit D San Benito, TX | 3.0 | 2.5 | 1500 | $1,550 | $1.03 | 43d | 1 | 0.58mi |
| 1485 E Stenger St San Benito, TX | 3.0 | 1.0 | 1296 | $1,150 | $0.89 | 13d | 1 | 0.85mi |
| 105 Republic Cir San Benito, TX | 3.0 | 2.0 | 1611 | $2,300 | $1.43 | 13d | 1 | 0.99mi |
| 111 Las Palmas St Apt 2 San Benito, TX | 2.0 | 2.0 | 1021 | $875 | $0.86 | 43d | 1 | 1.04mi |
Listing history 19 events
-
2026-06-18days on market $98,500 Active 357 DOM
-
2026-06-17days on market $98,500 Active 356 DOM
-
2026-06-16days on market $98,500 Active 355 DOM
-
2026-06-15days on market $98,500 Active 354 DOM
-
2026-06-14remarks 285-char remark
-
2026-06-14days on market $98,500 Active 352 DOM
-
2026-06-10days on market $98,500 Active 349 DOM
-
2026-06-09days on market $98,500 Active 348 DOM
-
2026-06-08days on market $98,500 Active 347 DOM
-
2026-06-07days on market $98,500 Active 346 DOM
-
2026-06-03days on market $98,500 Active 342 DOM
-
2026-06-02days on market $98,500 Active 341 DOM
-
2026-06-01days on market $98,500 Active 340 DOM
-
2026-05-31days on market $98,500 Active 339 DOM
-
2026-05-30days on market $98,500 Active 338 DOM
-
2026-01-28price $98,500 238-char remark
Show marketing remark (238 chars)
INVESTOR ALERT!! This home offers an open floor plan with 3 bedrooms and a spacious bath. There is a patio in the back yard and a large backyard that you can make it your own. This home needs some repair and the home is being Sold AS IS!
-
2025-08-25price $102,000 238-char remark
Show marketing remark (238 chars)
INVESTOR ALERT!! This home offers an open floor plan with 3 bedrooms and a spacious bath. There is a patio in the back yard and a large backyard that you can make it your own. This home needs some repair and the home is being Sold AS IS!
-
2025-07-28price $107,000 238-char remark
Show marketing remark (238 chars)
INVESTOR ALERT!! This home offers an open floor plan with 3 bedrooms and a spacious bath. There is a patio in the back yard and a large backyard that you can make it your own. This home needs some repair and the home is being Sold AS IS!
-
2025-06-24$112,000 Active 238-char remark
Show marketing remark (238 chars)
INVESTOR ALERT!! This home offers an open floor plan with 3 bedrooms and a spacious bath. There is a patio in the back yard and a large backyard that you can make it your own. This home needs some repair and the home is being Sold AS IS!
ⓘ Source: listings_history table (triggers on properties + properties_extension) + one-shot
backfill from property_details.listing_events for pre-trigger history.
Tax reassessment forecast TX · Resets to sale price
- Current annual tax
- $1,612 · $134/mo
- Projected year-2 tax
- $1,803 · $150/mo
- Expected delta
- +$191/yr (+$16/mo · 11.8%)
ⓘ Screening estimate from a state-policy table — verify with the county assessor before closing.
Climate risk First Street
- Flood 6/10 Major FEMA zone AH · 91% chance over 30 yrs
- Wildfire 5/10 Major
- Heat 9/10 Extreme 7 d/yr ≥110°F today · 25 d/yr by 30 yrs out
- Wind 8/10 Severe 99% chance of damaging wind over 30 yrs
- Air quality 2/10 Low 1 unhealthy d/yr today · 1 by 30 yrs out
Nearby sold comps map
Loading sold comps map…
Walkable amenities ~0.75 mi
Loading nearby amenities…
Taxation est. · year 1
- Rental income
- $17,538
- − Mortgage interest
- −$5,518
- − Property taxes
- −$1,612
- − Insurance
- −$2,317
- − Repairs & maintenance
- −$1,403
- − Management
- −$1,403
- − Depreciation
- −$2,865
- Taxable income
- $2,420
- Est. tax owed @ 24.0%
- −$581
- After-tax cash flow
- $3,147/yr
For passive investors: Depreciation is non-cash, so a rental often shows a tax loss while cash-flowing — sheltering income. Rental losses are passive: they offset passive income freely, and up to $25,000/yr can offset ordinary (W-2) income if you actively participate and your MAGI is under $100k (phasing out to $0 by $150k); unused losses carry forward. On sale, claimed depreciation is recaptured at up to 25%, and gains may owe capital-gains tax (a 1031 exchange can defer both). Figures are a year-1 estimate at your 24.0% rate — not tax advice; consult a CPA.
Schools (NCES district)
- District
- San Benito CISD
- NCES district ID
- 4838790
- Math proficiency
- 14% ▼ -31.00%
- Reading proficiency
- 27% ▼ -10.00%
- Median HH income
- $29,403
- Composite
- 16.31/100
- National rank
- #9212
- State rank
- #782 of 826 in TX
Livability — San Benito
- Score
- 66/100
- State rank
- #621
- US rank
- #11846
Category grades
Schools grade is shown separately in the Schools card above.
Census & demographics
- Census place
- San Benito, TX
- Population (ZIP)
- 49,103
Population outlook (Cameron County) Hauer SSP2
- Today (2025)
- 441,603 people
- By 2030
- 448,113 · +1.5%
- By 2040
- 456,385 · +3.3%
- By 2050
- 456,294 · +3.3%
- By 2075
- 423,851 · -4.0%
- By 2100
- 342,787 · -22.4%
Race, ethnicity, and origin ACS 2023
- Neighborhood character
- Predominantly Hispanic (93%)
- Race & ethnicity
- Hispanic / Latino 93% Two or more races 42% White 6%
- Hispanic origin (detail)
- Mexican 90%
- Foreign-born
- 23% · Canada
- Languages at home
- 29% English-only · Spanish 70%
Political lean MEDSL · Cameron
- 2024 margin
- Lean R (+5.8) · D 46.7% · R 52.5%
- 2008→2024 swing
- -34.6pp toward R · 2008: 28.8pp · 2024: -5.8pp
- All cycles
- 2024: R+5.8 2020: D+13.2 2016: D+32.5 2012: D+32.4 2008: D+28.8
Not yet ingested
- Civics
- —
Market trends
- HPI YoY
- ▼ -62.37%
- Current HPI
- 188.147
- Rent YoY
- —
- Metro
- —
- State GDP YoY
- ▲ 3.95%
- F500 in state
- 110
Industry mix (Fortune 500 HQ in TX)
| Industry | F500 HQs | Revenue |
|---|---|---|
| Energy | 16 | $1,198B |
|
||
| Technology | 5 | $198B |
|
||
| Engineering / Construction | 4 | $72B |
|
||
| Energy Services | 3 | $60B |
|
||
| Utilities | 3 | $41B |
|
||
| Healthcare | 2 | $330B |
|
||
Price history
-12.1% since first listed4 events — show timeline
- 2026-01-28 Price Changed $98,500 RGVMLS
- 2025-08-25 Price Changed $102,000 RGVMLS
- 2025-07-28 Price Changed $107,000 RGVMLS
- 2025-06-24 Listed $112,000 RGVMLS
Property tax history
+2.3%/yrLatest (2025): $1,612 · +0.5% YoY. Source: county tax records.
Cash-flow waterfall
monthlySold comps — $/sqft
last 12 mo · ≤1 miLoading sold comps…