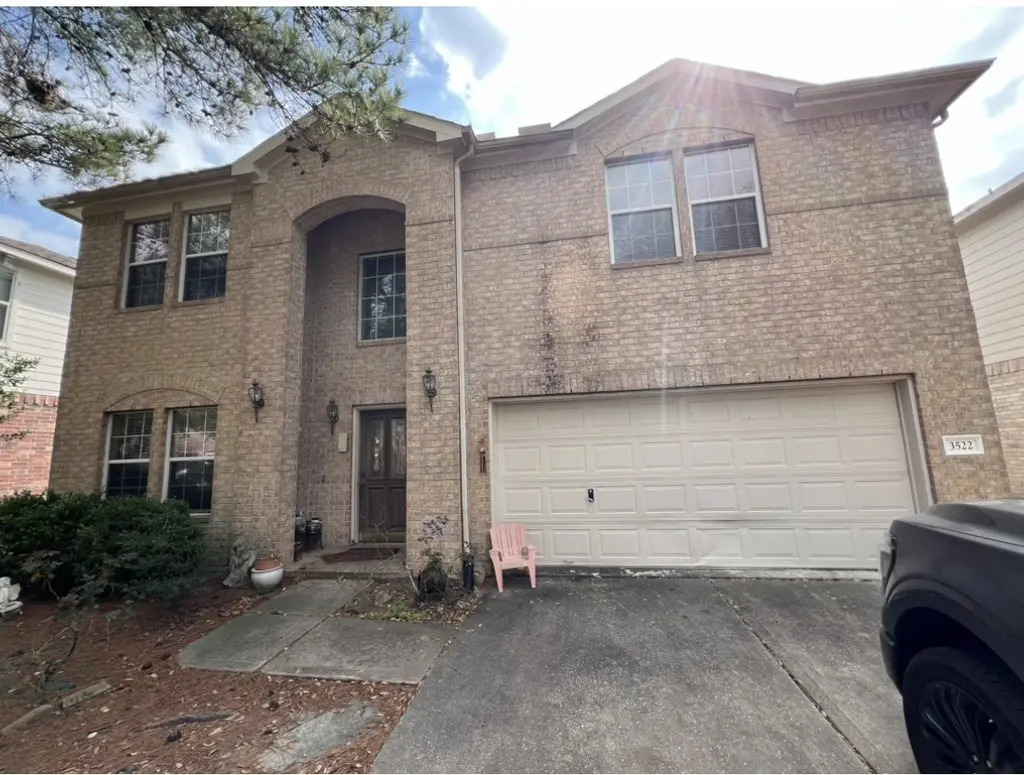
3522 Cactus Creek Dr · Houston, TX
Flood risk 1/10 · Minimal
- FEMA flood zone
- X (unshaded)
- Chance of flooding over 30 yrs
- 0.0%
- Est. flood insurance / yr
- $507 – $1,088
Fire risk 3/10 · Minor
- Est. fire insurance / yr
- $1,222 – $2,270
Heat risk 9/10 · Severe
- Hot days now (above 110°F)
- 7 days/yr
- Hot days in 30 yrs
- 24 days/yr
Wind risk 8/10 · Major
- Chance of severe wind over 30 yrs
- 99.0%
Air-quality risk 3/10 · Minor
- Unhealthy air days now
- 3 days/yr
- Unhealthy air days in 30 yrs
- 3 days/yr
Risk factors via First Street. Map © Google.
Why this score? — see what drove the D grade
The composite is a weighted blend of 9 inputs, each scored 0–100. Each bar is that input's sub-score; the figure is the points it added to the 100-point composite (weight × sub-score).
- ARV discount +15.0/15.0
- Cash flow +7.3/30.0
- Schools +5.1/10.0
- 1% rule +4.2/10.0
- Livability +3.7/5.0
- Rent growth +2.8/5.0
- Condition / age +2.5/5.0
- DSCR +1.4/10.0
- Appreciation +0.0/10.0
$250,000
🖨 Deal sheet (PDF) 📄 Offer letter ✓ Due diligence
Listing remarks MLS
Beautiful 4-bedroom Gehan home in a desirable gated community. The floor plan features a formal dining room, a spacious den with a fireplace, and a versatile game room. The primary suite includes a bath with a soaking tub and separate shower. This well-maintained home shows pride of ownership and offers the benefits of gated living, including added security and access to amenities like a community pool and fitness center. Conveniently located near parks, shopping, dining, and entertainment, it’s a great alternative to higher-priced areas while still close to city living.
Key facts
- Gated community
- Fitness center
- Formal dining room
Tags
Neighborhood map
What this means for you Summary
Snapshot
- This is a 4-bed/2.5-bath single-family listed at $250k.
Deal economics
- At list price, monthly cash flow is $-336 ($-4k/yr) — negative.
- To cash-flow at today's rent, offer at most $191k (23.7% below list).
- To meet the 1% rule (rent ≥ 1% of price), the offer needs to be $231k (7.6% below list).
- Recommended offer: $191k (23.7% below list) — sets the bar for cash-flow.
- Cap rate 4.7% vs local median 3.2% in Houston — top-decile yield for the area; either an underpriced asset or a hidden risk that comps aren't pricing in. Stress-test before assuming the spread holds.
Location & tenants
- Location reads 74/100 on livability (#184 in TX, #4,771 nationally) — a middle-class / working-renter tenant base. Strengths: amenities A+, cost of living A+, housing A+; Watch: crime F.
- Conroe ISD (other): math 57% / reading 57% proficiency, ranked #69 of 826 in TX (top 8%) — acceptable for families but not a draw, mixed tenant base, ~2y average lease.
- Zoned schools: Birnham Woods El (math 62% / reading 66%, grade B, #283 of 4,322 statewide, top 7%, 996 students, 17% FRL); York J H (math 71% / reading 65%, grade A-, #73 of 1,662 statewide, top 5%, 2,015 students, 22% FRL); Conroe H S (math 32% / reading 51%, grade F, #767 of 1,632 statewide, top 47%, 4,915 students, 61% FRL) — zoned schools at 34% FRL track the district average.
- Market conditions: Rents rising (+1.4%/yr); 744 active listings in the ZIP; 11 comparable units currently listed for rent nearby; rentals at typical pace (median 24d on market — plan ~3-4 weeks tenant-placement turnaround); high-income renter base; 13,259 units permitted in Montgomery County in 2024 (1,402 in 5+ unit buildings).
Forward outlook
- Local home prices are declining (-3.0%/yr); year-one equity from $2k of loan paydown is wiped out by about $8k of value loss. Plan a longer hold.
- Montgomery County population projected at +65% by 2050 — long-run rental-demand tailwind backs the buy-and-hold thesis.
Negotiation context
- It's been on market 89 days — a 6% lower offer ($235k) is reasonable based on typical stale-listing flexibility.
- 5 sale attempts since 20y ago with the ask held roughly flat each time — persistent listings suggest the price (not the market) is what's stuck; bring a comps-based counter.
Risks & watch-outs
- Watch-outs: property tax is 3.1% of price.
- Climate carrying-cost: severe wind risk, 99% chance of damaging wind over 30y; extreme-heat days projected 7→24/yr by 2055 (HVAC capex compounding) — expect insurance premiums to compound above CPI over the hold.
Questions for the listing agent
- What do current leases actually rent for vs. the listed asking? Can we see a recent rent roll and the last 12 months of T-12 income?
- It's been on market 89 days. Have you received any prior offers? Is the seller open to a 24% concession, seller financing, or rate buy-down credit?
- Property tax is high relative to price — has the assessment been appealed recently, and will the sale trigger a re-assessment?
- What does the HOA fee cover, when was the last increase, and are there any pending special assessments or reserve-fund shortfalls?
- Why hasn't it sold? Are there any deal-killer items the seller is aware of (foundation, flood, title, zoning, code violations)?
- Is there a deadline driving the sale (1031 exchange, divorce, estate, relocation)? That informs how much negotiation room exists.
- Schools are D-rated, which usually means shorter tenancies and higher turnover. Who's the typical renter profile here, and what's been the actual vacancy rate?
- Crime grade is F in this area — have there been break-ins, vandalism, or insurance claims at this property in the last 3 years? What carrier currently insures it and at what premium?
- The area grade is low — what's the realistic commute time and amenity access for the typical tenant pool here? Any planned neighborhood developments (good or bad) we should know about?
- What's the average days-on-market for RENTAL listings here right now (not sales)? A rising rental-DOM trend means longer vacancies and softer asking-rent achievability than the comps imply.
- What's the recent tenant-quality profile in this submarket — average credit score on applications, eviction rate, late-payment / NSF rate, and stable-employment percentage? A property-management company in the area should have these aggregated.
- How much new for-sale + rental construction is in the pipeline within 1–3 miles? Heavy new supply typically softens prices + rents 12–24 months out; constrained supply supports both.
Investment metrics
- 1% rule
- 0.92% ✗
- Cap rate
- 4.68%
- Cash-on-cash
- -5.75%
- DSCR
- 0.74
- GRM
- 9.0
CMA / ARV
- ARV (median comp)
- $330,473
- List price
- $250,000
- Delta
- -24.35%
- Verdict
- UNDERPRICED
- Comps
- 20 within 1.0 mi
Show comp detail 12 sales within ~0.75 mi
| Address | Dist | Beds/Ba | Sqft | Sold | Price | $/sf | Match |
|---|---|---|---|---|---|---|---|
| 29518 Taliesin Ct | 0.37mi | 4/2.5 | 2,909 (+6%) | 2mo | $425,000 | $146 | 71 |
| 29522 Whitebrush Trace Dr | 0.55mi | 5/3.0 (+1) | 2,759 (+1%) | 1mo | $375,000 | $136 | 65 |
| 29402 Legends Hill Dr | 0.53mi | 4/2.5 | 2,870 (+5%) | 3mo | $289,000 | $101 | 65 |
| 3131 Rustic Gardens Dr | 0.35mi | 4/3.0 | 3,008 (+10%) | 2mo | $435,000 | $145 | 64 |
| 29481 Salem Fields Dr | 0.27mi | 3/2.0 (-1) | 2,372 (-13%) | 2mo | $365,000 | $154 | 56 |
| 29450 Westhope Dr | 0.56mi | 4/3.5 | 2,548 (-7%) | 2mo | $515,000 | $202 | 56 |
| 30614 Woodson Trace Dr | 0.56mi | 4/2.5 | 2,452 (-10%) | 1mo | $325,000 | $133 | 56 |
| 29871 Woodsons Edge Way | 0.47mi | 4/3.0 | 2,411 (-12%) | 2mo | $355,000 | $147 | 54 |
| 29522 Monona Terrace Ct | 0.42mi | 3/2.5 (-1) | 2,402 (-12%) | 1mo | $370,000 | $154 | 54 |
| 30723 Academy Trace Dr | 0.65mi | 3/2.5 (-1) | 2,869 (+5%) | 4mo | $389,900 | $136 | 54 |
| 3523 Tulip Trace Dr | 0.60mi | 5/3.5 (+1) | 2,969 (+8%) | 4mo | $370,000 | $125 | 46 |
| 29515 Samara Dr | 0.72mi | 5/4.0 (+1) | 2,980 (+9%) | 4mo | $475,000 | $159 | 37 |
Match score weights: distance 35% · size 25% · config 20% · recency 20%. Top-matched comps best support the ARV.
Projected returns pro-forma
-3.0% appreciation · 1.35% rent growth · sell at horizon
- IRR
- -28.4%
- Equity multiple
- 0.07×
- Total profit
- $-65,358
- Equity at exit
- $37,276
- IRR
- -37.8%
- Equity multiple
- -0.40×
- Total profit
- $-98,191
- Equity at exit
- $21,615
Cash invested: $70,000 (down + closing). Projections, not guarantees.
Landlord ↔ Tenant lean methodology
- Overall (STATE)
- 87 Strongly Landlord-Friendly
- State Texas
- 87 Strongly Landlord-Friendly · R+5
- County
- — inherits STATE
- City
- — inherits STATE
ZIP-level market 77386
- Home prices YoY
- -13.6%
- Rents YoY
- 1.4%
- Active inventory
- 744
- Price-to-rent
- 9.0×
Monthly cashflow live
- Estimated rent
- $2,310 high interval (Pro) →
- Mortgage (P&I)
- −$1,311
- Tax from tax record
- −$653 /mo · $7,836/yr
- Insurance
- −$104
- HOA
- −$92
- Vacancy / Maint / Mgmt
- −$485
- Net cashflow
- $-336
Break-even live
Sensitivity live
| Price | -10% $-194 | -5% $-265 | +0% $-336 | +5% $-406 | +10% $-477 |
|---|---|---|---|---|---|
| Rent | -10% $-518 | -5% $-427 | +0% $-336 | +5% $-244 | +10% $-153 |
| Rate | -1.0pp $-210 | -0.5pp $-272 | base $-336 | +0.5pp $-400 | +1.0pp $-466 |
UW: 25.0% down · 7.5% · 30yr · 1.5% tax · 5.0% vac · 8.0% maint · 8.0% mgmt
Financing live
Cash to close
- Down payment
- $62,500
- Closing costs
- $7,500
- Reserves months
- —
- Total cash needed
- —
Loan-product check · same deal, 3 products live
Conventional
25% down · 7.5% · 30yr
- Down + closing
- —
- Monthly P&I
- —
- Monthly cashflow
- —
- DSCR
- —
- Eligible?
- —
Personal DTI + credit; lowest rate.
DSCR
20% down · 8.5% · 30yr
- Down + closing
- —
- Monthly P&I
- —
- Monthly cashflow
- —
- DSCR
- —
- Eligible?
- —
No personal income docs; deal must DSCR.
Hard money
10% down · 12.0% · 12mo
- Down + closing
- —
- Monthly P&I
- —
- Monthly cashflow
- —
- DSCR
- —
- Eligible?
- —
Short-term bridge; refi at stabilization.
Rent comps 11 comps
| Address | Beds | Baths | Sqft | Rent | $/sqft | DOM | Units | Dist |
|---|---|---|---|---|---|---|---|---|
| 3506 Cactus Creek Dr Spring, TX | 3.0 | 3.0 | 2000 | $1,950 | $0.97 | 45d | 1 | 0.03mi |
| 29735 Legends Green Dr Spring, TX | 3.0 | 2.0 | 2180 | $3,300 | $1.51 | 26d | 1 | 0.31mi |
| 3111 Felton Springs Dr Spring, TX | 3.0 | 3.5 | 3427 | $1,550 | $0.45 | 45d | 1 | 0.52mi |
| 29311 Legends Hill Dr Spring, TX | 3.0 | 2.0 | 1768 | $1,901 | $1.08 | 0d | 1 | 0.59mi |
| 3330 Legends Mill Dr Spring, TX | 3.0 | 2.5 | 2310 | $2,175 | $0.94 | 14d | 1 | 0.60mi |
| 3323 Orchid Trace Dr Spring, TX | 3.0 | 2.0 | 2180 | $1,200 | $0.55 | 0d | 1 | 0.75mi |
| 29418 Fox River Dr Spring, TX | 3.0 | 2.0 | 1907 | $1,779 | $0.93 | 4d | 1 | 0.78mi |
| 29307 Atherstone St Spring, TX | 3.0 | 2.0 | 1764 | $1,745 | $0.99 | 23d | 1 | 0.94mi |
| 2115 Mercoal Dr Spring, TX | 3.0 | 2.0 | 2484 | $2,291 | $0.92 | 0d | 1 | 1.13mi |
| 30619 Victoria Estates Dr Spring, TX | 3.0 | 2.0 | 2421 | $2,200 | $0.91 | 26d | 1 | 1.29mi |
| 31323 Trinity Park Ln Spring, TX | 4.0 | 3.0 | 3252 | $2,595 | $0.80 | 26d | 1 | 1.42mi |
HOA detail
- Monthly dues
- $92 · $1,104/yr
- Likely covers
- poolgymsecurity
Listing history 15 events
-
2026-06-03days on market $250,000 Active 89 DOM
-
2026-06-02days on market $250,000 Active 88 DOM
-
2026-06-01days on market $250,000 Active 87 DOM
-
2026-05-31days on market $250,000 Active 86 DOM
-
2026-05-12status Active 586-char remark
Show marketing remark (586 chars)
Beautiful 4-bedroom Gehan home in a desirable gated community. The floor plan features a formal dining room, a spacious den with a fireplace, and a versatile game room. The primary suite includes a bath with a soaking tub and separate shower. This well-maintained home shows pride of ownership and offers the benefits of gated living, including added security and access to amenities like a community pool and fitness center. Conveniently located near parks, shopping, dining, and entertainment, it’s a great alternative to higher-priced areas while still close to city living.
-
2026-03-17historical Active Under Contract 586-char remark
Show marketing remark (586 chars)
Beautiful 4-bedroom Gehan home in a desirable gated community. The floor plan features a formal dining room, a spacious den with a fireplace, and a versatile game room. The primary suite includes a bath with a soaking tub and separate shower. This well-maintained home shows pride of ownership and offers the benefits of gated living, including added security and access to amenities like a community pool and fitness center. Conveniently located near parks, shopping, dining, and entertainment, it’s a great alternative to higher-priced areas while still close to city living.
-
2026-03-06$250,000 Active 586-char remark
Show marketing remark (586 chars)
Beautiful 4-bedroom Gehan home in a desirable gated community. The floor plan features a formal dining room, a spacious den with a fireplace, and a versatile game room. The primary suite includes a bath with a soaking tub and separate shower. This well-maintained home shows pride of ownership and offers the benefits of gated living, including added security and access to amenities like a community pool and fitness center. Conveniently located near parks, shopping, dining, and entertainment, it’s a great alternative to higher-priced areas while still close to city living.
-
2023-07-03historical
-
2023-05-17price $330,000
-
2022-10-28$360,000 Active
-
2006-12-27soldstatus
-
2006-09-01historical
-
2006-07-27$167,700
-
2006-07-27historical
-
2006-05-08$174,900
ⓘ Source: listings_history table (triggers on properties + properties_extension) + one-shot
backfill from property_details.listing_events for pre-trigger history.
Tax reassessment forecast TX · Resets to sale price
- Current annual tax
- $7,836 · $653/mo
- Projected year-2 tax
- $7,836 · $653/mo
- Expected delta
- $0/yr ($0/mo · 0.0%)
ⓘ Screening estimate from a state-policy table — verify with the county assessor before closing.
Climate risk First Street
- Flood 1/10 Low FEMA zone X (unshaded) · 0% chance over 30 yrs
- Wildfire 3/10 Moderate
- Heat 9/10 Extreme 7 d/yr ≥110°F today · 24 d/yr by 30 yrs out
- Wind 8/10 Severe 99% chance of damaging wind over 30 yrs
- Air quality 3/10 Moderate 3 unhealthy d/yr today · 3 by 30 yrs out
Nearby sold comps map
Loading sold comps map…
Walkable amenities ~0.75 mi
Loading nearby amenities…
Taxation est. · year 1
- Rental income
- $27,716
- − Mortgage interest
- −$14,004
- − Property taxes
- −$7,836
- − Insurance
- −$1,250
- − Repairs & maintenance
- −$2,217
- − Management
- −$2,217
- − HOA
- −$1,104
- − Depreciation
- −$7,273
- Taxable loss
- −$8,186
- Est. tax savings @ 24.0%
- +$1,965
- After-tax cash flow
- $-2,063/yr
For passive investors: Depreciation is non-cash, so a rental often shows a tax loss while cash-flowing — sheltering income. Rental losses are passive: they offset passive income freely, and up to $25,000/yr can offset ordinary (W-2) income if you actively participate and your MAGI is under $100k (phasing out to $0 by $150k); unused losses carry forward. On sale, claimed depreciation is recaptured at up to 25%, and gains may owe capital-gains tax (a 1031 exchange can defer both). Figures are a year-1 estimate at your 24.0% rate — not tax advice; consult a CPA.
Schools (NCES district)
- District
- Conroe ISD
- NCES district ID
- 4815000
- Math proficiency
- 57% ▼ -6.00%
- Reading proficiency
- 57% ▼ -1.00%
- Median HH income
- $71,541
- Composite
- 50.65/100
- National rank
- #1833
- State rank
- #69 of 826 in TX
Livability — Houston
- Score
- 74/100
- State rank
- #184
- US rank
- #4771
Category grades
Schools grade is shown separately in the Schools card above.
Census & demographics
- County
- Montgomery County · 663,713 people
- City population
- 3,226,434
- Metro
- Houston-The Woodlands-Sugar Land, TX
- Population (ZIP)
- 69,980
- Household income
- $132,469
- Rent vs Own
- Severe rent burden
- 1115.0
Population outlook (Montgomery County) Hauer SSP2
- Today (2025)
- 713,896 people
- By 2030
- 805,263 · +12.8%
- By 2040
- 992,708 · +39.1%
- By 2050
- 1,179,590 · +65.2%
- By 2075
- 1,628,084 · +128.1%
- By 2100
- 1,937,880 · +171.5%
Race, ethnicity, and origin ACS 2023
- Neighborhood character
- Diverse neighborhood (Simpson 0.61)
- Race & ethnicity
- White 58% Hispanic / Latino 22% Two or more races 14% Black 9% Asian 6%
- Hispanic origin (detail)
- Mexican 11% Cuban 1%
- Common ancestry
- Lithuanian 4% Romanian 2% Slovak 2%
- Foreign-born
- 15% · Canada, China, South Korea
- Languages at home
- 79% English-only · Spanish 12% Other Indo-European 3% Russian/Polish/Slavic 1%
Political lean MEDSL · Montgomery
- 2024 margin
- Solid R (+45.5) · D 26.8% · R 72.3%
- 2008→2024 swing
- +7.2pp toward D · 2008: -52.7pp · 2024: -45.5pp
- All cycles
- 2024: R+45.5 2020: R+43.8 2016: R+51.4 2012: R+60.7 2008: R+52.7
Not yet ingested
- Civics
- —
Market trends
- HPI YoY
- ▼ -35.74%
- Current HPI
- 226.3729
- Rent YoY
- ▲ 1.35%
- Metro
- Houston-The Woodlands-Sugar Land, TX
- State GDP YoY
- ▲ 3.95%
- F500 in state
- 110
Industry mix (Fortune 500 HQ in TX)
| Industry | F500 HQs | Revenue |
|---|---|---|
| Energy | 16 | $1,198B |
|
||
| Technology | 5 | $198B |
|
||
| Engineering / Construction | 4 | $72B |
|
||
| Energy Services | 3 | $60B |
|
||
| Utilities | 3 | $41B |
|
||
| Healthcare | 2 | $330B |
|
||
Price history
+42.9% since first listed11 events — show timeline
- 2026-05-12 Relisted — HARMLS
- 2026-03-17 Contingent — HARMLS
- 2026-03-06 Listed $250,000 HARMLS
- 2023-07-03 Listing Removed — HARMLS
- 2023-05-17 Price Changed $330,000 HARMLS
- 2022-10-28 Listed $360,000 HARMLS
- 2006-12-27 Sold (Public Records) — Public Records
- 2006-09-01 Listing Removed — HARMLS
- 2006-07-27 Listing Removed — HARMLS
- 2006-07-27 Listed $167,700 HARMLS
- 2006-05-08 Listed $174,900 HARMLS
Property tax history
+5.3%/yrLatest (2025): $7,836 · -1.1% YoY. Source: county tax records.
Cash-flow waterfall
monthlySold comps — $/sqft
last 12 mo · ≤1 miLoading sold comps…