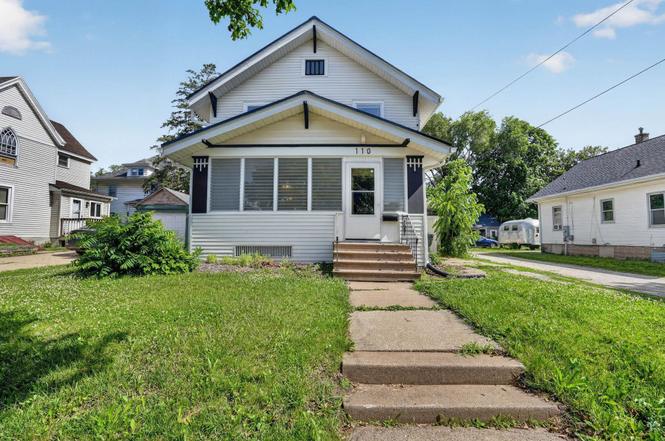
110 E 15th St · Cedar Falls, IA
Flood risk 1/10 · Minimal
- FEMA flood zone
- X (unshaded)
- Chance of flooding over 30 yrs
- 0.0%
- Est. flood insurance / yr
- $473 – $860
Fire risk 3/10 · Minor
- Est. fire insurance / yr
- $902 – $1,676
Heat risk 3/10 · Minor
- Hot days now (above 101°F)
- 7 days/yr
- Hot days in 30 yrs
- 15 days/yr
Wind risk 2/10 · Minimal
- Chance of severe wind over 30 yrs
- —
Air-quality risk 1/10 · Minimal
- Unhealthy air days now
- 0 days/yr
- Unhealthy air days in 30 yrs
- 0 days/yr
Risk factors via First Street. Map © Google.
Why this score? — see what drove the C grade
The composite is a weighted blend of 9 inputs, each scored 0–100. Each bar is that input's sub-score; the figure is the points it added to the 100-point composite (weight × sub-score).
- Cash flow +16.1/30.0
- ARV discount +15.0/15.0
- Schools +6.6/10.0
- DSCR +5.0/10.0
- 1% rule +4.3/10.0
- Livability +4.0/5.0
- Rent growth +3.0/5.0
- Condition / age +2.5/5.0
- Appreciation +0.0/10.0
$159,900
🖨 Deal sheet 📄 Offer letter ✓ Due diligence
Listing remarks
Welcome to 110 E 15th Street in Cedar Falls! Located just minutes from downtown Cedar Falls, this 1920 home is filled with character, space, and opportunity. The spacious main floor features generous living and dining areas, original woodwork, and an enclosed front porch that adds additional usable space. Beneath the current flooring, original hardwood floors are believed to remain, offering the possibility to restore some of the home's historic charm. With several finished living areas and a flexible layout, this property could appeal to owner-occupants, investors, or those looking for a renovation project. A little TLC could go a long way in bringing this classic home back to life. Whethe
Key facts
- Flexible layout
- Historic charm
- Enclosed front porch
Tags
Property features AI
Exterior
- Parking: Detached carport (1 space)
- Utilities: Public water; Public sewer
- Home design: Single-family residence; Two-story
- Construction: Aluminum siding; Metal roof
- Exterior features: Concrete road/drive surface; Lot approximately 48 x 66 (about 0.07 acre); R-1 zoning
Interior
- Bathrooms: One full bathroom; One three-quarter bathroom
- Heating & cooling: Forced air heating (natural gas); Central air conditioning
- Interior features: Partially finished basement; Basement present
- Laundry & utility: Laundry on lower level
Neighborhood map
What this means for you Summary
Snapshot
- This is a 3-bed/2.0-bath single-family listed at $160k.
Deal economics
- At list price, monthly cash flow is $82 ($984/yr) — positive.
- The deal already cash-flows at list — no discount required.
- To meet the 1% rule (rent ≥ 1% of price), the offer needs to be $149k (7.0% below list).
- Recommended offer: $149k (7.0% below list) — sets the bar for 1% rule.
- Cap rate 6.9% vs local median 3.1% in Cedar Falls — top-decile yield for the area; either an underpriced asset or a hidden risk that comps aren't pricing in. Stress-test before assuming the spread holds.
Location & tenants
- Location reads 81/100 on livability (#60 in IA, #1,357 nationally) — a professional / high-income tenant draw. Strengths: cost of living A+, housing A+, health & safety A+; Watch: amenities D, commute F.
- Cedar Falls Community School District (urban): math 76% / reading 79% proficiency, ranked #45 of 289 in IA (top 16%) — strong family-tenant draw, lease renewals of 3-5y typical; only 18% free/reduced lunch — higher-income household profile.
- Zoned schools: Lincoln Elementary School (math 66% / reading 71%, grade B+, #266 of 616 statewide, top 43%, 453 students, 45% FRL); Holmes Junior High School (math 79% / reading 78%, grade A+, #44 of 246 statewide, top 19%, 639 students, 28% FRL); Cedar Falls High School (math 74% / reading 78%, grade A-, #75 of 336 statewide, top 23%, 1,302 students, 24% FRL).
- Market conditions: Rents rising (+2.0%/yr); 387 active listings in the ZIP; 13 comparable units currently listed for rent nearby; rentals at typical pace (median 21d on market — plan ~3-4 weeks tenant-placement turnaround); 46% of comp listings sitting > 30 days — soft ceiling on asking rent; solid renter incomes; 287 units permitted in Black Hawk County in 2024 (67 in 5+ unit buildings).
Forward outlook
- Local home prices are declining (-3.0%/yr); year-one equity from $1k of loan paydown is wiped out by about $5k of value loss. Plan a longer hold.
- Black Hawk County population projected at +10% by 2050 — modest demand growth; plan on rents tracking national, not racing it.
Negotiation context
- Only 3 days on market — expect competitive offers; lowballing is unlikely to land.
Risks & watch-outs
- Watch-outs: built in 1920 — expect roof / HVAC / electrical / plumbing capex.
Questions for the listing agent
- Built in 1920 — when were the roof, HVAC, electrical panel, plumbing, and water heater last replaced?
- Is there a deadline driving the sale (1031 exchange, divorce, estate, relocation)? That informs how much negotiation room exists.
- Schools are A-rated — typically a magnet for longer-tenancy family renters. What's the average tenant stay here, and is there a school-zone premium baked into asking?
- What's the average days-on-market for RENTAL listings here right now (not sales)? A rising rental-DOM trend means longer vacancies and softer asking-rent achievability than the comps imply.
- What's the recent tenant-quality profile in this submarket — average credit score on applications, eviction rate, late-payment / NSF rate, and stable-employment percentage? A property-management company in the area should have these aggregated.
- How much new for-sale + rental construction is in the pipeline within 1–3 miles? Heavy new supply typically softens prices + rents 12–24 months out; constrained supply supports both.
Investment metrics
- 1% rule
- 0.93% ✗
- Cap rate
- 6.91%
- Cash-on-cash
- 2.20%
- DSCR
- 1.10
- GRM
- 9.0
CMA / ARV
- ARV (on-the-fly)
- $197,296
- Comps found
- 12
Show comp detail 12 sales within ~0.75 mi
| Address | Dist | Beds/Ba | Sqft | Sold | Price | $/sf | Match |
|---|---|---|---|---|---|---|---|
| 1422 Main St | 0.01mi | 4/2.0 (+1) | 1,732 (+4%) | 1mo | $160,000 | $92 | 88 |
| 1632 East St | 0.37mi | 4/3.0 (+1) | 1,712 (+2%) | 0mo | $220,000 | $129 | 69 |
| 118 W 11th St | 0.24mi | 4/1.0 (+1) | 1,768 (+6%) | 6mo | $208,000 | $118 | 65 |
| 211 W 9th St | 0.40mi | 3/1.5 | 1,574 (-6%) | 6mo | $185,000 | $118 | 64 |
| 921 Tremont St | 0.45mi | 4/1.0 (+1) | 1,700 (+2%) | 6mo | $247,000 | $145 | 62 |
| 909 Grove St | 0.38mi | 3/2.0 | 1,462 (-13%) | 1mo | $180,000 | $123 | 61 |
| 1316 Franklin St | 0.23mi | 3/1.0 | 1,440 (-14%) | 6mo | $156,000 | $108 | 57 |
| 2015 Waterloo Rd | 0.67mi | 4/2.0 (+1) | 1,736 (+4%) | 2mo | $192,500 | $111 | 56 |
| 912 Melrose Drive Dr | 0.71mi | 4/2.0 (+1) | 1,722 (+3%) | 3mo | $250,500 | $145 | 55 |
| 1710 College St | 0.56mi | 4/2.0 (+1) | 1,577 (-6%) | 6mo | $167,500 | $106 | 55 |
| 623 W 6th St | 0.71mi | 3/1.0 | 1,463 (-12%) | 2mo | $182,000 | $124 | 41 |
| 2121 Walnut St | 0.67mi | 4/2.0 (+1) | 1,920 (+15%) | 2mo | $173,000 | $90 | 37 |
Match score weights: distance 35% · size 25% · config 20% · recency 20%. Top-matched comps best support the ARV.
Projected returns pro-forma
-3.0% appreciation · 1.97% rent growth · sell at horizon
- IRR
- -14.0%
- Equity multiple
- 0.50×
- Total profit
- $-22,199
- Equity at exit
- $23,842
- IRR
- -6.8%
- Equity multiple
- 0.58×
- Total profit
- $-18,677
- Equity at exit
- $13,825
Cash invested: $44,772 (down + closing). Projections, not guarantees.
Landlord ↔ Tenant lean methodology
- Overall (STATE)
- 83 Strongly Landlord-Friendly
- State Iowa
- 83 Strongly Landlord-Friendly · R+6
- County
- — inherits STATE
- City
- — inherits STATE
ZIP-level market 50613
- Rents YoY
- 2.0%
- Active inventory
- 387
- Price-to-rent
- 9.0×
Monthly cashflow live
- Estimated rent
- $1,487 high interval (Pro) →
- Mortgage (P&I)
- −$839
- Tax from tax record
- −$188 /mo · $2,252/yr
- Insurance
- −$67
- HOA
- −$0
- Vacancy / Maint / Mgmt
- −$312
- Net cashflow
- $82
Break-even live
UW: 25.0% down · 7.5% · 30yr · 1.5% tax · 5.0% vac · 8.0% maint · 8.0% mgmt
Financing live
Cash to close
- Down payment
- $39,975
- Closing costs
- $4,797
- Reserves months
- —
- Total cash needed
- —
Loan-product check · same deal, 3 products live
Conventional
25% down · 7.5% · 30yr
- Down + closing
- —
- Monthly P&I
- —
- Monthly cashflow
- —
- DSCR
- —
- Eligible?
- —
Personal DTI + credit; lowest rate.
DSCR
20% down · 8.5% · 30yr
- Down + closing
- —
- Monthly P&I
- —
- Monthly cashflow
- —
- DSCR
- —
- Eligible?
- —
No personal income docs; deal must DSCR.
Hard money
10% down · 12.0% · 12mo
- Down + closing
- —
- Monthly P&I
- —
- Monthly cashflow
- —
- DSCR
- —
- Eligible?
- —
Short-term bridge; refi at stabilization.
Rent comps 13 comps
| Address | Beds | Baths | Sqft | Rent | $/sqft | DOM | Units | Dist |
|---|---|---|---|---|---|---|---|---|
| 1014 Main St Cedar Falls, IA | 2.0 | 1.0 | 1400 | $1,500 | $1.07 | 43d | 1 | 0.28mi |
| 1803 Franklin St Unit 1803 Cedar Falls, IA | 4.0 | 1.0 | 1200 | $1,400 | $1.17 | 43d | 1 | 0.32mi |
| 2110 Melrose Ct Cedar Falls, IA | 4.0 | 2.0 | 1100 | $1,250 | $1.14 | 21d | 1 | 0.53mi |
| 221 E 5th St #209 Cedar Falls, IA | 2.0 | 2.0 | 1200 | $2,000 | $1.67 | 43d | 1 | 0.62mi |
| 2208 Walnut St Cedar Falls, IA | 3.0 | 1.0 | 1380 | $1,400 | $1.01 | 43d | 1 | 0.67mi |
| 604 W Seerley Blvd Cedar Falls, IA | 4.0 | 1.5 | 1600 | $1,300 | $0.81 | 21d | 1 | 0.75mi |
| 2311 Olive St Cedar Falls, IA | 3.0–4.0 | 1.0 | 1050 | $995 | $0.95 | 21d | 2 | 0.77mi |
| 1902 Campus St Cedar Falls, IA | 3.0 | 2.0 | 1300 | $1,350 | $1.04 | 21d | 1 | 0.83mi |
| 2515 Olive St Cedar Falls, IA | 3.0 | 1.0 | 1380 | $975 | $0.71 | 21d | 1 | 0.89mi |
| 2609 Olive St Cedar Falls, IA | 4.0 | 2.0–2.5 | 1568 | $1,750 | $1.12 | 21d | 6 | 0.94mi |
| 1320-1322 Delta Dr Unit 1322 (South Side) Cedar Falls, IA | 3.0 | 2.0 | 1664 | $1,350 | $0.81 | 43d | 1 | 1.07mi |
| 1823-1825 Alden Ave Unit 1825 Cedar Falls, IA | 2.0 | 1.0 | 1133 | $1,250 | $1.10 | 43d | 1 | 1.16mi |
| 1815 W 18th St Cedar Falls, IA | 1.0–3.0 | 1.0–3.0 | 1065 | $1,500 | $1.41 | 21d | 7 | 1.18mi |
Listing history 4 events
-
2026-06-19days on market $159,900 Active 3 DOM
-
2026-06-18days on market $159,900 Active 2 DOM
-
2026-06-17remarks 699-char remark
-
2026-06-17$159,900 Active 1 DOM
ⓘ Source: listings_history table (triggers on properties + properties_extension) + one-shot
backfill from property_details.listing_events for pre-trigger history.
Tax reassessment forecast IA · Partial reset (capped growth)
- Current annual tax
- $2,252 · $188/mo
- Projected year-2 tax
- $2,381 · $198/mo
- Expected delta
- +$129/yr (+$11/mo · 5.7%)
ⓘ Screening estimate from a state-policy table — verify with the county assessor before closing.
Climate risk First Street
- Flood 1/10 Low FEMA zone X (unshaded) · 0% chance over 30 yrs
- Wildfire 3/10 Moderate
- Heat 3/10 Moderate 7 d/yr ≥101°F today · 15 d/yr by 30 yrs out
- Wind 2/10 Low
- Air quality 1/10 Low 0 unhealthy d/yr today · 0 by 30 yrs out
Nearby sold comps map
Loading sold comps map…
Walkable amenities ~0.75 mi
Loading nearby amenities…
Taxation est. · year 1
- Rental income
- $17,845
- − Mortgage interest
- −$8,957
- − Property taxes
- −$2,252
- − Insurance
- −$800
- − Repairs & maintenance
- −$1,428
- − Management
- −$1,428
- − Depreciation
- −$4,652
- Taxable loss
- −$1,670
- Est. tax savings @ 24.0%
- +$401
- After-tax cash flow
- $1,385/yr
For passive investors: Depreciation is non-cash, so a rental often shows a tax loss while cash-flowing — sheltering income. Rental losses are passive: they offset passive income freely, and up to $25,000/yr can offset ordinary (W-2) income if you actively participate and your MAGI is under $100k (phasing out to $0 by $150k); unused losses carry forward. On sale, claimed depreciation is recaptured at up to 25%, and gains may owe capital-gains tax (a 1031 exchange can defer both). Figures are a year-1 estimate at your 24.0% rate — not tax advice; consult a CPA.
Schools (NCES district)
- District
- Cedar Falls Community School District
- NCES district ID
- 1906510
- Math proficiency
- 76% ▼ -6.00%
- Reading proficiency
- 79% ▼ -2.00%
- Median HH income
- $53,634
- Composite
- 65.93/100
- National rank
- #443
- State rank
- #45 of 289 in IA
Livability — Cedar Falls
- Score
- 81/100
- State rank
- #60
- US rank
- #1357
Category grades
Schools grade is shown separately in the Schools card above.
Census & demographics
- Census place
- Cedar Falls, IA
- County
- Black Hawk County · 112,933 people
- City population
- 43,867
- Metro
- Waterloo-Cedar Falls, IA
- Population (ZIP)
- 43,867
- Household income
- $78,503
- Rent vs Own
- Severe rent burden
- 1514.0
Population outlook (Black Hawk County) Hauer SSP2
- Today (2025)
- 139,716 people
- By 2030
- 142,853 · +2.2%
- By 2040
- 147,843 · +5.8%
- By 2050
- 153,247 · +9.7%
- By 2075
- 167,977 · +20.2%
- By 2100
- 177,320 · +26.9%
Race, ethnicity, and origin ACS 2023
- Neighborhood character
- Predominantly White (90%)
- Race & ethnicity
- White 90% Asian 3% Two or more races 3% Hispanic / Latino 3% Black 1%
- Common ancestry
- Portuguese 6% Italian 3% Iranian 3%
- Foreign-born
- 4% · Canada, South Korea
- Languages at home
- 95% English-only · Spanish 2% Russian/Polish/Slavic 1% Other Indo-European 1%
Political lean MEDSL · Black Hawk
- 2024 margin
- Toss-up / Even · D 50.0% · R 48.8% · Other 1.2%
- 2008→2024 swing
- -21.3pp toward R · 2008: 22.4pp · 2024: 1.2pp
- All cycles
- 2024: D+1.2 2020: D+9.0 2016: D+7.3 2012: D+20.0 2008: D+22.4
Not yet ingested
- Civics
- —
Market trends
- HPI YoY
- ▼ -175.51%
- Current HPI
- 169.0591
- Rent YoY
- ▲ 1.97%
- Metro
- Waterloo-Cedar Falls, IA
- State GDP YoY
- ▲ 2.48%
- F500 in state
- 4
Industry mix (Fortune 500 HQ in IA)
| Industry | F500 HQs | Revenue |
|---|---|---|
| Financial Services | 1 | $16B |
|
||
| Retail / Convenience | 1 | $15B |
|
||
Price history
1 event — show timeline
- 2026-06-17 Listed $159,900 NEIRBR as distributed by MLS GRID
Property tax history
+1.2%/yrLatest (2025): $2,252 · -4.0% YoY. Source: county tax records.
Cash-flow waterfall
monthlySold comps — $/sqft
last 12 mo · ≤1 miLoading sold comps…