 🏷️ Likely Rental
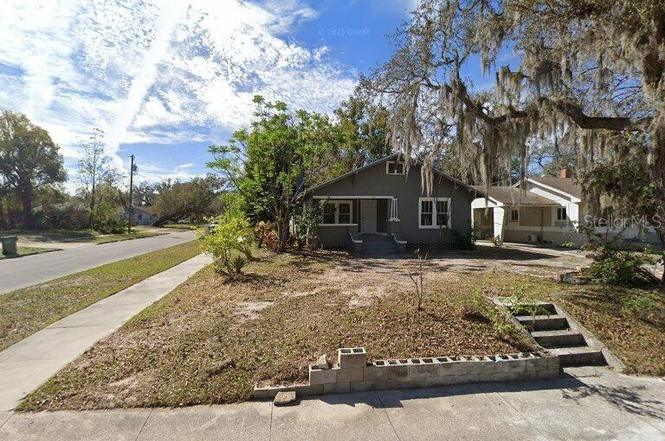
1803 High St · Leesburg, FL
Flood risk 1/10 · Minimal
- FEMA flood zone
- X (unshaded)
- Chance of flooding over 30 yrs
- 0.0%
- Est. flood insurance / yr
- $507 – $1,088
Fire risk 3/10 · Minor
- Est. fire insurance / yr
- $947 – $1,759
Heat risk 8/10 · Major
- Hot days now (above 108°F)
- 7 days/yr
- Hot days in 30 yrs
- 22 days/yr
Wind risk 9/10 · Severe
- Chance of severe wind over 30 yrs
- 99.0%
Air-quality risk 2/10 · Minimal
- Unhealthy air days now
- 1 days/yr
- Unhealthy air days in 30 yrs
- 1 days/yr
Risk factors via First Street. Map © Google.
Why this score? — see what drove the B- grade
The composite is a weighted blend of 9 inputs, each scored 0–100. Each bar is that input's sub-score; the figure is the points it added to the 100-point composite (weight × sub-score).
- Cash flow +24.2/30.0
- ARV discount +15.0/15.0
- DSCR +7.8/10.0
- 1% rule +6.0/10.0
- Schools +4.2/10.0
- Livability +3.1/5.0
- Condition / age +2.5/5.0
- Rent growth +2.3/5.0
- Appreciation +0.0/10.0
$139,000
🖨 Deal sheet 📄 Offer letter ✓ Due diligence
Listing remarks MLS
Great Square Footage, nice size bedrooms, kitchen has oak cabinets, 10x14 Florida room, on front of house , screened porch on back with washer dryer hook-up. Hardwood floors in living room with brick fireplace. Being sold 'As Is'House needs some TLC. It has been rented for the last 8 years, currently rented below market rental rate. Tenant on a month to month lease. House could be charming! Total area over 1,532 SF
Key facts
- 7,000 sq ft lot
- Built 1939
- Listed 189 days
Property features AI
Finance
- Other: Lot size approximately 0.16 acre (about 650 sq m)
- Financial info: No lease restrictions; Tax year 2024
- HOA & community: No HOA/association reported
Exterior
- Parking: Driving directions available
- Security: No security features listed
- Utilities: Water source: None; Sewer: Other; Utilities: Other
- Home design: Single family residence; Residential property; One level; North-facing
- Construction: Block construction; Shingle roof; Slab foundation; Built area about 1,212
- Exterior features: Other exterior features
Interior
- Kitchen: No appliances listed
- Bedrooms: 3 bedrooms
- Flooring: Carpet flooring
- Bathrooms: 1 full bathroom
- Heating & cooling: Heating: Other; Cooling: Other
- Interior features: No specific interior features listed
- Laundry & utility: Laundry: Other
Neighborhood map
What this means for you Summary
Snapshot
- This is a 3-bed/1.0-bath single-family listed at $139k.
Deal economics
- At list price, monthly cash flow is $277 ($3k/yr) — positive.
- The deal already cash-flows at list — no discount required.
- Meets the 1% rule at list price ($2k rent vs $139k).
- Recommended offer: $122k (12.0% below list) — sets the bar for market timing.
- Cap rate 8.7% vs local median 4.5% in Leesburg — top-decile yield for the area; either an underpriced asset or a hidden risk that comps aren't pricing in. Stress-test before assuming the spread holds.
Location & tenants
- Location reads 62/100 on livability (#751 in FL) — a middle-class / working-renter tenant base. Strengths: cost of living A+, housing A+; Watch: schools D+, crime D, amenities F.
- Lake (suburban): math 49% / reading 50% proficiency, ranked #37 of 73 in FL (top 51%) — families likely to look elsewhere, expect single-tenant / working-renter base with shorter leases.
- Market conditions: Rents soft (-0.9%/yr); 783 active listings in the ZIP; 37 comparable units currently listed for rent nearby; rentals at typical pace (median 24d on market — plan ~3-4 weeks tenant-placement turnaround); 4,799 units permitted in Lake County in 2024 (814 in 5+ unit buildings).
- This rent runs 32% of the median local income ($58k/yr) — at the standard rent-burdened threshold; future hikes will face affordability resistance.
Forward outlook
- Local home prices are declining (-3.0%/yr); year-one equity from $961 of loan paydown is wiped out by about $4k of value loss. Plan a longer hold.
- Lake County population projected at +37% by 2050 — long-run rental-demand tailwind backs the buy-and-hold thesis.
Negotiation context
- It's been on market 189 days — a 12% lower offer ($122k) is reasonable based on typical stale-listing flexibility.
- 3 sale attempts since 21y ago with the ask held roughly flat each time — persistent listings suggest the price (not the market) is what's stuck; bring a comps-based counter.
- Current owner paid $60k; list at $139k implies a 132% gain — meaningful room to come down on a strong offer.
Risks & watch-outs
- Watch-outs: built in 1939 — expect roof / HVAC / electrical / plumbing capex.
- Climate carrying-cost: severe wind risk, 99% chance of damaging wind over 30y; extreme-heat days projected 7→22/yr by 2055 (HVAC capex compounding) — expect insurance premiums to compound above CPI over the hold.
Questions for the listing agent
- It's been on market 189 days. Have you received any prior offers? Is the seller open to a 12% concession, seller financing, or rate buy-down credit?
- Built in 1939 — when were the roof, HVAC, electrical panel, plumbing, and water heater last replaced?
- Why hasn't it sold? Are there any deal-killer items the seller is aware of (foundation, flood, title, zoning, code violations)?
- Is there a deadline driving the sale (1031 exchange, divorce, estate, relocation)? That informs how much negotiation room exists.
- Schools are D-rated, which usually means shorter tenancies and higher turnover. Who's the typical renter profile here, and what's been the actual vacancy rate?
- Crime grade is D in this area — have there been break-ins, vandalism, or insurance claims at this property in the last 3 years? What carrier currently insures it and at what premium?
- What's the average days-on-market for RENTAL listings here right now (not sales)? A rising rental-DOM trend means longer vacancies and softer asking-rent achievability than the comps imply.
- What's the recent tenant-quality profile in this submarket — average credit score on applications, eviction rate, late-payment / NSF rate, and stable-employment percentage? A property-management company in the area should have these aggregated.
- How much new for-sale + rental construction is in the pipeline within 1–3 miles? Heavy new supply typically softens prices + rents 12–24 months out; constrained supply supports both.
Investment metrics
- 1% rule
- 1.10% ✓
- Cap rate
- 8.69%
- Cash-on-cash
- 8.55%
- DSCR
- 1.38
- GRM
- 7.6
CMA / ARV
- ARV (on-the-fly)
- $184,224
- Comps found
- 11
Show comp detail 11 sales within ~0.75 mi
| Address | Dist | Beds/Ba | Sqft | Sold | Price | $/sf | Match |
|---|---|---|---|---|---|---|---|
| 305 N Moss St | 0.14mi | 3/2.0 | 1,228 (+1%) | 17mo | $80,000 | $65 | 73 |
| 2304 Vine St | 0.48mi | 3/1.0 | 1,181 (-3%) | 2mo | $172,000 | $146 | 72 |
| 1404 High St | 0.32mi | 3/1.0 | 1,246 (+3%) | 14mo | $164,000 | $132 | 69 |
| 2303 Mahoney Ave | 0.56mi | 2/2.0 (-1) | 1,196 (-1%) | 0mo | $225,000 | $188 | 62 |
| 108 N Oakland St | 0.03mi | 3/1.0 | 1,056 (-13%) | 18mo | $160,000 | $152 | 62 |
| 2104 South St | 0.71mi | 2/1.0 (-1) | 1,108 (-9%) | 0mo | $59,990 | $54 | 48 |
| 903 N Chester St | 0.63mi | 3/1.5 | 1,186 (-2%) | 22mo | $190,000 | $160 | 46 |
| 811 S Lone Oak Dr | 0.71mi | 3/1.0 | 1,104 (-9%) | 7mo | $190,000 | $172 | 46 |
| 601 S 12th St | 0.69mi | 3/2.0 | 1,327 (+10%) | 10mo | $240,000 | $181 | 40 |
| 726 Scenic St | 0.73mi | 3/2.0 | 1,075 (-11%) | 9mo | $230,000 | $214 | 36 |
| 1200 Sunshine Ave | 0.65mi | 3/2.0 | 1,360 (+12%) | 16mo | $133,273 | $98 | 32 |
Match score weights: distance 35% · size 25% · config 20% · recency 20%. Top-matched comps best support the ARV.
Projected returns pro-forma
-3.0% appreciation · 0.0% rent growth · sell at horizon
- IRR
- -6.7%
- Equity multiple
- 0.76×
- Total profit
- $-9,354
- Equity at exit
- $20,725
- IRR
- -1.2%
- Equity multiple
- 0.93×
- Total profit
- $-2,746
- Equity at exit
- $12,018
Cash invested: $38,920 (down + closing). Projections, not guarantees.
Landlord ↔ Tenant lean methodology
- Overall (STATE)
- 87 Strongly Landlord-Friendly
- State Florida
- 87 Strongly Landlord-Friendly · R+3
- County
- — inherits STATE
- City
- — inherits STATE
ZIP-level market 34748
- Home prices YoY
- -25.3%
- Rents YoY
- -0.9%
- Active inventory
- 783
- Price-to-rent
- 7.6×
Monthly cashflow live
- Estimated rent
- $1,533 high interval (Pro) →
- Mortgage (P&I)
- −$729
- Tax from tax record
- −$147 /mo · $1,766/yr
- Insurance
- −$58
- HOA
- −$0
- Vacancy / Maint / Mgmt
- −$322
- Net cashflow
- $277
Break-even live
UW: 25.0% down · 7.5% · 30yr · 1.5% tax · 5.0% vac · 8.0% maint · 8.0% mgmt
Financing live
Cash to close
- Down payment
- $34,750
- Closing costs
- $4,170
- Reserves months
- —
- Total cash needed
- —
Loan-product check · same deal, 3 products live
Conventional
25% down · 7.5% · 30yr
- Down + closing
- —
- Monthly P&I
- —
- Monthly cashflow
- —
- DSCR
- —
- Eligible?
- —
Personal DTI + credit; lowest rate.
DSCR
20% down · 8.5% · 30yr
- Down + closing
- —
- Monthly P&I
- —
- Monthly cashflow
- —
- DSCR
- —
- Eligible?
- —
No personal income docs; deal must DSCR.
Hard money
10% down · 12.0% · 12mo
- Down + closing
- —
- Monthly P&I
- —
- Monthly cashflow
- —
- DSCR
- —
- Eligible?
- —
Short-term bridge; refi at stabilization.
Rent comps 37 comps
| Address | Beds | Baths | Sqft | Rent | $/sqft | DOM | Units | Dist |
|---|---|---|---|---|---|---|---|---|
| 1801 Center St Unit 2 Leesburg, FL | 2.0 | 1.0 | 754 | $1,300 | $1.72 | 23d | 1 | 0.14mi |
| 200 S Moss St Leesburg, FL | 3.0 | 2.0 | 968 | $1,500 | $1.55 | 23d | 1 | 0.21mi |
| 210 N Lone Oak Dr Unit 1 Leesburg, FL | 2.0 | 1.0 | 912 | $1,250 | $1.37 | 14d | 1 | 0.41mi |
| 1112 W Main St Unit B-5 Leesburg, FL | 2.0 | 2.0 | 1000 | $1,400 | $1.40 | 23d | 1 | 0.66mi |
| 301 S 11th St Leesburg, FL | 2.0 | 1.0 | 816 | $1,450 | $1.78 | 23d | 1 | 0.67mi |
| 200 S 11th St Unit 102 Leesburg, FL | 2.0 | 2.5 | 1379 | $1,675 | $1.21 | 23d | 1 | 0.68mi |
| 200 S 11th St Leesburg, FL | 2.0 | 2.0 | 1379 | $1,675 | $1.21 | 23d | 1 | 0.69mi |
| 1220 W Dixie Ave Leesburg, FL | 3.0 | 2.0 | 1304 | $1,600 | $1.23 | 4d | 1 | 0.74mi |
| 1009 McCormack St Leesburg, FL | 2.0 | 1.0 | 1400 | $1,025 | $0.73 | 23d | 1 | 0.75mi |
| 822 S Lone Oak Dr Unit B Leesburg, FL | 2.0 | 1.0 | 900 | $1,195 | $1.33 | 23d | 1 | 0.76mi |
| 1013 Beecher St Unit 1 Leesburg, FL | 3.0 | 1.0 | 900 | $1,250 | $1.39 | 21d | 1 | 0.78mi |
| 1711 Birchwood Cir Unit 2 Leesburg, FL | 2.0 | 1.0 | 770 | $900 | $1.17 | 23d | 1 | 0.78mi |
| 1015 Beecher St Unit 1 Leesburg, FL | 2.0 | 1.0 | 853 | $1,100 | $1.29 | 23d | 1 | 0.79mi |
| 1020 Birchwood Ct Unit 2 Leesburg, FL | 2.0 | 1.0 | 1230 | $1,250 | $1.02 | 17d | 1 | 0.82mi |
| 1009 Nebraska St Leesburg, FL | 3.0 | 1.0 | 864 | $1,850 | $2.14 | 12d | 1 | 0.85mi |
| 716 Marietta St Leesburg, FL | 3.0 | 2.0 | 1250 | $1,600 | $1.28 | 23d | 1 | 0.86mi |
| 1604 Woodlyn Dr Leesburg, FL | 3.0 | 1.5 | 1088 | $1,500 | $1.38 | 23d | 1 | 0.90mi |
| 913 Sumter St Unit 102 Leesburg, FL | 2.0 | 2.0 | 1080 | $1,395 | $1.29 | 17d | 1 | 0.91mi |
| 1419 Hill St Leesburg, FL | 2.0 | 1.0 | 840 | $1,120 | $1.33 | 23d | 1 | 0.93mi |
| 1415 Hill St Leesburg, FL | 2.0 | 1.0 | 1000 | $1,150 | $1.15 | 23d | 1 | 0.93mi |
| 1411 Hill St Leesburg, FL | 2.0 | 1.0 | 1000 | $1,150 | $1.15 | 23d | 1 | 0.94mi |
| 1001 Crawford St Leesburg, FL | 3.0 | 1.0 | 800 | $1,100 | $1.38 | 11d | 1 | 0.95mi |
| 1001 Crawford St Unit 1 Leesburg, FL | 3.0 | 1.0 | 800 | $1,100 | $1.38 | 14d | 1 | 0.95mi |
| 706 Lee St Apt B Leesburg, FL | 2.0 | 1.0 | 860 | $1,200 | $1.40 | 23d | 1 | 0.95mi |
| 2602 Houston Pl Leesburg, FL | 2.0 | 2.0 | 960 | $1,895 | $1.97 | 4d | 1 | 0.96mi |
| 502 Old Colony Rd Leesburg, FL | 3.0 | 2.0 | 1456 | $1,299 | $0.89 | 23d | 1 | 0.97mi |
| 400 S 6th St Leesburg, FL | 2.0 | 1.0 | 700 | $1,250 | $1.79 | 23d | 1 | 0.98mi |
| 643 W Oak Terrace Dr Unit B1 Leesburg, FL | 2.0 | 2.0 | 1089 | $1,300 | $1.19 | 23d | 1 | 0.99mi |
| 513 Old Colony Rd Leesburg, FL | 3.0 | 2.0 | 1198 | $1,699 | $1.42 | 4d | 1 | 1.00mi |
| 1223 Pamela St Leesburg, FL | 2.0 | 1.0 | 894 | $1,399 | $1.56 | 23d | 1 | 1.07mi |
| 325 S 2nd St Unit 206 Leesburg, FL | 2.0 | 2.0 | 1000 | $1,700 | $1.70 | 4d | 1 | 1.07mi |
| 1317 Cambridge Dr Leesburg, FL | 3.0 | 1.5 | 1240 | $1,600 | $1.29 | 23d | 1 | 1.08mi |
| 813 S 9th St Leesburg, FL | 2.0 | 2.0 | 1400 | $2,000 | $1.43 | 23d | 1 | 1.09mi |
| 1321 Cambridge Dr Leesburg, FL | 4.0 | 2.0 | 912 | $1,800 | $1.97 | 17d | 1 | 1.10mi |
| 1 Herald Dr Leesburg, FL | 2.0 | 1.0–1.5 | 970 | $1,524 | $1.57 | 4d | 4 | 1.13mi |
| 1401 Floradel Ave Leesburg, FL | 2.0 | 1.0 | 1190 | $1,495 | $1.26 | 3d | 1 | 1.20mi |
| 1004 Royal Oak Blvd Unit 1004 Leesburg, FL | 2.0 | 2.5 | 1244 | $1,550 | $1.25 | 3d | 1 | 1.48mi |
Listing history 24 events
-
2026-06-18days on market $139,000 Active 189 DOM
-
2026-06-17days on market $139,000 Active 188 DOM
-
2026-06-16days on market $139,000 Active 187 DOM
-
2026-06-15days on market $139,000 Active 186 DOM
-
2026-06-13days on market $139,000 Active 184 DOM
-
2026-06-09days on market $139,000 Active 180 DOM
-
2026-06-08days on market $139,000 Active 179 DOM
-
2026-06-07days on market $139,000 Active 178 DOM
-
2026-06-04days on market $139,000 Active 175 DOM
-
2026-06-03days on market $139,000 Active 174 DOM
-
2026-06-02days on market $139,000 Active 173 DOM
-
2026-06-02days on market $139,000 Active 172 DOM
-
2026-05-31days on market $139,000 Active 171 DOM
-
2025-12-19status Active
-
2025-10-13status Pending
-
2025-10-06$139,000 Active
-
2010-12-09soldstatus $60,000
-
2005-06-10soldstatus $70,000
-
2005-06-07soldstatus $70,000 418-char remark
Show marketing remark (418 chars)
Great Square Footage, nice size bedrooms, kitchen has oak cabinets, 10x14 Florida room, on front of house , screened porch on back with washer dryer hook-up. Hardwood floors in living room with brick fireplace. Being sold 'As Is'House needs some TLC. It has been rented for the last 8 years, currently rented below market rental rate. Tenant on a month to month lease. House could be charming! Total area over 1,532 SF
-
2005-04-22$75,000 418-char remark
Show marketing remark (418 chars)
Great Square Footage, nice size bedrooms, kitchen has oak cabinets, 10x14 Florida room, on front of house , screened porch on back with washer dryer hook-up. Hardwood floors in living room with brick fireplace. Being sold 'As Is'House needs some TLC. It has been rented for the last 8 years, currently rented below market rental rate. Tenant on a month to month lease. House could be charming! Total area over 1,532 SF
-
1997-03-06soldstatus $48,900
-
1991-02-01soldstatus $38,500
-
1989-07-01soldstatus $31,000
-
1981-06-01soldstatus $30,000
ⓘ Source: listings_history table (triggers on properties + properties_extension) + one-shot
backfill from property_details.listing_events for pre-trigger history.
Tax reassessment forecast FL · Resets to sale price
- Current annual tax
- $1,766 · $147/mo
- Projected year-2 tax
- $1,766 · $147/mo
- Expected delta
- $0/yr ($0/mo · 0.0%)
ⓘ Screening estimate from a state-policy table — verify with the county assessor before closing.
Climate risk First Street
- Flood 1/10 Low FEMA zone X (unshaded) · 0% chance over 30 yrs
- Wildfire 3/10 Moderate
- Heat 8/10 Severe 7 d/yr ≥108°F today · 22 d/yr by 30 yrs out
- Wind 9/10 Extreme 99% chance of damaging wind over 30 yrs
- Air quality 2/10 Low 1 unhealthy d/yr today · 1 by 30 yrs out
Nearby sold comps map
Loading sold comps map…
Walkable amenities ~0.75 mi
Loading nearby amenities…
Taxation est. · year 1
- Rental income
- $18,399
- − Mortgage interest
- −$7,786
- − Property taxes
- −$1,766
- − Insurance
- −$695
- − Repairs & maintenance
- −$1,472
- − Management
- −$1,472
- − Depreciation
- −$4,044
- Taxable income
- $1,164
- Est. tax owed @ 24.0%
- −$279
- After-tax cash flow
- $3,047/yr
For passive investors: Depreciation is non-cash, so a rental often shows a tax loss while cash-flowing — sheltering income. Rental losses are passive: they offset passive income freely, and up to $25,000/yr can offset ordinary (W-2) income if you actively participate and your MAGI is under $100k (phasing out to $0 by $150k); unused losses carry forward. On sale, claimed depreciation is recaptured at up to 25%, and gains may owe capital-gains tax (a 1031 exchange can defer both). Figures are a year-1 estimate at your 24.0% rate — not tax advice; consult a CPA.
Schools (NCES district)
- District
- Lake
- NCES district ID
- 1201050
- Math proficiency
- 49% ▼ -7.00%
- Reading proficiency
- 50% ▼ -4.00%
- Median HH income
- $46,632
- Composite
- 42.05/100
- National rank
- #3327
- State rank
- #37 of 73 in FL
Livability — Leesburg
- Score
- 62/100
- State rank
- #751
- US rank
- #16429
Category grades
Schools grade is shown separately in the Schools card above.
Census & demographics
- Census place
- Leesburg, FL
- County
- Lake County · 364,602 people
- City population
- 70,232
- Metro
- Orlando-Kissimmee-Sanford, FL
- Population (ZIP)
- 48,095
- Household income
- $58,192
- Rent vs Own
- Severe rent burden
- 1745.0
Population outlook (Lake County) Hauer SSP2
- Today (2025)
- 386,640 people
- By 2030
- 417,107 · +7.9%
- By 2040
- 476,676 · +23.3%
- By 2050
- 531,296 · +37.4%
- By 2075
- 648,303 · +67.7%
- By 2100
- 698,530 · +80.7%
Race, ethnicity, and origin ACS 2023
- Neighborhood character
- Majority White (64%)
- Race & ethnicity
- White 64% Black 16% Hispanic / Latino 15% Two or more races 9% Asian 1%
- Hispanic origin (detail)
- Mexican 4% Puerto Rican 5% Cuban 3%
- Common ancestry
- Romanian 3% Lithuanian 3% Slovak 2%
- Foreign-born
- 9% · Canada, Vietnam, Jamaica
- Languages at home
- 88% English-only · Spanish 10% French/Haitian/Cajun 1%
Political lean MEDSL · Lake
- 2024 margin
- Strong R (+24.7) · D 37.3% · R 62.0%
- 2008→2024 swing
- -11.2pp toward R · 2008: -13.5pp · 2024: -24.7pp
- All cycles
- 2024: R+24.7 2020: R+20.0 2016: R+23.1 2012: R+17.1 2008: R+13.5
Not yet ingested
- Civics
- —
Market trends
- HPI YoY
- ▼ -88.97%
- Current HPI
- 262.1766
- Rent YoY
- ▼ -0.95%
- Metro
- Orlando-Kissimmee-Sanford, FL
- State GDP YoY
- ▲ 3.28%
- F500 in state
- 36
Industry mix (Fortune 500 HQ in FL)
| Industry | F500 HQs | Revenue |
|---|---|---|
| Industrial Technology | 2 | $29B |
|
||
| Insurance | 2 | $17B |
|
||
| Retail | 1 | $60B |
|
||
| Technology Distribution | 1 | $58B |
|
||
| Homebuilding | 1 | $35B |
|
||
| Technology Manufacturing | 1 | $35B |
|
||
Price history
+363.3% since first listed11 events — show timeline
- 2025-12-19 Relisted — Stellar MLS as Distributed by MLS Grid
- 2025-10-13 Pending — Stellar MLS as Distributed by MLS Grid
- 2025-10-06 Listed $139,000 Stellar MLS as Distributed by MLS Grid
- 2010-12-09 Sold (Public Records) $60,000 Public Records
- 2005-06-10 Sold (Public Records) $70,000 Public Records
- 2005-06-07 Sold (MLS) $70,000 Stellar MLS as Distributed by MLS Grid
- 2005-04-22 Listed $75,000 Stellar MLS as Distributed by MLS Grid
- 1997-03-06 Sold (Public Records) $48,900 Public Records
- 1991-02-01 Sold (Public Records) $38,500 Public Records
- 1989-07-01 Sold (Public Records) $31,000 Public Records
- 1981-06-01 Sold (Public Records) $30,000 Public Records
Property tax history
+7.4%/yrLatest (2025): $1,766 · -3.2% YoY. Source: county tax records.
Cash-flow waterfall
monthlySold comps — $/sqft
last 12 mo · ≤1 miLoading sold comps…