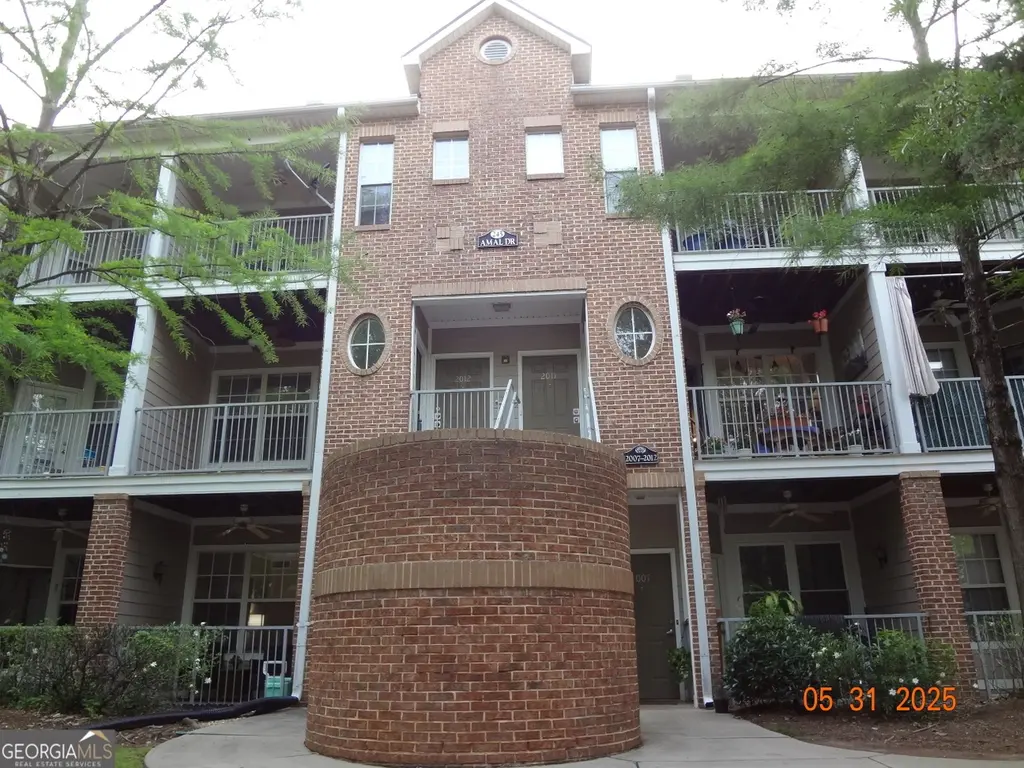
245 Amal Dr SW Apt 2010 · Atlanta, GA
Flood risk No data
- FEMA flood zone
- —
- Chance of flooding over 30 yrs
- —
- Est. flood insurance / yr
- —
Fire risk No data
- Est. fire insurance / yr
- —
Heat risk No data
- Hot days now (above threshold)
- —
- Hot days in 30 yrs
- —
Wind risk No data
- Chance of severe wind over 30 yrs
- —
Air-quality risk No data
- Unhealthy air days now
- —
- Unhealthy air days in 30 yrs
- —
Risk factors via First Street. Map © Google.
Why this score? — see what drove the D grade
The composite is a weighted blend of 9 inputs, each scored 0–100. Each bar is that input's sub-score; the figure is the points it added to the 100-point composite (weight × sub-score).
- Cash flow +12.8/30.0
- ARV discount +8.8/15.0
- Livability +4.2/5.0
- 1% rule +4.0/10.0
- DSCR +3.8/10.0
- Rent growth +3.3/5.0
- Schools +2.7/10.0
- Condition / age +2.5/5.0
- Appreciation +0.0/10.0
$149,000
🖨 Deal sheet (PDF) 📄 Offer letter ✓ Due diligence
Listing remarks MLS
You can own for less than you pay in rent. Why not become the homeowner of this completely redone and move-in ready urban townhome in a very desirable neighborhood. Relax at the neighborhood pool, socialize in downtown Atlanta, or just breathe and reset on your private porch overlooking the quiet street. A true gem that won't last long. Make it yours today. Call for special lender concessions to qualified buyers.
Key facts
- Quiet street
- Private porch
- Neighborhood pool
Tags
Neighborhood map
What this means for you Summary
Snapshot
- This is a 1-bed/1.0-bath condo listed at $149k.
Deal economics
- At list price, monthly cash flow is $-13 ($-159/yr) — negative.
- To cash-flow at today's rent, offer at most $147k (1.6% below list).
- To meet the 1% rule (rent ≥ 1% of price), the offer needs to be $133k (10.4% below list).
- Recommended offer: $131k (12.0% below list) — sets the bar for market timing.
- Cap rate 6.2% vs local median 3.1% in Atlanta — top-decile yield for the area; either an underpriced asset or a hidden risk that comps aren't pricing in. Stress-test before assuming the spread holds.
Location & tenants
- Location reads 83/100 on livability (#6 in GA, #919 nationally) — a professional / high-income tenant draw. Strengths: amenities A+, commute A+, housing A+; Watch: cost of living C-.
- Atlanta Public Schools (urban): math 28% / reading 35% proficiency, ranked #80 of 174 in GA (top 46%) — families likely to look elsewhere, expect single-tenant / working-renter base with shorter leases; 71% free/reduced lunch — lower-income household profile, screen leases tightly.
- Zoned schools: Thomas Heathe Slater Elementary School (math 2% / reading 8%, grade F, #1,160 of 1,228 statewide, top 98%, 569 students, 100% FRL); Judson Price Middle School (math 2% / reading 8%, grade F, #462 of 470 statewide, top 99%, 283 students, 100% FRL); Carver High School Early College (math 10% / reading 24%, grade F, #269 of 424 statewide, top 65%, 575 students, 100% FRL) — zoned schools average 100% FRL vs 71% district-wide (29 pts higher); higher-poverty schools than district average — tighter screening recommended.
- Zoned-school proficiency averages 9% at this address vs 32% district-wide (-22 pts) — the specific schools serving this property underperform the Atlanta Public Schools average; the district grade overstates school quality for this exact location.
- Market conditions: Rents rising (+3.2%/yr); 388 active listings in the ZIP; 28 comparable units currently listed for rent nearby; rentals at typical pace (median 27d on market — plan ~3-4 weeks tenant-placement turnaround); 11,565 units permitted in Fulton County in 2024 (8,159 in 5+ unit buildings).
- This rent runs 32% of the median local income ($51k/yr) — at the standard rent-burdened threshold; future hikes will face affordability resistance.
Forward outlook
- Local home prices are declining (-3.0%/yr); year-one equity from $1k of loan paydown is wiped out by about $4k of value loss. Plan a longer hold.
- Fulton County population projected at +38% by 2050 — long-run rental-demand tailwind backs the buy-and-hold thesis.
Negotiation context
- It's been on market 192 days — a 12% lower offer ($131k) is reasonable based on typical stale-listing flexibility.
- 7 sale attempts since 2y ago with the ask held roughly flat each time — persistent listings suggest the price (not the market) is what's stuck; bring a comps-based counter.
Questions for the listing agent
- What do current leases actually rent for vs. the listed asking? Can we see a recent rent roll and the last 12 months of T-12 income?
- It's been on market 192 days. Have you received any prior offers? Is the seller open to a 12% concession, seller financing, or rate buy-down credit?
- What does the HOA fee cover, when was the last increase, and are there any pending special assessments or reserve-fund shortfalls?
- Any open or pending special assessments — roof, HVAC, plumbing, elevator, façade? What's the per-unit balance and payoff schedule, and is the seller paying it off at close or rolling it to the buyer?
- Why hasn't it sold? Are there any deal-killer items the seller is aware of (foundation, flood, title, zoning, code violations)?
- Is there a deadline driving the sale (1031 exchange, divorce, estate, relocation)? That informs how much negotiation room exists.
- The area grade is low — what's the realistic commute time and amenity access for the typical tenant pool here? Any planned neighborhood developments (good or bad) we should know about?
- What's the average days-on-market for RENTAL listings here right now (not sales)? A rising rental-DOM trend means longer vacancies and softer asking-rent achievability than the comps imply.
- What's the recent tenant-quality profile in this submarket — average credit score on applications, eviction rate, late-payment / NSF rate, and stable-employment percentage? A property-management company in the area should have these aggregated.
- How much new apartment / multifamily construction is in the pipeline within 1–3 miles? Heavy new supply (>2% of stock underway) typically softens rents 12–24 months out; light construction supports rent growth.
Investment metrics
- 1% rule
- 0.90% ✗
- Cap rate
- 6.19%
- Cash-on-cash
- -0.38%
- DSCR
- 0.98
- GRM
- 9.3
CMA / ARV
- ARV (median comp)
- $153,548
- List price
- $149,000
- Delta
- -2.96%
- Verdict
- FAIR
- Comps
- 13 within 1.0 mi
Projected returns pro-forma
-3.0% appreciation · 3.23% rent growth · sell at horizon
- IRR
- -16.6%
- Equity multiple
- 0.41×
- Total profit
- $-24,636
- Equity at exit
- $22,216
- IRR
- -7.9%
- Equity multiple
- 0.49×
- Total profit
- $-21,088
- Equity at exit
- $12,883
Cash invested: $41,720 (down + closing). Projections, not guarantees.
Landlord ↔ Tenant lean methodology
- Overall (STATE)
- 90 Strongly Landlord-Friendly
- State Georgia
- 90 Strongly Landlord-Friendly · R+3
- County
- — inherits STATE
- City
- — inherits STATE
ZIP-level market 30315
- Rents YoY
- 3.2%
- Active inventory
- 388
- Price-to-rent
- 9.3×
Monthly cashflow live
- Estimated rent
- $1,335 high interval (Pro) →
- Mortgage (P&I)
- −$781
- Tax from tax record
- −$46 /mo · $555/yr
- Insurance
- −$62
- HOA
- −$178
- Lot rent
- −$0
- Vacancy / Maint / Mgmt
- −$280
- Net cashflow
- $-13
Break-even live
Sensitivity live
| Price | -10% $71 | -5% $29 | +0% $-13 | +5% $-55 | +10% $-98 |
|---|---|---|---|---|---|
| Rent | -10% $-119 | -5% $-66 | +0% $-13 | +5% $39 | +10% $92 |
| Rate | -1.0pp $62 | -0.5pp $25 | base $-13 | +0.5pp $-52 | +1.0pp $-91 |
UW: 25.0% down · 7.5% · 30yr · 1.5% tax · 5.0% vac · 8.0% maint · 8.0% mgmt
Financing live
Cash to close
- Down payment
- $37,250
- Closing costs
- $4,470
- Reserves months
- —
- Total cash needed
- —
Loan-product check · same deal, 3 products live
Conventional
25% down · 7.5% · 30yr
- Down + closing
- —
- Monthly P&I
- —
- Monthly cashflow
- —
- DSCR
- —
- Eligible?
- —
Personal DTI + credit; lowest rate.
DSCR
20% down · 8.5% · 30yr
- Down + closing
- —
- Monthly P&I
- —
- Monthly cashflow
- —
- DSCR
- —
- Eligible?
- —
No personal income docs; deal must DSCR.
Hard money
10% down · 12.0% · 12mo
- Down + closing
- —
- Monthly P&I
- —
- Monthly cashflow
- —
- DSCR
- —
- Eligible?
- —
Short-term bridge; refi at stabilization.
Rent comps 28 comps
| Address | Beds | Baths | Sqft | Rent | $/sqft | DOM | Units | Dist |
|---|---|---|---|---|---|---|---|---|
| 200 Guerin Rd Holly Springs, NC | 2.0–3.0 | 1.0–1.5 | 947 | $1,249 | $1.32 | 24d | 1 | 0.07mi |
| 375 Lincoln St SW Atlanta, GA | 1.0 | 1.0 | 1020 | $750 | $0.74 | 27d | 1 | 0.48mi |
| 52 Claire Dr SE Atlanta, GA | 2.0 | 2.0 | 800 | $1,750 | $2.19 | 21d | 1 | 0.55mi |
| 1483 Arthur Langford Jr Pl SW Atlanta, GA | 1.0–2.0 | 1.0 | 825 | $900 | $1.09 | 27d | 7 | 0.56mi |
| 2308 Lakewood Ave SW Unit A Atlanta, GA | 1.0 | 1.0 | 1112 | $895 | $0.80 | 27d | 1 | 0.62mi |
| 51 Bowen Ave SE Atlanta, GA | 1.0 | 1.0 | 800 | $1,025 | $1.28 | 4d | 1 | 0.74mi |
| 174 Moury Ave SW Atlanta, GA | 1.0–3.0 | 1.0–2.0 | 926 | $1,480 | $1.60 | 5d | 6 | 0.75mi |
| 2000 Rambling Ln Atlanta, GA | 1.0–3.0 | 1.0–2.0 | 1082 | $1,275 | $1.18 | 0d | 9 | 0.76mi |
| 91 Thirkield Ave SE Atlanta, GA | 2.0 | 1.0 | 1092 | $1,995 | $1.83 | 27d | 1 | 0.85mi |
| 1782 Cahoon St SW Atlanta, GA | 2.0 | 1.0 | 700 | $1,100 | $1.57 | 27d | 1 | 0.85mi |
| 1780 Cahoon St SW Atlanta, GA | 2.0 | 1.0 | 700 | $1,100 | $1.57 | 27d | 1 | 0.86mi |
| 1455 Jonesboro Rd SE Atlanta, GA | 2.0 | 1.0 | 700 | $2,000 | $2.86 | 27d | 1 | 0.94mi |
| 1293-1295 Marcy St SE Unit 7 Atlanta, GA | 1.0 | 1.0 | 650 | $950 | $1.46 | 27d | 1 | 1.04mi |
| 1295 Marcy St SE Atlanta, GA | 1.0 | 1.0 | 650 | $950 | $1.46 | 27d | 1 | 1.04mi |
| 1788 Broadwell St SW Atlanta, GA | 2.0 | 2.0 | 1017 | $1,850 | $1.82 | 27d | 1 | 1.05mi |
| 518 Erin Ave SW Atlanta, GA | 2.0 | 1.0 | 1075 | $2,500 | $2.33 | 20d | 1 | 1.05mi |
| 825 Hank Aaron Dr SW Atlanta, GA | 2.0 | 2.0 | 861 | $1,470 | $1.71 | 27d | 1 | 1.06mi |
| 1293 Marcy St SE Unit 8 Atlanta, GA | 1.0 | 1.0 | 600 | $950 | $1.58 | 27d | 1 | 1.07mi |
| 1178 Garibaldi St SW Atlanta, GA | 1.0 | 1.0 | 650 | $950 | $1.46 | 27d | 1 | 1.17mi |
| 1187 McDaniel St SW Unit B Atlanta, GA | 2.0 | 1.0 | 1038 | $1,025 | $0.99 | 14d | 1 | 1.18mi |
| 1148 Booker Ave SW Atlanta, GA | 1.0 | 1.0 | 1012 | $900 | $0.89 | 19d | 1 | 1.21mi |
| 1180 Sims St SW Atlanta, GA | 2.0 | 1.0 | 772 | $1,100 | $1.42 | 27d | 1 | 1.22mi |
| 125 Milton Ave SE Atlanta, GA | 2.0 | 1.0–2.0 | 965 | $1,894 | $1.96 | 1d | 30 | 1.24mi |
| 1093 West Ave SW Atlanta, GA | 2.0 | 1.0–2.0 | 770 | $1,319 | $1.71 | 1d | 6 | 1.28mi |
| 1246 Allene Ave SW Atlanta, GA | 2.0 | 1.0–2.0 | 896 | $1,798 | $2.01 | 1d | 21 | 1.34mi |
| 72 Milton Ave SE Atlanta, GA | 2.0 | 1.0–2.0 | 818 | $1,636 | $2.00 | 0d | 19 | 1.40mi |
| 825 Erin Ave SW Atlanta, GA | 2.0 | 1.0 | 776 | $3,000 | $3.87 | 27d | 1 | 1.44mi |
| 1056 Hank Aaron Dr SW Atlanta, GA | 1.0–2.0 | 1.0 | 753 | $915 | $1.22 | 10d | 6 | 1.45mi |
HOA detail condo
- Monthly dues
- $178 · $2,136/yr
- Likely covers
- pool
- Assessments
- None detected in remarks — confirm with the listing agent.
Listing history 32 events
-
2026-06-22days on market $149,000 Active 192 DOM
-
2026-06-21days on market $149,000 Active 191 DOM
-
2026-06-18days on market $149,000 Active 188 DOM
-
2026-06-17days on market $149,000 Active 187 DOM
-
2026-06-16days on market $149,000 Active 186 DOM
-
2026-06-15days on market $149,000 Active 185 DOM
-
2026-06-13days on market $149,000 Active 183 DOM
-
2026-06-13days on market $149,000 Active 182 DOM
-
2026-06-09days on market $149,000 Active 179 DOM
-
2026-06-08days on market $149,000 Active 178 DOM
-
2026-06-07days on market $149,000 Active 177 DOM
-
2026-06-04days on market $149,000 Active 174 DOM
-
2026-06-03days on market $149,000 Active 173 DOM
-
2026-06-02days on market $149,000 Active 172 DOM
-
2026-06-01days on market $149,000 Active 171 DOM
-
2026-05-31days on market $149,000 Active 170 DOM
-
2025-12-12$149,000 New 420-char remark
Show marketing remark (420 chars)
You can own for less than you pay in rent. Why not become the homeowner of this completely redone and move-in ready urban townhome in a very desirable neighborhood. Relax at the neighborhood pool, socialize in downtown Atlanta, or just breathe and reset on your private porch overlooking the quiet street. A true gem that won't last long. Make it yours today. Call for special lender concessions to qualified buyers.
-
2025-11-30historical
-
2025-06-03$158,900 New
-
2025-04-09historical
-
2025-04-09historical
-
2025-01-26$164,900 Active
-
2025-01-26$164,900 New
-
2024-11-30historical
-
2024-11-30historical
-
2024-09-18price $169,900
-
2024-09-18price $169,900
-
2024-07-17$179,000 Active
-
2024-06-09$179,000 New
-
2024-05-25historical
-
2024-05-02price $195,000
-
2024-03-21$200,000 New
ⓘ Source: listings_history table (triggers on properties + properties_extension) + one-shot
backfill from property_details.listing_events for pre-trigger history.
Tax reassessment forecast GA · Resets to sale price
- Current annual tax
- $555 · $46/mo
- Projected year-2 tax
- $1,371 · $114/mo
- Expected delta
- +$816/yr (+$68/mo · 147.1%)
ⓘ Screening estimate from a state-policy table — verify with the county assessor before closing.
Nearby sold comps map
Loading sold comps map…
Walkable amenities ~0.75 mi
Loading nearby amenities…
Taxation est. · year 1
- Rental income
- $16,017
- − Mortgage interest
- −$8,346
- − Property taxes
- −$555
- − Insurance
- −$745
- − Repairs & maintenance
- −$1,281
- − Management
- −$1,281
- − HOA
- −$2,136
- − Depreciation
- −$4,335
- Taxable loss
- −$2,663
- Est. tax savings @ 24.0%
- +$639
- After-tax cash flow
- $480/yr
For passive investors: Depreciation is non-cash, so a rental often shows a tax loss while cash-flowing — sheltering income. Rental losses are passive: they offset passive income freely, and up to $25,000/yr can offset ordinary (W-2) income if you actively participate and your MAGI is under $100k (phasing out to $0 by $150k); unused losses carry forward. On sale, claimed depreciation is recaptured at up to 25%, and gains may owe capital-gains tax (a 1031 exchange can defer both). Figures are a year-1 estimate at your 24.0% rate — not tax advice; consult a CPA.
Schools (NCES district)
- District
- Atlanta Public Schools
- NCES district ID
- 1300120
- Math proficiency
- 28% ▼ -6.00%
- Reading proficiency
- 35% ▼ -2.00%
- Median HH income
- $48,306
- Composite
- 27.27/100
- National rank
- #7006
- State rank
- #80 of 174 in GA
Livability — Atlanta
- Score
- 83/100
- State rank
- #6
- US rank
- #919
Category grades
Schools grade is shown separately in the Schools card above.
Census & demographics
- Census place
- Atlanta, GA
- County
- Fulton County · 1,094,430 people
- City population
- 629,525
- Metro
- Atlanta-Sandy Springs-Alpharetta, GA
- Population (ZIP)
- 34,264
- Household income
- $50,822
- Rent vs Own
- Severe rent burden
- 2962.0
Population outlook (Fulton County) Hauer SSP2
- Today (2025)
- 1,203,707 people
- By 2030
- 1,299,706 · +8.0%
- By 2040
- 1,488,256 · +23.6%
- By 2050
- 1,664,580 · +38.3%
- By 2075
- 2,036,072 · +69.2%
- By 2100
- 2,222,402 · +84.6%
Race, ethnicity, and origin ACS 2023
- Neighborhood character
- Predominantly Black (72%)
- Race & ethnicity
- Black 72% White 14% Hispanic / Latino 10% Two or more races 4%
- Hispanic origin (detail)
- Mexican 4%
- Common ancestry
- Romanian 1% Italian 1% Lithuanian 1%
- Foreign-born
- 5% · Canada
- Languages at home
- 90% English-only · Spanish 9% French/Haitian/Cajun 1%
Political lean MEDSL · Fulton
- 2024 margin
- Solid D (+44.9) · D 71.9% · R 27.0% · Other 1.1%
- 2008→2024 swing
- +9.8pp toward D · 2008: 35.0pp · 2024: 44.9pp
- All cycles
- 2024: D+44.9 2020: D+46.4 2016: D+42.1 2012: D+29.6 2008: D+35.0
Not yet ingested
- Civics
- —
Market trends
- HPI YoY
- ▼ -281.87%
- Current HPI
- 176.673
- Rent YoY
- ▲ 3.23%
- Metro
- Atlanta-Sandy Springs-Alpharetta, GA
- State GDP YoY
- ▲ 2.66%
- F500 in state
- 28
Industry mix (Fortune 500 HQ in GA)
| Industry | F500 HQs | Revenue |
|---|---|---|
| Paper / Packaging | 2 | $29B |
|
||
| Retail | 1 | $160B |
|
||
| Transportation / Logistics | 1 | $91B |
|
||
| Airlines | 1 | $62B |
|
||
| Consumer Goods | 1 | $47B |
|
||
| Utilities | 1 | $25B |
|
||
Price history
-25.5% since first listed16 events — show timeline
- 2025-12-12 Listed $149,000 GAMLS
- 2025-11-30 Listing Removed — GAMLS
- 2025-06-03 Listed $158,900 GAMLS
- 2025-04-09 Listing Removed — GAMLS
- 2025-04-09 Listing Removed — FMLS
- 2025-01-26 Listed $164,900 GAMLS
- 2025-01-26 Listed $164,900 FMLS
- 2024-11-30 Listing Removed — FMLS
- 2024-11-30 Listing Removed — GAMLS
- 2024-09-18 Price Changed $169,900 FMLS
- 2024-09-18 Price Changed $169,900 GAMLS
- 2024-07-17 Listed $179,000 FMLS
- 2024-06-09 Listed $179,000 GAMLS
- 2024-05-25 Listing Removed — GAMLS
- 2024-05-02 Price Changed $195,000 GAMLS
- 2024-03-21 Listed $200,000 GAMLS
Property tax history
+6.4%/yrLatest (2025): $555 · -6.0% YoY. Source: county tax records.
Cash-flow waterfall
monthlySold comps — $/sqft
last 12 mo · ≤1 miLoading sold comps…