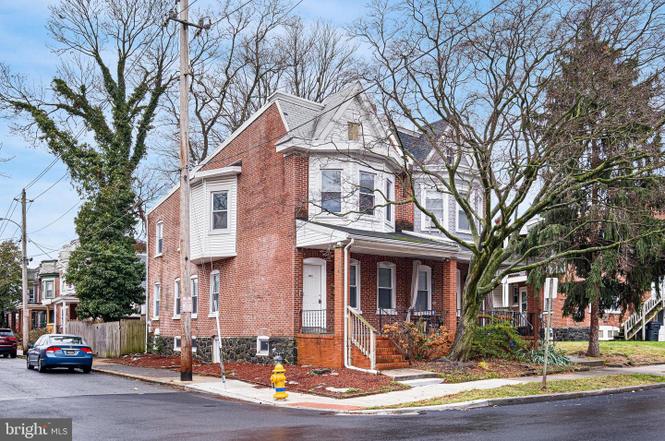
2402 N Van Buren St · Wilmington, DE
Flood risk 1/10 · Minimal
- FEMA flood zone
- X (unshaded)
- Chance of flooding over 30 yrs
- 0.0%
- Est. flood insurance / yr
- $473 – $860
Fire risk 1/10 · Minimal
- Est. fire insurance / yr
- $476 – $884
Heat risk 7/10 · Major
- Hot days now (above 103°F)
- 7 days/yr
- Hot days in 30 yrs
- 16 days/yr
Wind risk 6/10 · Moderate
- Chance of severe wind over 30 yrs
- 27.0%
Air-quality risk 3/10 · Minor
- Unhealthy air days now
- 2 days/yr
- Unhealthy air days in 30 yrs
- 3 days/yr
Risk factors via First Street. Map © Google.
Why this score? — see what drove the D grade
The composite is a weighted blend of 9 inputs, each scored 0–100. Each bar is that input's sub-score; the figure is the points it added to the 100-point composite (weight × sub-score).
- Cash flow +13.6/30.0
- ARV discount +10.4/15.0
- DSCR +4.1/10.0
- Rent growth +3.9/5.0
- Livability +3.2/5.0
- Schools +3.1/10.0
- 1% rule +2.7/10.0
- Condition / age +2.5/5.0
- Appreciation +0.0/10.0
$229,900
🖨 Deal sheet (PDF) 📄 Offer letter ✓ Due diligence
Listing remarks
Offering Seller Assistance! Come claim your home at 2402 N van Buren St, Wilmington, DE 19802! This stunning, refinished semi detached home was made for someone who’s ready to stop renting and start building generational wealth. Walk in and feel the glow: ✨ Sizeable kitchen with beautiful counters, appliances, and natural light perfect for brunch or late-night wine & vision board sessions ✨ Gorgeous luxury vinyl floors and sparkling refinished hardwoods that look expensive but can handle kids, heels, and everything in between ✨ Spacious bedrooms – one for you, one for the kids, one for that home office or glam room you deserve ✨ Bright, open layout with great lighting Fi
Key facts
- Built 1930
- Listed 146 days
Neighborhood map
What this means for you Summary
Snapshot
- This is a 3-bed/1.0-bath townhouse listed at $230k.
Deal economics
- At list price, monthly cash flow is $12 ($144/yr) — positive.
- The deal already cash-flows at list — no discount required.
- To meet the 1% rule (rent ≥ 1% of price), the offer needs to be $178k (22.6% below list).
- Recommended offer: $178k (22.6% below list) — sets the bar for 1% rule.
Location & tenants
- Location reads 64/100 on livability (#52 in DE) — a middle-class / working-renter tenant base. Strengths: cost of living A+, housing A; Watch: employment D+, commute D, crime F.
- Red Clay Consolidated School District (suburban): math 27% / reading 42% proficiency, ranked #12 of 26 in DE (top 46%) — families likely to look elsewhere, expect single-tenant / working-renter base with shorter leases.
- Zoned schools: Warner Elementary School (math 2% / reading 2%, grade F, #104 of 105 statewide, top 100%, 360 students, 0% FRL); Skyline Middle School (math 14% / reading 20%, grade F, #32 of 36 statewide, top 89%, 475 students, 0% FRL); Dickinson (John) School (math 24% / reading 47%, grade F, #17 of 40 statewide, top 41%, 1,058 students, 0% FRL) — zoned schools average 0% FRL vs 44% district-wide (44 pts lower); this property's tenant base skews higher-income than the district average.
- Zoned-school proficiency averages 18% at this address vs 34% district-wide (-16 pts) — the specific schools serving this property underperform the Red Clay Consolidated School District average; the district grade overstates school quality for this exact location.
- Market conditions: Rents rising fast (+5.7%/yr); 132 active listings in the ZIP; 40 comparable units currently listed for rent nearby; rentals at typical pace (median 26d on market — plan ~3-4 weeks tenant-placement turnaround); 1,367 units permitted in New Castle County in 2024 (201 in 5+ unit buildings).
- This rent runs 40% of the median local income ($54k/yr) — at the standard rent-burdened threshold; future hikes will face affordability resistance.
Forward outlook
- Local home prices are declining (-3.0%/yr); year-one equity from $2k of loan paydown is wiped out by about $7k of value loss. Plan a longer hold.
- New Castle County population projected at +9% by 2050 — modest demand growth; plan on rents tracking national, not racing it.
Negotiation context
- It's been on market 146 days — a 12% lower offer ($202k) is reasonable based on typical stale-listing flexibility.
- 2 sale attempts since 7y ago with the ask held roughly flat each time — persistent listings suggest the price (not the market) is what's stuck; bring a comps-based counter.
Risks & watch-outs
- Watch-outs: built in 1930 — expect roof / HVAC / electrical / plumbing capex.
- Climate carrying-cost: major wind risk, 27% chance of damaging wind over 30y; extreme-heat days projected 7→16/yr by 2055 (HVAC capex compounding) — expect insurance premiums to compound above CPI over the hold.
Questions for the listing agent
- It's been on market 146 days. Have you received any prior offers? Is the seller open to a 23% concession, seller financing, or rate buy-down credit?
- Built in 1930 — when were the roof, HVAC, electrical panel, plumbing, and water heater last replaced?
- Why hasn't it sold? Are there any deal-killer items the seller is aware of (foundation, flood, title, zoning, code violations)?
- Is there a deadline driving the sale (1031 exchange, divorce, estate, relocation)? That informs how much negotiation room exists.
- Schools are D-rated, which usually means shorter tenancies and higher turnover. Who's the typical renter profile here, and what's been the actual vacancy rate?
- Crime grade is F in this area — have there been break-ins, vandalism, or insurance claims at this property in the last 3 years? What carrier currently insures it and at what premium?
- The area grade is low — what's the realistic commute time and amenity access for the typical tenant pool here? Any planned neighborhood developments (good or bad) we should know about?
- What's the average days-on-market for RENTAL listings here right now (not sales)? A rising rental-DOM trend means longer vacancies and softer asking-rent achievability than the comps imply.
- What's the recent tenant-quality profile in this submarket — average credit score on applications, eviction rate, late-payment / NSF rate, and stable-employment percentage? A property-management company in the area should have these aggregated.
- How much new for-sale + rental construction is in the pipeline within 1–3 miles? Heavy new supply typically softens prices + rents 12–24 months out; constrained supply supports both.
Investment metrics
- 1% rule
- 0.77% ✗
- Cap rate
- 6.36%
- Cash-on-cash
- 0.22%
- DSCR
- 1.01
- GRM
- 10.8
CMA / ARV
- ARV (median comp)
- $245,617
- List price
- $229,900
- Delta
- -6.40%
- Verdict
- FAIR
- Comps
- 20 within 1.0 mi
Show comp detail 12 sales within ~0.75 mi
| Address | Dist | Beds/Ba | Sqft | Sold | Price | $/sf | Match |
|---|---|---|---|---|---|---|---|
| 2011 N West St | 0.43mi | 4/1.0 (+1) | 1,375 (0%) | 1mo | $135,000 | $98 | 74 |
| 623 W Twenty Eighth St | 0.19mi | 3/1.5 | 1,250 (-9%) | 1mo | $235,000 | $188 | 74 |
| 305 W 21st St | 0.33mi | 3/1.5 | 1,450 (+6%) | 1mo | $290,000 | $200 | 73 |
| 212 W 25th St | 0.33mi | 3/1.0 | 1,225 (-11%) | 1mo | $80,000 | $65 | 66 |
| 2009 N Tatnall St | 0.49mi | 3/1.0 | 1,475 (+7%) | 1mo | $170,000 | $115 | 64 |
| 125 W 20th St | 0.47mi | 3/1.0 | 1,500 (+9%) | 1mo | $235,000 | $157 | 62 |
| 2708 Thompson Pl | 0.28mi | 3/1.0 | 1,175 (-14%) | 1mo | $215,000 | $183 | 62 |
| 2412 Lamotte St | 0.57mi | 3/1.0 | 1,275 (-7%) | 0mo | $125,000 | $98 | 61 |
| 2321 N Tatnall St | 0.42mi | 3/1.5 | 1,525 (+11%) | 1mo | $216,000 | $142 | 60 |
| 24 W 30th St | 0.53mi | 3/2.0 | 1,478 (+8%) | 0mo | $280,000 | $189 | 59 |
| 222 E 30th St | 0.72mi | 3/2.0 | 1,400 (+2%) | 1mo | $280,000 | $200 | 58 |
| 222 W 22nd St | 0.37mi | 3/2.5 | 1,525 (+11%) | 1mo | $265,000 | $174 | 58 |
Match score weights: distance 35% · size 25% · config 20% · recency 20%. Top-matched comps best support the ARV.
Projected returns pro-forma
-3.0% appreciation · 5.72% rent growth · sell at horizon
- IRR
- -13.3%
- Equity multiple
- 0.51×
- Total profit
- $-31,586
- Equity at exit
- $34,279
- IRR
- -1.1%
- Equity multiple
- 0.92×
- Total profit
- $-5,212
- Equity at exit
- $19,878
Cash invested: $64,372 (down + closing). Projections, not guarantees.
Landlord ↔ Tenant lean methodology
- Overall (STATE)
- 70 Landlord-Friendly
- State Delaware
- 70 Landlord-Friendly · D+7
- County
- — inherits STATE
- City
- — inherits STATE
ZIP-level market 19802
- Rents YoY
- 5.7%
- Active inventory
- 132
- Price-to-rent
- 10.8×
Monthly cashflow live
- Estimated rent
- $1,778 high interval (Pro) →
- Mortgage (P&I)
- −$1,206
- Tax from tax record
- −$92 /mo · $1,098/yr
- Insurance
- −$96
- HOA
- −$0
- Vacancy / Maint / Mgmt
- −$373
- Net cashflow
- $12
Break-even live
Sensitivity live
| Price | -10% $142 | -5% $77 | +0% $12 | +5% $-53 | +10% $-118 |
|---|---|---|---|---|---|
| Rent | -10% $-129 | -5% $-58 | +0% $12 | +5% $82 | +10% $152 |
| Rate | -1.0pp $128 | -0.5pp $70 | base $12 | +0.5pp $-48 | +1.0pp $-108 |
UW: 25.0% down · 7.5% · 30yr · 1.5% tax · 5.0% vac · 8.0% maint · 8.0% mgmt
Financing live
Cash to close
- Down payment
- $57,475
- Closing costs
- $6,897
- Reserves months
- —
- Total cash needed
- —
Loan-product check · same deal, 3 products live
Conventional
25% down · 7.5% · 30yr
- Down + closing
- —
- Monthly P&I
- —
- Monthly cashflow
- —
- DSCR
- —
- Eligible?
- —
Personal DTI + credit; lowest rate.
DSCR
20% down · 8.5% · 30yr
- Down + closing
- —
- Monthly P&I
- —
- Monthly cashflow
- —
- DSCR
- —
- Eligible?
- —
No personal income docs; deal must DSCR.
Hard money
10% down · 12.0% · 12mo
- Down + closing
- —
- Monthly P&I
- —
- Monthly cashflow
- —
- DSCR
- —
- Eligible?
- —
Short-term bridge; refi at stabilization.
Rent comps 40 comps
| Address | Beds | Baths | Sqft | Rent | $/sqft | DOM | Units | Dist |
|---|---|---|---|---|---|---|---|---|
| 517 W 26th St Unit NA Wilmington, DE | 3.0 | 1.5 | 1344 | $1,900 | $1.41 | 26d | 1 | 0.13mi |
| 314 Concord Ave Unit 2 Wilmington, DE | 2.0 | 1.0 | 1300 | $1,295 | $1.00 | 26d | 1 | 0.24mi |
| 306 W 23rd St Unit 2 Wilmington, DE | 2.0 | 1.0 | 1475 | $1,295 | $0.88 | 45d | 1 | 0.25mi |
| 306 W 23rd St Unit 1 Wilmington, DE | 2.0 | 1.0 | 1475 | $1,295 | $0.88 | 26d | 1 | 0.25mi |
| 302 W 23rd St Unit 1 Wilmington, DE | 2.0 | 1.0 | 1450 | $1,295 | $0.89 | 26d | 1 | 0.26mi |
| 306 Concord Ave Unit 2 Wilmington, DE | 3.0 | 1.0 | 1100 | $1,350 | $1.23 | 45d | 1 | 0.26mi |
| 604 W 20th St Unit 2 Wilmington, DE | 2.0 | 1.0 | 900 | $1,195 | $1.33 | 26d | 1 | 0.29mi |
| 409 W 20th St Unit 2 Wilmington, DE | 2.0 | 1.0 | 1100 | $1,700 | $1.55 | 12d | 1 | 0.31mi |
| 409 W 20th St Unit 2 Wilmington, DE | 2.0 | 1.0 | 1100 | $1,500 | $1.36 | 14d | 1 | 0.31mi |
| 400 W 29th St Wilmington, DE | 3.0 | 1.5 | 1125 | $1,950 | $1.73 | 45d | 1 | 0.31mi |
| 2401 N West St Wilmington, DE | 4.0 | 1.0 | 1650 | $1,900 | $1.15 | 17d | 1 | 0.33mi |
| 125 W 23rd St Wilmington, DE | 4.0 | 2.0 | 1672 | $1,995 | $1.19 | 45d | 1 | 0.36mi |
| 2923 N Washington St Wilmington, DE | 3.0 | 1.0 | 1225 | $1,600 | $1.31 | 0d | 1 | 0.41mi |
| 3003 N Washington St Wilmington, DE | 3.0 | 1.0 | 1250 | $1,950 | $1.56 | 45d | 1 | 0.43mi |
| 2518 N Tatnall St Wilmington, DE | 4.0 | 1.5 | 1575 | $1,995 | $1.27 | 45d | 1 | 0.44mi |
| 3005 N West St Wilmington, DE | 3.0 | 1.0 | 1176 | $1,900 | $1.62 | 26d | 1 | 0.50mi |
| 5 E 24th St Unit 1 Wilmington, DE | 3.0 | 1.0 | 1150 | $1,795 | $1.56 | 45d | 1 | 0.52mi |
| 3408 Miller Rd Wilmington, DE | 1.0–2.0 | 1.0–2.0 | 889 | $1,775 | $2.00 | 0d | 8 | 0.57mi |
| 103 E 24th St Unit 1 Wilmington, DE | 3.0 | 1.0 | 1025 | $1,795 | $1.75 | 45d | 1 | 0.59mi |
| 507 Barrett St Wilmington, DE | 3.0 | 1.0 | 1275 | $1,700 | $1.33 | 45d | 1 | 0.69mi |
| 2705 Speakman Pl Wilmington, DE | 3.0 | 1.5 | 1100 | $1,975 | $1.80 | 14d | 1 | 0.71mi |
| 903 Shallcross Ave Wilmington, DE | 2.0 | 1.5 | 1575 | $2,195 | $1.39 | 26d | 1 | 0.77mi |
| 107 W 13th St Wilmington, DE | 3.0 | 1.5 | 1325 | $1,895 | $1.43 | 45d | 1 | 0.82mi |
| 1217 N King St Wilmington, DE | 3.0 | 1.5 | 1300 | $2,145 | $1.65 | 20d | 1 | 0.87mi |
| 1610 N Broom St Unit 2 Wilmington, DE | 2.0 | 1.0 | 1000 | $2,150 | $2.15 | 45d | 1 | 0.89mi |
| 1301 N Harrison St Wilmington, DE | 1.0–2.0 | 1.0 | 1050 | $1,850 | $1.76 | 7d | 1 | 0.90mi |
| 1207 Delaware Ave Wilmington, DE | 2.0 | 1.0 | 1200 | $1,700 | $1.42 | 13d | 1 | 0.92mi |
| 1501 N Broom St Unit 2/3 Wilmington, DE | 2.0 | 2.5 | 1250 | $2,500 | $2.00 | 7d | 1 | 0.96mi |
| 1210 Delaware Ave Unit 3 Wilmington, DE | 2.0 | 1.0 | 1200 | $2,395 | $2.00 | 45d | 1 | 0.96mi |
| 1212 Delaware Ave Wilmington, DE | 2.0 | 1.0–2.0 | 925 | $2,695 | $2.91 | 14d | 4 | 0.97mi |
| 1212 Delaware Ave Wilmington, DE | 2.0 | 1.0–2.0 | 700 | $2,495 | $3.56 | 45d | 4 | 0.97mi |
| 2601 N Heald St Wilmington, DE | 3.0 | 1.0 | 1025 | $1,795 | $1.75 | 0d | 1 | 0.99mi |
| 1001 N Orange St Wilmington, DE | 1.0–2.0 | 1.0–2.0 | 833 | $2,135 | $2.56 | 0d | 61 | 1.00mi |
| 918 E 17th St Unit 1 Wilmington, DE | 3.0 | 1.0 | 1100 | $1,795 | $1.63 | 0d | 1 | 1.01mi |
| 1124 Clifford Brown Walk Wilmington, DE | 2.0 | 1.0 | 1240 | $1,625 | $1.31 | 45d | 1 | 1.02mi |
| 613 W 10th St Wilmington, DE | 2.0 | 1.0 | 1100 | $1,745 | $1.59 | 45d | 1 | 1.03mi |
| 1010 Trenton Pl Wilmington, DE | 3.0 | 1.5 | 1475 | $2,350 | $1.59 | 18d | 1 | 1.03mi |
| 518 E 12th St Wilmington, DE | 2.0 | 1.0 | 875 | $1,425 | $1.63 | 22d | 1 | 1.04mi |
| 1504 Delaware Ave Wilmington, DE | 2.0 | 1.0 | 1100 | $1,590 | $1.45 | 18d | 1 | 1.04mi |
| 1504 Delaware Ave Wilmington, DE | 2.0 | 1.0 | 1100 | $1,749 | $1.59 | 23d | 1 | 1.04mi |
Listing history 17 events
-
2026-06-21days on market $229,900 Active 146 DOM
-
2026-06-18days on market $229,900 Active 143 DOM
-
2026-06-17days on market $229,900 Active 142 DOM
-
2026-06-16days on market $229,900 Active 141 DOM
-
2026-06-15days on market $229,900 Active 140 DOM
-
2026-06-13days on market $229,900 Active 138 DOM
-
2026-06-13days on market $229,900 Active 137 DOM
-
2026-06-09days on market $229,900 Active 134 DOM
-
2026-06-08pricestatusdays on market $229,900 Active 133 DOM
-
2026-05-13historical
-
2026-04-27price $219,900
-
2026-03-19price $225,000
-
2026-02-05price $230,000
-
2025-12-31$235,000 Active
-
2019-06-19historical
-
2019-06-11price $62,500
-
2019-05-29$65,000 Active
ⓘ Source: listings_history table (triggers on properties + properties_extension) + one-shot
backfill from property_details.listing_events for pre-trigger history.
Tax reassessment forecast DE · Partial reset (capped growth)
- Current annual tax
- $1,098 · $92/mo
- Projected year-2 tax
- $1,216 · $101/mo
- Expected delta
- +$118/yr (+$10/mo · 10.7%)
ⓘ Screening estimate from a state-policy table — verify with the county assessor before closing.
Climate risk First Street
- Flood 1/10 Low FEMA zone X (unshaded) · 0% chance over 30 yrs
- Wildfire 1/10 Low
- Heat 7/10 Severe 7 d/yr ≥103°F today · 16 d/yr by 30 yrs out
- Wind 6/10 Major 27% chance of damaging wind over 30 yrs
- Air quality 3/10 Moderate 2 unhealthy d/yr today · 3 by 30 yrs out
Nearby sold comps map
Loading sold comps map…
Walkable amenities ~0.75 mi
Loading nearby amenities…
Taxation est. · year 1
- Rental income
- $21,340
- − Mortgage interest
- −$12,878
- − Property taxes
- −$1,098
- − Insurance
- −$1,150
- − Repairs & maintenance
- −$1,707
- − Management
- −$1,707
- − Depreciation
- −$6,688
- Taxable loss
- −$3,888
- Est. tax savings @ 24.0%
- +$933
- After-tax cash flow
- $1,077/yr
For passive investors: Depreciation is non-cash, so a rental often shows a tax loss while cash-flowing — sheltering income. Rental losses are passive: they offset passive income freely, and up to $25,000/yr can offset ordinary (W-2) income if you actively participate and your MAGI is under $100k (phasing out to $0 by $150k); unused losses carry forward. On sale, claimed depreciation is recaptured at up to 25%, and gains may owe capital-gains tax (a 1031 exchange can defer both). Figures are a year-1 estimate at your 24.0% rate — not tax advice; consult a CPA.
Schools (NCES district)
- District
- Red Clay Consolidated School District
- NCES district ID
- 1001300
- Math proficiency
- 27% ▼ -11.00%
- Reading proficiency
- 42% ▼ -7.00%
- Median HH income
- $64,298
- Composite
- 31.25/100
- National rank
- #6027
- State rank
- #12 of 26 in DE
Livability — Wilmington
- Score
- 64/100
- State rank
- #52
- US rank
- #14251
Category grades
Schools grade is shown separately in the Schools card above.
Census & demographics
- Census place
- Wilmington, DE
- County
- New Castle County · 483,412 people
- City population
- 173,480
- Metro
- Philadelphia-Camden-Wilmington, PA-NJ-DE-MD
- Population (ZIP)
- 26,051
- Household income
- $53,812
- Rent vs Own
- Severe rent burden
- 1816.0
Population outlook (New Castle County) Hauer SSP2
- Today (2025)
- 594,686 people
- By 2030
- 609,164 · +2.4%
- By 2040
- 632,154 · +6.3%
- By 2050
- 649,068 · +9.1%
- By 2075
- 687,771 · +15.7%
- By 2100
- 694,961 · +16.9%
Race, ethnicity, and origin ACS 2023
- Neighborhood character
- Predominantly Black (68%)
- Race & ethnicity
- Black 68% White 20% Hispanic / Latino 7% Two or more races 5%
- Hispanic origin (detail)
- Puerto Rican 4%
- Common ancestry
- Slovak 1% Romanian 1% Italian 1%
- Foreign-born
- 11% · Canada, Jamaica, China
- Languages at home
- 92% English-only · Spanish 4% Arabic 0%
Political lean MEDSL · New Castle
- 2024 margin
- Solid D (+32.6) · D 65.5% · R 32.9% · Other 1.6%
- 2008→2024 swing
- -8.1pp toward R · 2008: 40.6pp · 2024: 32.6pp
- All cycles
- 2024: D+32.6 2020: D+37.1 2016: D+29.6 2012: D+34.1 2008: D+40.6
Not yet ingested
- Civics
- —
Market trends
- HPI YoY
- ▼ -296.47%
- Current HPI
- 225.6613
- Rent YoY
- ▲ 5.72%
- Metro
- Philadelphia-Camden-Wilmington, PA-NJ-DE-MD
- State GDP YoY
- —
- F500 in state
- 0
Price history
+238.3% since first listed8 events — show timeline
- 2026-05-13 Listing Removed — BRIGHT MLS
- 2026-04-27 Price Changed $219,900 BRIGHT MLS
- 2026-03-19 Price Changed $225,000 BRIGHT MLS
- 2026-02-05 Price Changed $230,000 BRIGHT MLS
- 2025-12-31 Listed $235,000 BRIGHT MLS
- 2019-06-19 Listing Removed — BRIGHT MLS
- 2019-06-11 Price Changed $62,500 BRIGHT MLS
- 2019-05-29 Listed $65,000 BRIGHT MLS
Property tax history
+34.7%/yrLatest (2024): $1,098 · +15.1% YoY. Source: county tax records.
Cash-flow waterfall
monthlySold comps — $/sqft
last 12 mo · ≤1 miLoading sold comps…