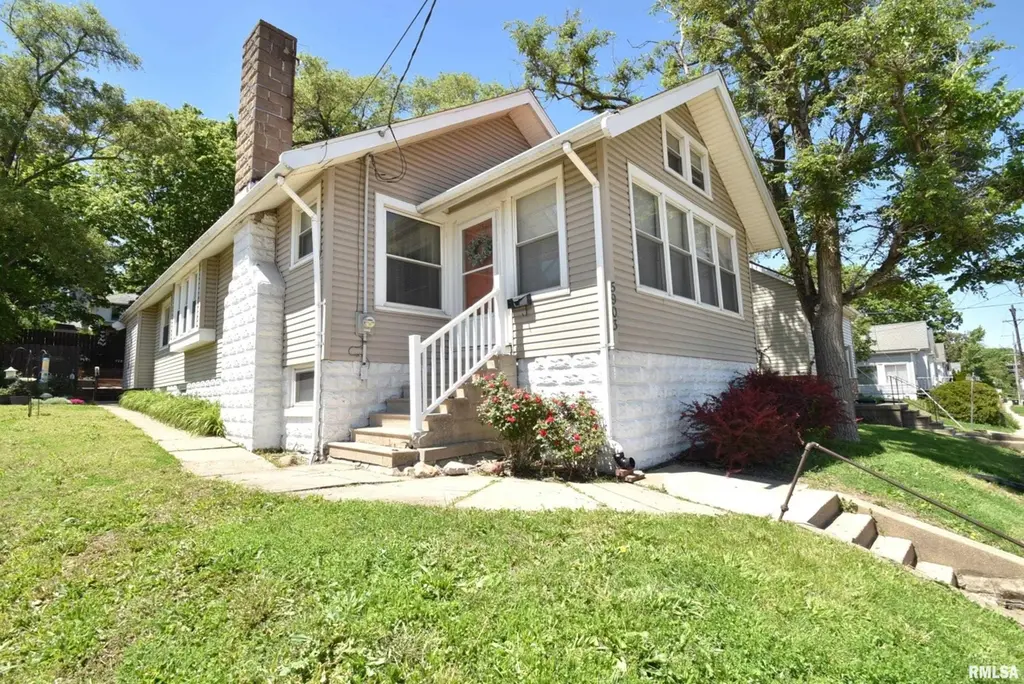
5903 S Adams St · Bartonville, IL
Flood risk 1/10 · Minimal
- FEMA flood zone
- X
- Chance of flooding over 30 yrs
- 0.0%
- Est. flood insurance / yr
- $473 – $860
Fire risk 1/10 · Minimal
- Est. fire insurance / yr
- $804 – $1,492
Heat risk 3/10 · Minor
- Hot days now (above 105°F)
- 7 days/yr
- Hot days in 30 yrs
- 18 days/yr
Wind risk 2/10 · Minimal
- Chance of severe wind over 30 yrs
- 1.0%
Air-quality risk 3/10 · Minor
- Unhealthy air days now
- 1 days/yr
- Unhealthy air days in 30 yrs
- 3 days/yr
Risk factors via First Street. Map © Google.
Why this score? — see what drove the C+ grade
The composite is a weighted blend of 9 inputs, each scored 0–100. Each bar is that input's sub-score; the figure is the points it added to the 100-point composite (weight × sub-score).
- Cash flow +25.1/30.0
- ARV discount +15.0/15.0
- DSCR +8.2/10.0
- 1% rule +5.3/10.0
- Livability +3.1/5.0
- Schools +2.9/10.0
- Rent growth +2.5/5.0
- Condition / age +2.5/5.0
- Appreciation +0.0/10.0
$94,900
🖨 Deal sheet 📄 Offer letter ✓ Due diligence
Listing remarks MLS
Attention Investors! Great income potential with this 3BR/1BA home in Bartonville! Newer windows and siding. Water Heater, AC unit and Furnace also in good shape. Parking allowed on street and in parking lot of shop next door. In need of some TLC. Great income property near restaurants, bars, shops and school! BRING AN OFFER!
Key facts
- Outdoor patio area
- 5,000 sq ft lot
- Built 1917
Tags
Property features AI
Exterior
- Parking: On-street parking (no garage)
- Utilities: Public water; Public sewer
- Home design: Single-family residence; Originally built in 1917
- Construction: Not new construction
- Exterior features: Shingle roof; Corner lot; Lot dimensions approximately 50 x 100
Interior
- Kitchen: Kitchen with laminate flooring; Includes dishwasher
- Bedrooms: 3 bedrooms (one on main level, others on upper, lower and additional levels as listed)
- Flooring: Hardwood flooring in living room and main bedrooms; Laminate flooring in kitchen and laundry
- Bathrooms: 1 full bathroom
- Heating & cooling: Central air
- Interior features: Dishwasher; Dryer; Washer; Gas-started fireplace in the living room; Full basement
- Laundry & utility: Main-level laundry area; Includes washer and dryer
Neighborhood map
What this means for you Summary
Snapshot
- This is a 3-bed/1.0-bath single-family listed at $95k.
Deal economics
- At list price, monthly cash flow is $209 ($3k/yr) — positive.
- The deal already cash-flows at list — no discount required.
- Meets the 1% rule at list price ($974 rent vs $95k).
- Cap rate 8.9% vs local median 3.6% in Bartonville — top-decile yield for the area; either an underpriced asset or a hidden risk that comps aren't pricing in. Stress-test before assuming the spread holds.
Location & tenants
- Location reads 62/100 on livability (#840 in IL) — a middle-class / working-renter tenant base. Strengths: cost of living A+, housing A+; Watch: crime D+, amenities F, commute F.
- Limestone Chsd 310 (rural): math 25% / reading 35% proficiency, ranked #486 of 919 in IL (top 53%) — families likely to look elsewhere, expect single-tenant / working-renter base with shorter leases.
- Zoned schools: Limestone Community High School (math 17% / reading 22%, grade F, #397 of 693 statewide, top 61%, 924 students, 0% FRL).
- Market conditions: 51 active listings in the ZIP; 3 comparable units currently listed for rent nearby; rentals leasing fast (median 14d on market — plan ~1-2 weeks tenant-placement turnaround); 73 units permitted in Peoria County in 2024 (0 in 5+ unit buildings).
Forward outlook
- Local home prices are declining (-3.0%/yr); year-one equity from $656 of loan paydown is wiped out by about $3k of value loss. Plan a longer hold.
- Peoria County population projected at -11% by 2050 — secular population decline; favor cash flow + early exit over multi-decade hold.
Negotiation context
- Only 14 days on market — expect competitive offers; lowballing is unlikely to land.
- 2 sale attempts since 9y ago with the ask held roughly flat each time — persistent listings suggest the price (not the market) is what's stuck; bring a comps-based counter.
- Current owner paid $41k; list at $95k implies a 133% gain — meaningful room to come down on a strong offer.
Risks & watch-outs
- Watch-outs: built in 1917 — expect roof / HVAC / electrical / plumbing capex.
Questions for the listing agent
- Built in 1917 — when were the roof, HVAC, electrical panel, plumbing, and water heater last replaced?
- Is there a deadline driving the sale (1031 exchange, divorce, estate, relocation)? That informs how much negotiation room exists.
- Schools are D-rated, which usually means shorter tenancies and higher turnover. Who's the typical renter profile here, and what's been the actual vacancy rate?
- Crime grade is D in this area — have there been break-ins, vandalism, or insurance claims at this property in the last 3 years? What carrier currently insures it and at what premium?
- What's the average days-on-market for RENTAL listings here right now (not sales)? A rising rental-DOM trend means longer vacancies and softer asking-rent achievability than the comps imply.
- What's the recent tenant-quality profile in this submarket — average credit score on applications, eviction rate, late-payment / NSF rate, and stable-employment percentage? A property-management company in the area should have these aggregated.
- How much new for-sale + rental construction is in the pipeline within 1–3 miles? Heavy new supply typically softens prices + rents 12–24 months out; constrained supply supports both.
Investment metrics
- 1% rule
- 1.03% ✓
- Cap rate
- 8.94%
- Cash-on-cash
- 9.44%
- DSCR
- 1.42
- GRM
- 8.1
CMA / ARV
- ARV (on-the-fly)
- $124,176
- Comps found
- 10
Show comp detail 10 sales within ~0.75 mi
| Address | Dist | Beds/Ba | Sqft | Sold | Price | $/sf | Match |
|---|---|---|---|---|---|---|---|
| 100 Lewis Ct | 0.29mi | 4/2.0 (+1) | 1,212 (+2%) | 2mo | $130,000 | $107 | 73 |
| 107 Argentina Ave | 0.41mi | 3/1.0 | 1,130 (-5%) | 4mo | $118,000 | $104 | 68 |
| 320 Treasure St | 0.32mi | 4/1.0 (+1) | 1,227 (+3%) | 12mo | $85,000 | $69 | 66 |
| 114 Amsler St | 0.27mi | 3/1.0 | 1,235 (+3%) | 21mo | $128,750 | $104 | 64 |
| 123 Roosevelt St | 0.22mi | 3/2.0 | 1,132 (-5%) | 17mo | $55,000 | $49 | 63 |
| 106 Anna St | 0.53mi | 3/1.5 | 1,256 (+5%) | 8mo | $161,000 | $128 | 58 |
| 507 W Garfield Ave | 0.47mi | 3/1.0 | 1,220 (+2%) | 22mo | $125,000 | $102 | 56 |
| 6107 S Adams St | 0.20mi | 3/2.0 | 1,320 (+11%) | 20mo | $45,000 | $34 | 52 |
| 100 S Sanderson Ave | 0.70mi | 3/1.0 | 1,024 (-14%) | 5mo | $146,200 | $143 | 40 |
| 332 Harris Ln | 0.41mi | 2/1.0 (-1) | 1,016 (-15%) | 21mo | $105,000 | $103 | 33 |
Match score weights: distance 35% · size 25% · config 20% · recency 20%. Top-matched comps best support the ARV.
Projected returns pro-forma
-3.0% appreciation · 3.0% rent growth · sell at horizon
- IRR
- -2.1%
- Equity multiple
- 0.92×
- Total profit
- $-2,110
- Equity at exit
- $14,150
- IRR
- 7.5%
- Equity multiple
- 1.57×
- Total profit
- $15,126
- Equity at exit
- $8,205
Cash invested: $26,572 (down + closing). Projections, not guarantees.
Landlord ↔ Tenant lean methodology
- Overall (STATE)
- 43 Moderately Tenant-Leaning
- State Illinois
- 43 Moderately Tenant-Leaning · D+7
- County
- — inherits STATE
- City
- — inherits STATE
ZIP-level market 61607
- Home prices YoY
- -27.1%
- Active inventory
- 51
- Price-to-rent
- 8.1×
Monthly cashflow live
- Estimated rent
- $974 medium interval (Pro) →
- Mortgage (P&I)
- −$498
- Tax from tax record
- −$23 /mo · $281/yr
- Insurance
- −$40
- HOA
- −$0
- Vacancy / Maint / Mgmt
- −$205
- Net cashflow
- $209
Break-even live
UW: 25.0% down · 7.5% · 30yr · 1.5% tax · 5.0% vac · 8.0% maint · 8.0% mgmt
Financing live
Cash to close
- Down payment
- $23,725
- Closing costs
- $2,847
- Reserves months
- —
- Total cash needed
- —
Loan-product check · same deal, 3 products live
Conventional
25% down · 7.5% · 30yr
- Down + closing
- —
- Monthly P&I
- —
- Monthly cashflow
- —
- DSCR
- —
- Eligible?
- —
Personal DTI + credit; lowest rate.
DSCR
20% down · 8.5% · 30yr
- Down + closing
- —
- Monthly P&I
- —
- Monthly cashflow
- —
- DSCR
- —
- Eligible?
- —
No personal income docs; deal must DSCR.
Hard money
10% down · 12.0% · 12mo
- Down + closing
- —
- Monthly P&I
- —
- Monthly cashflow
- —
- DSCR
- —
- Eligible?
- —
Short-term bridge; refi at stabilization.
Rent comps 3 comps
| Address | Beds | Baths | Sqft | Rent | $/sqft | DOM | Units | Dist |
|---|---|---|---|---|---|---|---|---|
| 5817 S Adams St Bartonville, IL | 2.0 | 1.0 | 768 | $975 | $1.27 | 13d | 1 | 0.10mi |
| 2916 W Meidroth St Peoria, IL | 2.0 | 1.0 | 1125 | $1,049 | $0.93 | 21d | 1 | 1.15mi |
| 1825 S Kneer Ave Peoria, IL | 2.0 | 1.0 | 858 | $858 | $1.00 | 13d | 1 | 1.27mi |
Listing history 5 events
-
2026-05-12$94,900 Active
-
2021-08-06historical
-
2017-06-30soldstatus $40,750 327-char remark
Show marketing remark (327 chars)
Attention Investors! Great income potential with this 3BR/1BA home in Bartonville! Newer windows and siding. Water Heater, AC unit and Furnace also in good shape. Parking allowed on street and in parking lot of shop next door. In need of some TLC. Great income property near restaurants, bars, shops and school! BRING AN OFFER!
-
2017-05-09$40,000 327-char remark
Show marketing remark (327 chars)
Attention Investors! Great income potential with this 3BR/1BA home in Bartonville! Newer windows and siding. Water Heater, AC unit and Furnace also in good shape. Parking allowed on street and in parking lot of shop next door. In need of some TLC. Great income property near restaurants, bars, shops and school! BRING AN OFFER!
-
1999-05-17soldstatus $230,000
ⓘ Source: listings_history table (triggers on properties + properties_extension) + one-shot
backfill from property_details.listing_events for pre-trigger history.
Tax reassessment forecast IL · Partial reset (capped growth)
- Current annual tax
- $281 · $23/mo
- Projected year-2 tax
- $1,218 · $101/mo
- Expected delta
- +$937/yr (+$78/mo · 333.5%)
ⓘ Screening estimate from a state-policy table — verify with the county assessor before closing.
Climate risk First Street
- Flood 1/10 Low FEMA zone X · 0% chance over 30 yrs
- Wildfire 1/10 Low
- Heat 3/10 Moderate 7 d/yr ≥105°F today · 18 d/yr by 30 yrs out
- Wind 2/10 Low 100% chance of damaging wind over 30 yrs
- Air quality 3/10 Moderate 1 unhealthy d/yr today · 3 by 30 yrs out
Nearby sold comps map
Loading sold comps map…
Walkable amenities ~0.75 mi
Loading nearby amenities…
Taxation est. · year 1
- Rental income
- $11,691
- − Mortgage interest
- −$5,316
- − Property taxes
- −$281
- − Insurance
- −$474
- − Repairs & maintenance
- −$935
- − Management
- −$935
- − Depreciation
- −$2,761
- Taxable income
- $988
- Est. tax owed @ 24.0%
- −$237
- After-tax cash flow
- $2,271/yr
For passive investors: Depreciation is non-cash, so a rental often shows a tax loss while cash-flowing — sheltering income. Rental losses are passive: they offset passive income freely, and up to $25,000/yr can offset ordinary (W-2) income if you actively participate and your MAGI is under $100k (phasing out to $0 by $150k); unused losses carry forward. On sale, claimed depreciation is recaptured at up to 25%, and gains may owe capital-gains tax (a 1031 exchange can defer both). Figures are a year-1 estimate at your 24.0% rate — not tax advice; consult a CPA.
Schools (NCES district)
- District
- Limestone Chsd 310
- NCES district ID
- 1722950
- Math proficiency
- 25% ▲ 5.00%
- Reading proficiency
- 35% ▲ 4.00%
- Median HH income
- $49,759
- Composite
- 28.99/100
- National rank
- #11932
- State rank
- #486 of 919 in IL
Livability — Bartonville
- Score
- 62/100
- State rank
- #840
- US rank
- #16553
Category grades
Schools grade is shown separately in the Schools card above.
Census & demographics
- Census place
- Bartonville, IL
- Population (ZIP)
- 10,734
Population outlook (Peoria County) Hauer SSP2
- Today (2025)
- 183,007 people
- By 2030
- 179,643 · -1.8%
- By 2040
- 171,782 · -6.1%
- By 2050
- 163,508 · -10.7%
- By 2075
- 140,178 · -23.4%
- By 2100
- 114,493 · -37.4%
Race, ethnicity, and origin ACS 2023
- Neighborhood character
- Predominantly White (91%)
- Race & ethnicity
- White 91% Two or more races 4% Black 2% Hispanic / Latino 2% Asian 2%
- Common ancestry
- Romanian 2% Italian 2% Portuguese 2%
- Foreign-born
- 1%
- Languages at home
- 98% English-only · Vietnamese 1% Tagalog/Filipino 1%
Political lean MEDSL · Peoria
- 2024 margin
- Toss-up / Even · D 51.5% · R 46.9% · Other 1.6%
- 2008→2024 swing
- -9.2pp toward R · 2008: 13.9pp · 2024: 4.7pp
- All cycles
- 2024: D+4.7 2020: D+6.3 2016: D+2.8 2012: D+4.4 2008: D+13.9
Not yet ingested
- Civics
- —
Market trends
- HPI YoY
- ▼ -71.81%
- Current HPI
- 193.6234
- Rent YoY
- —
- Metro
- —
- State GDP YoY
- ▲ 1.59%
- F500 in state
- 60
Industry mix (Fortune 500 HQ in IL)
| Industry | F500 HQs | Revenue |
|---|---|---|
| Insurance | 4 | $201B |
|
||
| Consumer Goods | 4 | $87B |
|
||
| Industrial Machinery | 3 | $64B |
|
||
| Healthcare | 2 | $55B |
|
||
| Retail / Pharmacy | 1 | $148B |
|
||
| Agriculture / Food | 1 | $86B |
|
||
Price history
-58.7% since first listed5 events — show timeline
- 2026-05-12 Listed $94,900 RMLSA as Distributed by MLS Grid
- 2021-08-06 Listing Removed — RMLSA as Distributed by MLS Grid
- 2017-06-30 Sold (MLS) $40,750 RMLSA as Distributed by MLS Grid
- 2017-05-09 Listed $40,000 RMLSA as Distributed by MLS Grid
- 1999-05-17 Sold (Public Records) $230,000 Public Records
Property tax history
-12.6%/yrLatest (2024): $281 · -2.0% YoY. Source: county tax records.
Cash-flow waterfall
monthlySold comps — $/sqft
last 12 mo · ≤1 miLoading sold comps…