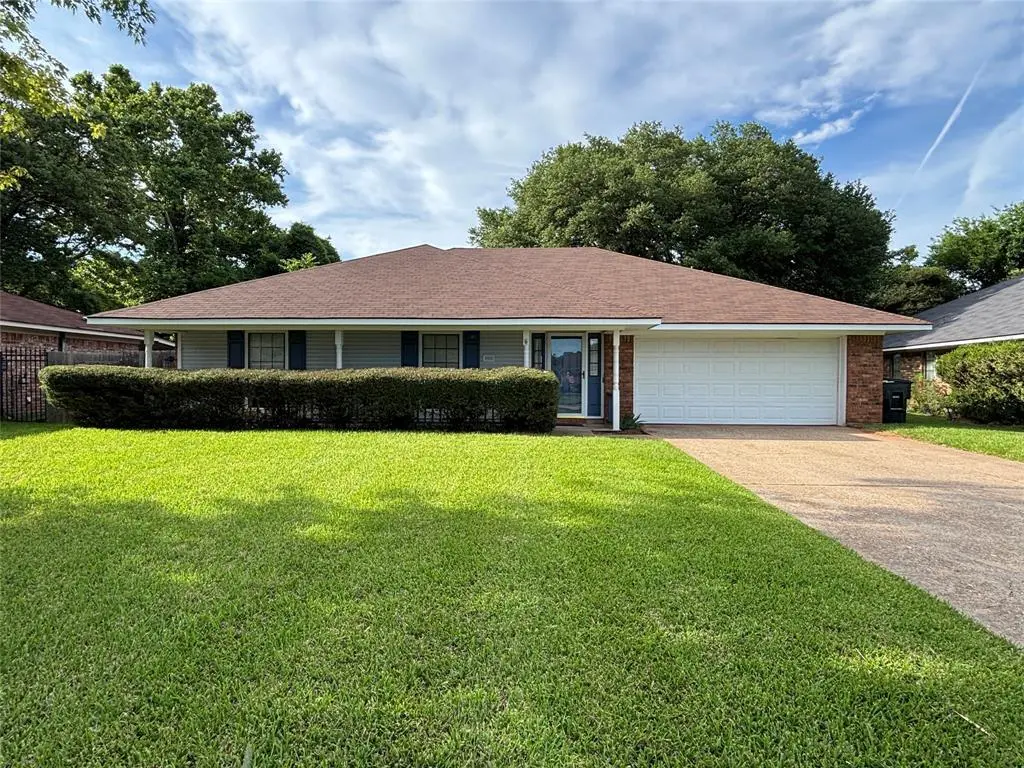
2527 Spruce Dr · Bossier City, LA
Flood risk 1/10 · Minimal
- FEMA flood zone
- X (unshaded)
- Chance of flooding over 30 yrs
- 0.0%
- Est. flood insurance / yr
- $507 – $1,088
Fire risk 1/10 · Minimal
- Est. fire insurance / yr
- $1,269 – $2,357
Heat risk 7/10 · Major
- Hot days now (above 110°F)
- 7 days/yr
- Hot days in 30 yrs
- 22 days/yr
Wind risk 6/10 · Moderate
- Chance of severe wind over 30 yrs
- 77.0%
Air-quality risk 2/10 · Minimal
- Unhealthy air days now
- 1 days/yr
- Unhealthy air days in 30 yrs
- 1 days/yr
Risk factors via First Street. Map © Google.
Why this score? — see what drove the D+ grade
The composite is a weighted blend of 9 inputs, each scored 0–100. Each bar is that input's sub-score; the figure is the points it added to the 100-point composite (weight × sub-score).
- Cash flow +14.0/30.0
- ARV discount +9.9/15.0
- DSCR +4.2/10.0
- Rent growth +4.1/5.0
- Schools +3.8/10.0
- Livability +3.6/5.0
- 1% rule +3.3/10.0
- Condition / age +2.5/5.0
- Appreciation +0.0/10.0
$235,500
🖨 Deal sheet (PDF) 📄 Offer letter ✓ Due diligence
Listing remarks MLS
This beauty captures your attention with it's curb appeal soon as you drive up, with an appealing veranda across the front overlooking the luscious lawn. Walk in the foyer to a spacious family room large enough for a sectional with gleaming wood floors. Kitchen and baths have been updated with granite counter tops. Enjoy this summer grilling out on the covered back patio, backyard is fully fenced with double gate. Back yard features playset for kiddos and play house, that could also be used for storage. New roof 2020 and HVAC 2017. Conveniently located near shopping, restaurants, hospital, and walking distance to park. Won't last long!
Key facts
- Covered front porch
- Large breakfast bar
- Granite countertops
Tags
Property features AI
Finance
- Financial info: Treat as clear loan type; No second mortgage
- HOA & community: No homeowners association
Exterior
- Parking: Attached garage; 2-car garage; 2 covered parking spaces
- Security: Smoke detector(s)
- Utilities: City water; City sewer; Electricity connected; Not in a municipal utility district
- Home design: Single family residence; Residential property; One-story; Not attached to another property; Subdivision: Brownlee Estates Sub
- Construction: Built in 1984; Brick and siding construction; Shingle roof; Slab foundation
- Exterior features: Covered porch(es); Covered patio/porch; Chain link and wood fencing; Other outbuilding/structure
Interior
- Kitchen: Dishwasher; Disposal; Electric range; Refrigerator; Granite counters
- Bedrooms: 3 bedrooms (primary bedroom on main level)
- Flooring: Carpet; Hardwood; Tile
- Bathrooms: 2 full bathrooms
- Interior features: Built-in features; Granite counters; Paneling; Walk-in closet(s); One living area; One dining area; Living room
- Laundry & utility: Utility room
Neighborhood map
What this means for you Summary
Snapshot
- This is a 3-bed/2.0-bath single-family listed at $236k.
Deal economics
- At list price, monthly cash flow is $30 ($364/yr) — positive.
- The deal already cash-flows at list — no discount required.
- To meet the 1% rule (rent ≥ 1% of price), the offer needs to be $195k (17.2% below list).
- Recommended offer: $195k (17.2% below list) — sets the bar for 1% rule.
- Cap rate 6.4% vs local median 4.7% in Bossier City — top-decile yield for the area; either an underpriced asset or a hidden risk that comps aren't pricing in. Stress-test before assuming the spread holds.
Location & tenants
- Location reads 71/100 on livability (#47 in LA) — a middle-class / working-renter tenant base. Strengths: commute A+, cost of living A+, housing A+; Watch: employment D+, crime F, amenities F.
- Bossier Parish (urban): math 40% / reading 47% proficiency, ranked #17 of 98 in LA (top 17%) — families likely to look elsewhere, expect single-tenant / working-renter base with shorter leases.
- Zoned schools: Bossier Elementary School (math 8% / reading 17%, grade F, #550 of 646 statewide, top 88%, 222 students, 93% FRL); Greenacres Middle School (math 24% / reading 33%, grade F, #119 of 218 statewide, top 57%, 611 students, 75% FRL); Airline High School (math 49% / reading 56%, grade C-, #30 of 265 statewide, top 12%, 2,021 students, 56% FRL) — zoned schools average 75% FRL vs 41% district-wide (33 pts higher); higher-poverty schools than district average — tighter screening recommended.
- Zoned-school proficiency averages 31% at this address vs 44% district-wide (-12 pts) — the specific schools serving this property underperform the Bossier Parish average; the district grade overstates school quality for this exact location.
- Market conditions: Rents rising fast (+6.6%/yr); 426 active listings in the ZIP; 4 comparable units currently listed for rent nearby; rentals lingering (median 46d on market — plan ~5-8 weeks vacancy on turnover, expect pricing pressure); 50% of comp listings sitting > 30 days — soft ceiling on asking rent; 716 units permitted in Bossier Parish in 2024 (0 in 5+ unit buildings).
- This rent runs 36% of the median local income ($65k/yr) — at the standard rent-burdened threshold; future hikes will face affordability resistance.
Forward outlook
- Local home prices are declining (-3.0%/yr); year-one equity from $2k of loan paydown is wiped out by about $7k of value loss. Plan a longer hold.
- Bossier County population projected at +28% by 2050 — long-run rental-demand tailwind backs the buy-and-hold thesis.
Negotiation context
- Only 8 days on market — expect competitive offers; lowballing is unlikely to land.
- 4 sale attempts since 4y ago with the ask held roughly flat each time — persistent listings suggest the price (not the market) is what's stuck; bring a comps-based counter.
Risks & watch-outs
- Climate carrying-cost: major wind risk, 77% chance of damaging wind over 30y; extreme-heat days projected 7→22/yr by 2055 (HVAC capex compounding) — expect insurance premiums to compound above CPI over the hold.
Questions for the listing agent
- Is there a deadline driving the sale (1031 exchange, divorce, estate, relocation)? That informs how much negotiation room exists.
- Schools are B-rated — typically a magnet for longer-tenancy family renters. What's the average tenant stay here, and is there a school-zone premium baked into asking?
- Crime grade is F in this area — have there been break-ins, vandalism, or insurance claims at this property in the last 3 years? What carrier currently insures it and at what premium?
- The area grade is low — what's the realistic commute time and amenity access for the typical tenant pool here? Any planned neighborhood developments (good or bad) we should know about?
- What's the average days-on-market for RENTAL listings here right now (not sales)? A rising rental-DOM trend means longer vacancies and softer asking-rent achievability than the comps imply.
- What's the recent tenant-quality profile in this submarket — average credit score on applications, eviction rate, late-payment / NSF rate, and stable-employment percentage? A property-management company in the area should have these aggregated.
- How much new for-sale + rental construction is in the pipeline within 1–3 miles? Heavy new supply typically softens prices + rents 12–24 months out; constrained supply supports both.
Investment metrics
- 1% rule
- 0.83% ✗
- Cap rate
- 6.45%
- Cash-on-cash
- 0.55%
- DSCR
- 1.02
- GRM
- 10.1
CMA / ARV
- ARV (on-the-fly)
- $248,710
- Comps found
- 12
Show comp detail 12 sales within ~0.75 mi
| Address | Dist | Beds/Ba | Sqft | Sold | Price | $/sf | Match |
|---|---|---|---|---|---|---|---|
| 2608 Brown St | 0.21mi | 3/2.0 | 1,612 (-0%) | 2mo | $248,000 | $154 | 88 |
| 2502 Downs St | 0.24mi | 3/2.0 | 1,658 (+3%) | 3mo | $249,900 | $151 | 82 |
| 2564 Downs Cir | 0.11mi | 3/2.0 | 1,786 (+11%) | 8mo | $234,900 | $132 | 70 |
| 2628 Palmetto Dr | 0.38mi | 3/2.0 | 1,496 (-7%) | 7mo | $208,000 | $139 | 64 |
| 409 Summit Dr | 0.70mi | 3/2.0 | 1,675 (+4%) | 1mo | $200,000 | $119 | 60 |
| 401 Edgemont Dr | 0.65mi | 3/2.0 | 1,713 (+6%) | 0mo | $225,000 | $131 | 59 |
| 583 Northpark Ct | 0.56mi | 3/2.5 | 1,562 (-3%) | 9mo | $254,900 | $163 | 59 |
| 411 Stacey Ln | 0.69mi | 3/2.0 | 1,685 (+4%) | 3mo | $339,900 | $202 | 58 |
| 143 Arbor Pl | 0.59mi | 3/2.0 | 1,745 (+8%) | 2mo | $379,900 | $218 | 58 |
| 301 Cranbrook Ct | 0.66mi | 3/2.0 | 1,837 (+14%) | 0mo | $375,000 | $204 | 46 |
| 117 Arbor Pl | 0.69mi | 2/2.0 (-1) | 1,504 (-7%) | 6mo | $294,900 | $196 | 46 |
| 421 Edgemont Dr | 0.71mi | 3/2.0 | 1,809 (+12%) | 5mo | $269,900 | $149 | 42 |
Match score weights: distance 35% · size 25% · config 20% · recency 20%. Top-matched comps best support the ARV.
Projected returns pro-forma
-3.0% appreciation · 6.56% rent growth · sell at horizon
- IRR
- -11.8%
- Equity multiple
- 0.56×
- Total profit
- $-29,040
- Equity at exit
- $35,114
- IRR
- 1.7%
- Equity multiple
- 1.14×
- Total profit
- $8,968
- Equity at exit
- $20,362
Cash invested: $65,940 (down + closing). Projections, not guarantees.
Landlord ↔ Tenant lean methodology
- Overall (STATE)
- 90 Strongly Landlord-Friendly
- State Louisiana
- 90 Strongly Landlord-Friendly · R+12
- County
- — inherits STATE
- City
- — inherits STATE
ZIP-level market 71111
- Home prices YoY
- -34.8%
- Rents YoY
- 6.6%
- Active inventory
- 426
- Price-to-rent
- 10.1×
Monthly cashflow live
- Estimated rent
- $1,950 medium interval (Pro) →
- Mortgage (P&I)
- −$1,235
- Tax from tax record
- −$177 /mo · $2,124/yr
- Insurance
- −$98
- HOA
- −$0
- Vacancy / Maint / Mgmt
- −$409
- Net cashflow
- $30
Break-even live
Sensitivity live
| Price | -10% $164 | -5% $97 | +0% $30 | +5% $-36 | +10% $-103 |
|---|---|---|---|---|---|
| Rent | -10% $-124 | -5% $-47 | +0% $30 | +5% $107 | +10% $184 |
| Rate | -1.0pp $149 | -0.5pp $90 | base $30 | +0.5pp $-31 | +1.0pp $-93 |
UW: 25.0% down · 7.5% · 30yr · 1.5% tax · 5.0% vac · 8.0% maint · 8.0% mgmt
Financing live
Cash to close
- Down payment
- $58,875
- Closing costs
- $7,065
- Reserves months
- —
- Total cash needed
- —
Loan-product check · same deal, 3 products live
Conventional
25% down · 7.5% · 30yr
- Down + closing
- —
- Monthly P&I
- —
- Monthly cashflow
- —
- DSCR
- —
- Eligible?
- —
Personal DTI + credit; lowest rate.
DSCR
20% down · 8.5% · 30yr
- Down + closing
- —
- Monthly P&I
- —
- Monthly cashflow
- —
- DSCR
- —
- Eligible?
- —
No personal income docs; deal must DSCR.
Hard money
10% down · 12.0% · 12mo
- Down + closing
- —
- Monthly P&I
- —
- Monthly cashflow
- —
- DSCR
- —
- Eligible?
- —
Short-term bridge; refi at stabilization.
Rent comps 4 comps
| Address | Beds | Baths | Sqft | Rent | $/sqft | DOM | Units | Dist |
|---|---|---|---|---|---|---|---|---|
| 2542 Spruce Dr Bossier City, LA | 3.0 | 2.0 | 1432 | $1,950 | $1.36 | 15d | 1 | 0.11mi |
| 4855 Airline Dr Bossier City, LA | 1.0–3.0 | 1.0–2.0 | 1086 | $1,785 | $1.64 | 15d | 12 | 0.70mi |
| 3303 Colonial Dr Bossier City, LA | 3.0 | 2.0 | 1716 | $2,200 | $1.28 | 45d | 1 | 1.14mi |
| 8 Meadow Creek Dr Bossier City, LA | 2.0 | 2.0 | 1108 | $1,600 | $1.44 | 45d | 1 | 1.24mi |
Listing history 7 events
-
2026-06-21days on market $235,500 Active 8 DOM
-
2026-06-18days on market $235,500 Active 5 DOM
-
2026-06-17days on market $235,500 Active 4 DOM
-
2026-06-16days on market $235,500 Active 3 DOM
-
2026-06-15days on market $235,500 Active 2 DOM
-
2026-06-14remarks 693-char remark
-
2026-06-14$235,500 Active 1 DOM
ⓘ Source: listings_history table (triggers on properties + properties_extension) + one-shot
backfill from property_details.listing_events for pre-trigger history.
Tax reassessment forecast LA · Resets to sale price
- Current annual tax
- $2,124 · $177/mo
- Projected year-2 tax
- $2,124 · $177/mo
- Expected delta
- $0/yr ($0/mo · 0.0%)
ⓘ Screening estimate from a state-policy table — verify with the county assessor before closing.
Climate risk First Street
- Flood 1/10 Low FEMA zone X (unshaded) · 0% chance over 30 yrs
- Wildfire 1/10 Low
- Heat 7/10 Severe 7 d/yr ≥110°F today · 22 d/yr by 30 yrs out
- Wind 6/10 Major 77% chance of damaging wind over 30 yrs
- Air quality 2/10 Low 1 unhealthy d/yr today · 1 by 30 yrs out
Nearby sold comps map
Loading sold comps map…
Walkable amenities ~0.75 mi
Loading nearby amenities…
Taxation est. · year 1
- Rental income
- $23,399
- − Mortgage interest
- −$13,192
- − Property taxes
- −$2,124
- − Insurance
- −$1,178
- − Repairs & maintenance
- −$1,872
- − Management
- −$1,872
- − Depreciation
- −$6,851
- Taxable loss
- −$3,689
- Est. tax savings @ 24.0%
- +$885
- After-tax cash flow
- $1,249/yr
For passive investors: Depreciation is non-cash, so a rental often shows a tax loss while cash-flowing — sheltering income. Rental losses are passive: they offset passive income freely, and up to $25,000/yr can offset ordinary (W-2) income if you actively participate and your MAGI is under $100k (phasing out to $0 by $150k); unused losses carry forward. On sale, claimed depreciation is recaptured at up to 25%, and gains may owe capital-gains tax (a 1031 exchange can defer both). Figures are a year-1 estimate at your 24.0% rate — not tax advice; consult a CPA.
Schools (NCES district)
- District
- Bossier Parish
- NCES district ID
- 2200270
- Math proficiency
- 40% ▼ -32.00%
- Reading proficiency
- 47% ▼ -28.00%
- Median HH income
- $51,326
- Composite
- 37.5/100
- National rank
- #4402
- State rank
- #17 of 98 in LA
Livability — Bossier City
- Score
- 71/100
- State rank
- #47
- US rank
- #7044
Category grades
Schools grade is shown separately in the Schools card above.
Census & demographics
- Census place
- Bossier City, LA
- County
- Bossier Parish · 98,704 people
- City population
- 91,925
- Metro
- Shreveport-Bossier City, LA
- Population (ZIP)
- 43,925
- Household income
- $65,292
- Rent vs Own
- Severe rent burden
- 1942.0
Population outlook (Bossier County) Hauer SSP2
- Today (2025)
- 143,247 people
- By 2030
- 151,802 · +6.0%
- By 2040
- 168,194 · +17.4%
- By 2050
- 183,533 · +28.1%
- By 2075
- 217,009 · +51.5%
- By 2100
- 230,091 · +60.6%
Race, ethnicity, and origin ACS 2023
- Neighborhood character
- Diverse neighborhood (Simpson 0.60)
- Race & ethnicity
- White 56% Black 29% Hispanic / Latino 9% Two or more races 8% Asian 3%
- Hispanic origin (detail)
- Mexican 5%
- Common ancestry
- Lithuanian 2% Iranian 1% Slovak 1%
- Foreign-born
- 5% · Canada, Vietnam
- Languages at home
- 90% English-only · Spanish 7% Vietnamese 1% French/Haitian/Cajun 1%
Political lean MEDSL · Bossier
- 2024 margin
- Solid R (+43.3) · D 27.7% · R 71.0% · Other 1.3%
- 2008→2024 swing
- +0.3pp no change · 2008: -43.7pp · 2024: -43.3pp
- All cycles
- 2024: R+43.3 2020: R+41.0 2016: R+45.8 2012: R+45.4 2008: R+43.7
Not yet ingested
- Civics
- —
Market trends
- HPI YoY
- ▼ -79.78%
- Current HPI
- 149.4336
- Rent YoY
- ▲ 6.56%
- Metro
- Shreveport-Bossier City, LA
- State GDP YoY
- ▲ 3.29%
- F500 in state
- 10
Industry mix (Fortune 500 HQ in LA)
| Industry | F500 HQs | Revenue |
|---|---|---|
| Telecommunications | 2 | $23B |
|
||
| Utilities | 1 | $12B |
|
||
| Wholesale / Distribution | 1 | $5B |
|
||
| Advertising | 1 | $2B |
|
||
Price history
+107.5% since first listed12 events — show timeline
- 2026-06-12 Listed $235,500 NTREIS
- 2024-11-06 Rental Removed $1,750 NTREIS
- 2024-09-07 Price Changed $1,750 NTREIS
- 2024-07-02 Listed for Rent $1,850 NTREIS
- 2022-06-27 Sold (Public Records) $231,000 Public Records
- 2022-06-24 Sold (MLS) — NTREIS
- 2022-06-06 Pending — NTREIS
- 2022-06-04 Relisted — NTREIS
- 2022-05-27 Pending — NTREIS
- 2022-05-26 Listed $220,000 NTREIS
- 2015-05-12 Sold (Public Records) $167,000 Public Records
- 2002-06-26 Sold (Public Records) $113,500 Public Records
Property tax history
+7.2%/yrLatest (2025): $2,124 · -1.3% YoY. Source: county tax records.
Cash-flow waterfall
monthlySold comps — $/sqft
last 12 mo · ≤1 miLoading sold comps…