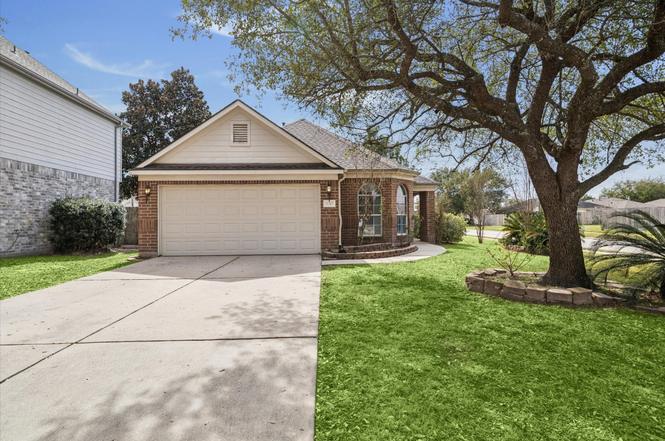
12302 Beacon Tree Ct · Atascocita, TX
Flood risk 1/10 · Minimal
- FEMA flood zone
- X (unshaded)
- Chance of flooding over 30 yrs
- 0.0%
- Est. flood insurance / yr
- $507 – $1,088
Fire risk 3/10 · Minor
- Est. fire insurance / yr
- $1,222 – $2,270
Heat risk 9/10 · Severe
- Hot days now (above 110°F)
- 7 days/yr
- Hot days in 30 yrs
- 26 days/yr
Wind risk 9/10 · Severe
- Chance of severe wind over 30 yrs
- 99.0%
Air-quality risk 3/10 · Minor
- Unhealthy air days now
- 3 days/yr
- Unhealthy air days in 30 yrs
- 3 days/yr
Risk factors via First Street. Map © Google.
Why this score? — see what drove the D grade
The composite is a weighted blend of 9 inputs, each scored 0–100. Each bar is that input's sub-score; the figure is the points it added to the 100-point composite (weight × sub-score).
- Cash flow +9.2/30.0
- ARV discount +7.7/15.0
- Appreciation +4.5/10.0
- 1% rule +4.2/10.0
- Schools +3.9/10.0
- Livability +3.5/5.0
- DSCR +2.6/10.0
- Rent growth +2.5/5.0
- Condition / age +2.5/5.0
$250,000
🖨 Deal sheet 📄 Offer letter ✓ Due diligence
Listing remarks MLS
THIS IS A GREAT HOME FOR ENTERTAINING WITH A SPACIOUS LIVING AREA, LARGE OPEN KITCHEN, FORMAL DINING AND BREAKFAST ROOM WITH A BAY WINDOW. SPLIT BEDROOMS FOR PRIVACY. MASTER BATH HAS GARDEN TUB AND SEPARATE SHOWER, DOUBLE SINKS. CERAMIC TILE IN ENTRY, KITCHEN, BREAKFAST, AND LAUNDRY ROOM. THE CORNER LOT HAS A FULL SPRINKLER SYSTEM. SOLAR SCREENS. A GREAT BY AS IS.
Key facts
- Pantry
- Quartz countertops
- Brand new flooring
Tags
Neighborhood map
What this means for you Summary
Snapshot
- This is a 3-bed/2.0-bath single-family listed at $250k.
Deal economics
- At list price, monthly cash flow is $-186 ($-2k/yr) — negative.
- To cash-flow at today's rent, offer at most $217k (13.2% below list).
- To meet the 1% rule (rent ≥ 1% of price), the offer needs to be $230k (8.2% below list).
- Recommended offer: $217k (13.2% below list) — sets the bar for cash-flow.
- Cap rate 5.4% vs local median 4.1% in Atascocita — top-decile yield for the area; either an underpriced asset or a hidden risk that comps aren't pricing in. Stress-test before assuming the spread holds.
Location & tenants
- Location reads 70/100 on livability (#346 in TX) — a middle-class / working-renter tenant base. Strengths: employment A+, cost of living A+, housing A+; Watch: amenities F, commute F, health & safety F.
- Humble ISD (urban): math 38% / reading 44% proficiency, ranked #262 of 826 in TX (top 32%) — families likely to look elsewhere, expect single-tenant / working-renter base with shorter leases.
- Zoned schools: Atascocita Springs El (math 44% / reading 51%, grade D, #989 of 4,322 statewide, top 23%, 989 students, 37% FRL); Timberwood Middle (math 31% / reading 46%, grade F, #704 of 1,662 statewide, top 43%, 1,094 students, 54% FRL); Atascocita H S (math 41% / reading 52%, grade D-, #621 of 1,632 statewide, top 38%, 3,829 students, 42% FRL).
- Market conditions: Rents flat; 669 active listings in the ZIP; 21 comparable units currently listed for rent nearby; rentals leasing fast (median 12d on market — plan ~1-2 weeks tenant-placement turnaround); high-income renter base; 29,883 units permitted in Harris County in 2024 (8,621 in 5+ unit buildings).
Forward outlook
- Local home prices are declining (-0.9%/yr); year-one equity from $2k of loan paydown is wiped out by about $2k of value loss. Plan a longer hold.
- Harris County population projected at +47% by 2050 — long-run rental-demand tailwind backs the buy-and-hold thesis.
Negotiation context
- It's been on market 24 days — a 2% lower offer ($246k) is reasonable based on typical stale-listing flexibility.
- 3 sale attempts since 15y ago with the ask held roughly flat each time — persistent listings suggest the price (not the market) is what's stuck; bring a comps-based counter.
Risks & watch-outs
- Watch-outs: property tax is 2.6% of price.
- Climate carrying-cost: severe wind risk, 99% chance of damaging wind over 30y; extreme-heat days projected 7→26/yr by 2055 (HVAC capex compounding) — expect insurance premiums to compound above CPI over the hold.
Questions for the listing agent
- What do current leases actually rent for vs. the listed asking? Can we see a recent rent roll and the last 12 months of T-12 income?
- Property tax is high relative to price — has the assessment been appealed recently, and will the sale trigger a re-assessment?
- What does the HOA fee cover, when was the last increase, and are there any pending special assessments or reserve-fund shortfalls?
- Is there a deadline driving the sale (1031 exchange, divorce, estate, relocation)? That informs how much negotiation room exists.
- The area grade is low — what's the realistic commute time and amenity access for the typical tenant pool here? Any planned neighborhood developments (good or bad) we should know about?
- What's the average days-on-market for RENTAL listings here right now (not sales)? A rising rental-DOM trend means longer vacancies and softer asking-rent achievability than the comps imply.
- What's the recent tenant-quality profile in this submarket — average credit score on applications, eviction rate, late-payment / NSF rate, and stable-employment percentage? A property-management company in the area should have these aggregated.
- How much new for-sale + rental construction is in the pipeline within 1–3 miles? Heavy new supply typically softens prices + rents 12–24 months out; constrained supply supports both.
Investment metrics
- 1% rule
- 0.92% ✗
- Cap rate
- 5.40%
- Cash-on-cash
- -3.20%
- DSCR
- 0.86
- GRM
- 9.1
CMA / ARV
- ARV (on-the-fly)
- $251,160
- Comps found
- 12
Show comp detail 12 sales within ~0.75 mi
| Address | Dist | Beds/Ba | Sqft | Sold | Price | $/sf | Match |
|---|---|---|---|---|---|---|---|
| 12302 Beacon Tree Ct | 0.00mi | 4/2.0 (+1) | 1,794 (0%) | 0mo | $250,000 | $139 | 95 |
| 12107 English Brook Cir | 0.18mi | 3/2.0 | 1,640 (-9%) | 2mo | $260,000 | $159 | 76 |
| 12127 Carriage Oak Cir | 0.20mi | 3/2.0 | 1,597 (-11%) | 2mo | $256,000 | $160 | 71 |
| 4910 Blue Spruce Hl | 0.53mi | 4/2.0 (+1) | 1,778 (-1%) | 0mo | $268,000 | $151 | 69 |
| 4826 Gypsy Forest Dr | 0.55mi | 4/2.0 (+1) | 1,791 (-0%) | 1mo | $249,999 | $140 | 68 |
| 12311 Carriage Oak Cir | 0.14mi | 3/2.0 | 1,526 (-15%) | 5mo | $229,999 | $151 | 64 |
| 11831 Rainbow Bridge Ln | 0.73mi | 3/2.0 | 1,770 (-1%) | 3mo | $239,000 | $135 | 61 |
| 17806 June Forest Dr | 0.72mi | 3/2.0 | 1,736 (-3%) | 4mo | $230,000 | $132 | 58 |
| 12218 Glen Crossing Cir | 0.34mi | 3/2.0 | 1,526 (-15%) | 4mo | $195,000 | $128 | 56 |
| 4814 Winding Timbers Ct | 0.59mi | 3/2.0 | 1,604 (-11%) | 0mo | $264,900 | $165 | 54 |
| 12223 Zenith Ridge Way | 0.29mi | 4/2.0 (+1) | 2,049 (+14%) | 5mo | $255,000 | $124 | 53 |
| 4826 Drew Forest Ln | 0.51mi | 4/3.0 (+1) | 2,002 (+12%) | 1mo | $268,700 | $134 | 47 |
Match score weights: distance 35% · size 25% · config 20% · recency 20%. Top-matched comps best support the ARV.
Projected returns pro-forma
-0.95% appreciation · 0.09% rent growth · sell at horizon
- IRR
- -12.4%
- Equity multiple
- 0.48×
- Total profit
- $-36,507
- Equity at exit
- $60,897
- IRR
- -8.7%
- Equity multiple
- 0.28×
- Total profit
- $-50,643
- Equity at exit
- $64,417
Cash invested: $70,000 (down + closing). Projections, not guarantees.
Landlord ↔ Tenant lean methodology
- Overall (STATE)
- 87 Strongly Landlord-Friendly
- State Texas
- 87 Strongly Landlord-Friendly · R+5
- County
- — inherits STATE
- City
- — inherits STATE
ZIP-level market 77346
- Home prices YoY
- -0.4%
- Rents YoY
- 0.1%
- Active inventory
- 669
- Price-to-rent
- 9.1×
Monthly cashflow live
- Estimated rent
- $2,295 high interval (Pro) →
- Mortgage (P&I)
- −$1,311
- Tax from tax record
- −$548 /mo · $6,571/yr
- Insurance
- −$104
- HOA
- −$37
- Vacancy / Maint / Mgmt
- −$482
- Net cashflow
- $-186
Break-even live
UW: 25.0% down · 7.5% · 30yr · 1.5% tax · 5.0% vac · 8.0% maint · 8.0% mgmt
Financing live
Cash to close
- Down payment
- $62,500
- Closing costs
- $7,500
- Reserves months
- —
- Total cash needed
- —
Loan-product check · same deal, 3 products live
Conventional
25% down · 7.5% · 30yr
- Down + closing
- —
- Monthly P&I
- —
- Monthly cashflow
- —
- DSCR
- —
- Eligible?
- —
Personal DTI + credit; lowest rate.
DSCR
20% down · 8.5% · 30yr
- Down + closing
- —
- Monthly P&I
- —
- Monthly cashflow
- —
- DSCR
- —
- Eligible?
- —
No personal income docs; deal must DSCR.
Hard money
10% down · 12.0% · 12mo
- Down + closing
- —
- Monthly P&I
- —
- Monthly cashflow
- —
- DSCR
- —
- Eligible?
- —
Short-term bridge; refi at stabilization.
Rent comps 21 comps
| Address | Beds | Baths | Sqft | Rent | $/sqft | DOM | Units | Dist |
|---|---|---|---|---|---|---|---|---|
| 12214 Landsdown Ridge Way Humble, TX | 4.0 | 2.5 | 2389 | $2,165 | $0.91 | 11d | 1 | 0.20mi |
| 18123 Noble Forest Dr Humble, TX | 4.0 | 2.5 | 2328 | $2,595 | $1.11 | 5d | 1 | 0.26mi |
| 17834 Yellow Birch Trl Humble, TX | 3.0 | 2.0 | 1532 | $1,646 | $1.07 | 44d | 1 | 0.52mi |
| 18103 Yellowstone Trl Humble, TX | 4.0 | 2.5 | 2602 | $2,371 | $0.91 | 44d | 1 | 0.56mi |
| 18030 June Forest Dr Humble, TX | 4.0 | 2.5 | 2341 | $2,236 | $0.96 | 4d | 1 | 0.59mi |
| 17923 Diamond Peak Ct Humble, TX | 4.0 | 2.0 | 2171 | $2,336 | $1.08 | 5d | 1 | 0.69mi |
| 18018 Heron Forest Ln Humble, TX | 3.0 | 2.0 | 1795 | $1,939 | $1.08 | 24d | 1 | 0.70mi |
| 12323 Crescent Mountain Ln Humble, TX | 3.0 | 2.5 | 2358 | $2,326 | $0.99 | 5d | 1 | 0.74mi |
| 12643 Jamestown Crossing Ln Humble, TX | 4.0 | 2.0 | 2450 | $4,995 | $2.04 | 24d | 1 | 0.79mi |
| 5231 Flax Bourton St Humble, TX | 3.0 | 2.0 | 1513 | $1,856 | $1.23 | 2d | 1 | 0.88mi |
| 5303 Hill Timbers Dr Humble, TX | 3.0 | 2.0 | 1884 | $2,050 | $1.09 | 44d | 1 | 0.92mi |
| 19100 Woodland Hills Dr Humble, TX | 1.0–4.0 | 1.0–2.0 | 1040 | $1,475 | $1.42 | 2d | 10 | 1.14mi |
| 17417 W Lake Houston Pkwy Humble, TX | 1.0–2.0 | 1.0–2.0 | 956 | $1,795 | $1.88 | 3d | 12 | 1.17mi |
| 3918 Atascocita Rd Humble, TX | 1.0–2.0 | 1.0–2.0 | 945 | $1,650 | $1.75 | 15d | 13 | 1.22mi |
| 18810 Woodbreeze Dr Humble, TX | 4.0 | 2.5 | 2200 | $2,279 | $1.04 | 24d | 1 | 1.23mi |
| 17401 W Lake Houston Pkwy Humble, TX | 1.0–3.0 | 1.0–2.0 | 1085 | $2,163 | $1.99 | 1d | 42 | 1.29mi |
| 17571 W Lake Houston Pkwy Humble, TX | 2.0 | 1.0–2.0 | 922 | $1,950 | $2.11 | 2d | 43 | 1.35mi |
| 3818 Oaktrace Dr Humble, TX | 3.0 | 2.0 | 1644 | $2,200 | $1.34 | 44d | 1 | 1.36mi |
| 7002 Echo Pines Dr Humble, TX | 3.0 | 2.0 | 1738 | $1,869 | $1.08 | 15d | 1 | 1.41mi |
| 16807 Hemlock Grove Dr Humble, TX | 4.0 | 3.0 | 2476 | $3,100 | $1.25 | 44d | 1 | 1.41mi |
| 17260 W Lake Houston Pkwy Atascocita, TX | 1.0–3.0 | 1.0–2.5 | 1065 | $2,470 | $2.32 | 1d | 12 | 1.49mi |
HOA detail
- Monthly dues
- $37 · $444/yr
Listing history 10 events
-
2026-04-28status Pending
-
2026-04-20status Pending
-
2026-04-08status Active
-
2026-02-24status Pending
-
2026-02-24historical
-
2026-02-19$250,000 Active
-
2011-08-25soldstatus 371-char remark
Show marketing remark (371 chars)
THIS IS A GREAT HOME FOR ENTERTAINING WITH A SPACIOUS LIVING AREA, LARGE OPEN KITCHEN, FORMAL DINING AND BREAKFAST ROOM WITH A BAY WINDOW. SPLIT BEDROOMS FOR PRIVACY. MASTER BATH HAS GARDEN TUB AND SEPARATE SHOWER, DOUBLE SINKS. CERAMIC TILE IN ENTRY, KITCHEN, BREAKFAST, AND LAUNDRY ROOM. THE CORNER LOT HAS A FULL SPRINKLER SYSTEM. SOLAR SCREENS. A GREAT BY AS IS.
-
2011-06-17historical 371-char remark
Show marketing remark (371 chars)
THIS IS A GREAT HOME FOR ENTERTAINING WITH A SPACIOUS LIVING AREA, LARGE OPEN KITCHEN, FORMAL DINING AND BREAKFAST ROOM WITH A BAY WINDOW. SPLIT BEDROOMS FOR PRIVACY. MASTER BATH HAS GARDEN TUB AND SEPARATE SHOWER, DOUBLE SINKS. CERAMIC TILE IN ENTRY, KITCHEN, BREAKFAST, AND LAUNDRY ROOM. THE CORNER LOT HAS A FULL SPRINKLER SYSTEM. SOLAR SCREENS. A GREAT BY AS IS.
-
2011-06-08$84,900 371-char remark
Show marketing remark (371 chars)
THIS IS A GREAT HOME FOR ENTERTAINING WITH A SPACIOUS LIVING AREA, LARGE OPEN KITCHEN, FORMAL DINING AND BREAKFAST ROOM WITH A BAY WINDOW. SPLIT BEDROOMS FOR PRIVACY. MASTER BATH HAS GARDEN TUB AND SEPARATE SHOWER, DOUBLE SINKS. CERAMIC TILE IN ENTRY, KITCHEN, BREAKFAST, AND LAUNDRY ROOM. THE CORNER LOT HAS A FULL SPRINKLER SYSTEM. SOLAR SCREENS. A GREAT BY AS IS.
-
2007-07-03soldstatus
ⓘ Source: listings_history table (triggers on properties + properties_extension) + one-shot
backfill from property_details.listing_events for pre-trigger history.
Tax reassessment forecast TX · Resets to sale price
- Current annual tax
- $6,571 · $548/mo
- Projected year-2 tax
- $6,571 · $548/mo
- Expected delta
- $0/yr ($0/mo · 0.0%)
ⓘ Screening estimate from a state-policy table — verify with the county assessor before closing.
Climate risk First Street
- Flood 1/10 Low FEMA zone X (unshaded) · 0% chance over 30 yrs
- Wildfire 3/10 Moderate
- Heat 9/10 Extreme 7 d/yr ≥110°F today · 26 d/yr by 30 yrs out
- Wind 9/10 Extreme 99% chance of damaging wind over 30 yrs
- Air quality 3/10 Moderate 3 unhealthy d/yr today · 3 by 30 yrs out
Nearby sold comps map
Loading sold comps map…
Walkable amenities ~0.75 mi
Loading nearby amenities…
Taxation est. · year 1
- Rental income
- $27,545
- − Mortgage interest
- −$14,004
- − Property taxes
- −$6,571
- − Insurance
- −$1,250
- − Repairs & maintenance
- −$2,204
- − Management
- −$2,204
- − HOA
- −$444
- − Depreciation
- −$7,273
- Taxable loss
- −$6,404
- Est. tax savings @ 24.0%
- +$1,537
- After-tax cash flow
- $-700/yr
For passive investors: Depreciation is non-cash, so a rental often shows a tax loss while cash-flowing — sheltering income. Rental losses are passive: they offset passive income freely, and up to $25,000/yr can offset ordinary (W-2) income if you actively participate and your MAGI is under $100k (phasing out to $0 by $150k); unused losses carry forward. On sale, claimed depreciation is recaptured at up to 25%, and gains may owe capital-gains tax (a 1031 exchange can defer both). Figures are a year-1 estimate at your 24.0% rate — not tax advice; consult a CPA.
Schools (NCES district)
- District
- Humble ISD
- NCES district ID
- 4823910
- Math proficiency
- 38% ▼ -11.00%
- Reading proficiency
- 44% ▼ -7.00%
- Median HH income
- $83,946
- Composite
- 38.55/100
- National rank
- #4171
- State rank
- #262 of 826 in TX
Livability — Atascocita
- Score
- 70/100
- State rank
- #346
- US rank
- #7586
Category grades
Schools grade is shown separately in the Schools card above.
Census & demographics
- Census place
- Atascocita, TX
- County
- Harris County · 4,702,590 people
- City population
- 79,538
- Metro
- Houston-The Woodlands-Sugar Land, TX
- Population (ZIP)
- 79,538
- Household income
- $122,241
- Rent vs Own
- Severe rent burden
- 1072.0
Population outlook (Harris County) Hauer SSP2
- Today (2025)
- 5,571,493 people
- By 2030
- 6,089,821 · +9.3%
- By 2040
- 7,142,806 · +28.2%
- By 2050
- 8,185,864 · +46.9%
- By 2075
- 10,574,329 · +89.8%
- By 2100
- 12,109,958 · +117.4%
Race, ethnicity, and origin ACS 2023
- Neighborhood character
- Diverse neighborhood (Simpson 0.70)
- Race & ethnicity
- White 42% Hispanic / Latino 28% Black 21% Two or more races 18% Asian 4%
- Hispanic origin (detail)
- Mexican 20% Puerto Rican 2%
- Common ancestry
- Lithuanian 4% Slovak 1% Italian 1%
- Foreign-born
- 10% · Canada, Vietnam, China
- Languages at home
- 78% English-only · Spanish 17% Other Indo-European 1% German/W. Germanic 1%
Political lean MEDSL · Harris
- 2024 margin
- Lean D (+5.5) · D 52.0% · R 46.4% · Other 1.6%
- 2008→2024 swing
- +3.9pp toward D · 2008: 1.6pp · 2024: 5.5pp
- All cycles
- 2024: D+5.5 2020: D+13.3 2016: D+12.4 2012: D+0.1 2008: D+1.6
Not yet ingested
- Civics
- —
Market trends
- HPI YoY
- ▼ -0.95%
- Current HPI
- 218.0478
- Rent YoY
- ▲ 0.09%
- Metro
- Houston-The Woodlands-Sugar Land, TX
- State GDP YoY
- ▲ 3.95%
- F500 in state
- 110
Industry mix (Fortune 500 HQ in TX)
| Industry | F500 HQs | Revenue |
|---|---|---|
| Energy | 16 | $1,198B |
|
||
| Technology | 5 | $198B |
|
||
| Engineering / Construction | 4 | $72B |
|
||
| Energy Services | 3 | $60B |
|
||
| Utilities | 3 | $41B |
|
||
| Healthcare | 2 | $330B |
|
||
Price history
+194.5% since first listed10 events — show timeline
- 2026-04-28 Pending — HARMLS
- 2026-04-20 Pending — HARMLS
- 2026-04-08 Relisted — HARMLS
- 2026-02-24 Pending — HARMLS
- 2026-02-24 Listing Removed — HARMLS
- 2026-02-19 Listed $250,000 HARMLS
- 2011-08-25 Sold (MLS) — HARMLS
- 2011-06-17 Listing Removed — HARMLS
- 2011-06-08 Listed $84,900 HARMLS
- 2007-07-03 Sold (Public Records) — Public Records
Property tax history
+2.9%/yrLatest (2025): $6,571 · +2.7% YoY. Source: county tax records.
Cash-flow waterfall
monthlySold comps — $/sqft
last 12 mo · ≤1 miLoading sold comps…