 Multi-family
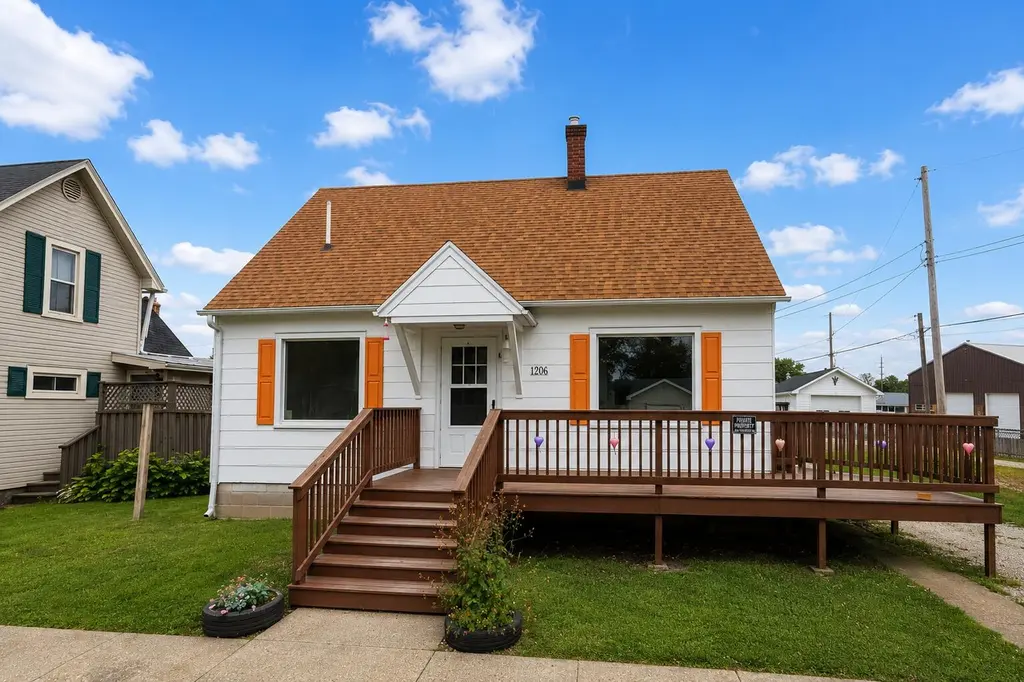
206 S 3rd St · Kentland, IN
Flood risk 1/10 · Minimal
- FEMA flood zone
- X (unshaded)
- Chance of flooding over 30 yrs
- 0.0%
- Est. flood insurance / yr
- $507 – $1,088
Fire risk 1/10 · Minimal
- Est. fire insurance / yr
- $717 – $1,331
Heat risk 3/10 · Minor
- Hot days now (above 103°F)
- 7 days/yr
- Hot days in 30 yrs
- 17 days/yr
Wind risk 2/10 · Minimal
- Chance of severe wind over 30 yrs
- 0.0%
Air-quality risk 2/10 · Minimal
- Unhealthy air days now
- 2 days/yr
- Unhealthy air days in 30 yrs
- 2 days/yr
Risk factors via First Street. Map © Google.
Why this score? — see what drove the B+ grade
The composite is a weighted blend of 9 inputs, each scored 0–100. Each bar is that input's sub-score; the figure is the points it added to the 100-point composite (weight × sub-score).
- Cash flow +30.0/30.0
- DSCR +10.0/10.0
- Appreciation +10.0/10.0
- 1% rule +9.2/10.0
- ARV discount +7.5/15.0
- Livability +3.4/5.0
- Schools +2.8/10.0
- Rent growth +2.5/5.0
- Condition / age +2.5/5.0
$120,000
🖨 Deal sheet (PDF) 📄 Offer letter ✓ Due diligence
Multi-family units
County records classify this as Multi-Family (2-4 Unit). Listing-text estimate: 1 unit. estimate disagrees with records
Listing remarks MLS
Live downstairs and rent the upstairs to make the payment. Immaculate property. Home has 2 bedrooms, kitchen, living room, bath and utility room downstairs. Private entrance apartment upstairs with 2 bedrooms, bath, kitchen and living room. No garage but a lawn shed for supplies. Both apartments pay separate utilities. Upstairs has a window air unit and a gas stove, not a forced air furnace.
Key facts
- Second kitchen
- Ada-accessible bath
- 4,500 sq ft lot
Tags
Property features AI
Finance
- Other: Property contains 2 units (1 two-bedroom unit and 1 three-bedroom unit); Currently vacant
Exterior
- Parking: Driveway; Off-street parking; Gravel parking
- Utilities: Electricity connected; Public water; Public sewer; Natural gas connected
- Home design: One-and-one-half story building; Built in 1938; Property listed as fixer; Accessible features present
- Construction: Shingle roof; Crawl space basement
- Exterior features: Deck; Porch; Rain gutters; Neighborhood view; Shed(s)
Interior
- Kitchen: Electric range; Gas range
- Bedrooms: Two 2-bedroom and 3-bedroom units (total 2 units)
- Flooring: Carpet; Laminate; Hardwood
- Bathrooms: One full bathroom; One three-quarter bathroom
- Heating & cooling: Forced air heating; Natural gas heating; Central air conditioning; Unit control cooling
- Interior features: Laminate counters; Accessible full bathroom; Accessible approach with ramp; Pets allowed
- Laundry & utility: Washer hookup; Electric dryer hookup; Gas dryer hookup; Main level laundry room
Neighborhood map
What this means for you Summary
Snapshot
- This is a 3-bed/1.0-bath multifamily listed at $120k.
Deal economics
- At list price, monthly cash flow is $631 ($8k/yr) — positive.
- The deal already cash-flows at list — no discount required.
- Meets the 1% rule at list price ($2k rent vs $120k).
- Recommended offer: $118k (1.5% below list) — sets the bar for market timing.
Location & tenants
- Location reads 67/100 on livability (#265 in IN) — a middle-class / working-renter tenant base. Strengths: crime A+, cost of living A+, housing A; Watch: amenities F, commute F, employment D-.
- South Newton School Corporation (rural): math 29% / reading 35% proficiency, ranked #219 of 301 in IN (top 73%) — families likely to look elsewhere, expect single-tenant / working-renter base with shorter leases.
- Zoned schools: South Newton Elementary School (math 37% / reading 32%, grade F, #597 of 994 statewide, top 63%, 416 students, 68% FRL); South Newton Middle School (math 22% / reading 32%, grade F, #234 of 330 statewide, top 71%, 204 students, 71% FRL); South Newton Senior High School (math 24% / reading 64%, grade F, #169 of 369 statewide, top 51%, 242 students, 52% FRL).
- Market conditions: 24 active listings in the ZIP; 24 units permitted in Newton County in 2024 (0 in 5+ unit buildings).
Forward outlook
- In year one you build about $13k of equity ($830 loan paydown + $12k appreciation (10.0% local appreciation)).
- Newton County population projected at -12% by 2050 — secular population decline; favor cash flow + early exit over multi-decade hold.
- At projected returns (10.0% appreciation + 3.0% rent growth), your $34k cash investment doubles in ~2 years — after that, you're playing with house money.
- By year 3, paydown + projected appreciation supports a ~$32k cash-out refi (75% LTV) — recoverable capital for the next deal without selling this one.
Negotiation context
- It's been on market 15 days — a 2% lower offer ($118k) is reasonable based on typical stale-listing flexibility.
- 4 sale attempts since 12y ago with the ask held roughly flat each time — persistent listings suggest the price (not the market) is what's stuck; bring a comps-based counter.
- Current owner paid $44k; list at $120k implies a 173% gain — meaningful room to come down on a strong offer.
Risks & watch-outs
- Watch-outs: built in 1938 — expect roof / HVAC / electrical / plumbing capex.
Questions for the listing agent
- Built in 1938 — when were the roof, HVAC, electrical panel, plumbing, and water heater last replaced?
- Is there a deadline driving the sale (1031 exchange, divorce, estate, relocation)? That informs how much negotiation room exists.
- Schools are D-rated, which usually means shorter tenancies and higher turnover. Who's the typical renter profile here, and what's been the actual vacancy rate?
- What's the average days-on-market for RENTAL listings here right now (not sales)? A rising rental-DOM trend means longer vacancies and softer asking-rent achievability than the comps imply.
- What's the recent tenant-quality profile in this submarket — average credit score on applications, eviction rate, late-payment / NSF rate, and stable-employment percentage? A property-management company in the area should have these aggregated.
- How much new apartment / multifamily construction is in the pipeline within 1–3 miles? Heavy new supply (>2% of stock underway) typically softens rents 12–24 months out; light construction supports rent growth.
Investment metrics
- 1% rule
- 1.42% ✓
- Cap rate
- 12.60%
- Cash-on-cash
- 22.53%
- DSCR
- 2.00
- GRM
- 5.9
CMA / ARV
No comps found within radius.
Projected returns pro-forma
10.0% appreciation · 3.0% rent growth · sell at horizon
- IRR
- 41.2%
- Equity multiple
- 4.14×
- Total profit
- $105,495
- Equity at exit
- $108,106
- IRR
- 35.5%
- Equity multiple
- 9.30×
- Total profit
- $278,972
- Equity at exit
- $233,134
Cash invested: $33,600 (down + closing). Projections, not guarantees.
Landlord ↔ Tenant lean methodology
- Overall (STATE)
- 90 Strongly Landlord-Friendly
- State Indiana
- 90 Strongly Landlord-Friendly · R+11
- County
- — inherits STATE
- City
- — inherits STATE
ZIP-level market 47951
- Home prices YoY
- 11.4%
- Active inventory
- 24
- Price-to-rent
- 11.8×
Monthly cashflow live
- Estimated rent
- $1,700 medium interval (Pro) →
- Mortgage (P&I)
- −$629
- Tax from tax record
- −$33 /mo · $393/yr
- Insurance
- −$50
- HOA
- −$0
- Vacancy / Maint / Mgmt
- −$357
- Net cashflow
- $631
Break-even live
Sensitivity live
| Price | -10% $699 | -5% $665 | +0% $631 | +5% $597 | +10% $563 |
|---|---|---|---|---|---|
| Rent | -10% $497 | -5% $564 | +0% $631 | +5% $698 | +10% $765 |
| Rate | -1.0pp $691 | -0.5pp $661 | base $631 | +0.5pp $600 | +1.0pp $568 |
2-unit breakdown (identical units grouped — click to expand)
| Units | Beds | Baths | Est. rent |
|---|---|---|---|
| 2× units | 2 | 1 | $1,700 |
| #1 | 2 | 1 | $850 |
| #2 | 2 | 1 | $850 |
| Total (2 units) | $1,700 | ||
UW: 25.0% down · 7.5% · 30yr · 1.5% tax · 5.0% vac · 8.0% maint · 8.0% mgmt
Financing live
Cash to close
- Down payment
- $30,000
- Closing costs
- $3,600
- Reserves months
- —
- Total cash needed
- —
Loan-product check · same deal, 3 products live
Conventional
25% down · 7.5% · 30yr
- Down + closing
- —
- Monthly P&I
- —
- Monthly cashflow
- —
- DSCR
- —
- Eligible?
- —
Personal DTI + credit; lowest rate.
DSCR
20% down · 8.5% · 30yr
- Down + closing
- —
- Monthly P&I
- —
- Monthly cashflow
- —
- DSCR
- —
- Eligible?
- —
No personal income docs; deal must DSCR.
Hard money
10% down · 12.0% · 12mo
- Down + closing
- —
- Monthly P&I
- —
- Monthly cashflow
- —
- DSCR
- —
- Eligible?
- —
Short-term bridge; refi at stabilization.
Listing history 12 events
-
2026-06-21days on market $120,000 Active 15 DOM
-
2026-06-21days on market $120,000 Active 14 DOM
-
2026-06-18days on market $120,000 Active 12 DOM
-
2026-06-17days on market $120,000 Active 11 DOM
-
2026-06-16days on market $120,000 Active 10 DOM
-
2026-06-15days on market $120,000 Active 9 DOM
-
2026-06-13days on market $120,000 Active 7 DOM
-
2026-06-12days on market $120,000 Active 6 DOM
-
2026-06-09days on market $120,000 Active 3 DOM
-
2026-06-08days on market $120,000 Active 2 DOM
-
2026-06-07remarks 699-char remark
-
2026-06-07$120,000 Active 1 DOM
ⓘ Source: listings_history table (triggers on properties + properties_extension) + one-shot
backfill from property_details.listing_events for pre-trigger history.
Tax reassessment forecast IN · Partial reset (capped growth)
- Current annual tax
- $393 · $33/mo
- Projected year-2 tax
- $706 · $59/mo
- Expected delta
- +$314/yr (+$26/mo · 79.8%)
ⓘ Screening estimate from a state-policy table — verify with the county assessor before closing.
Climate risk First Street
- Flood 1/10 Low FEMA zone X (unshaded) · 0% chance over 30 yrs
- Wildfire 1/10 Low
- Heat 3/10 Moderate 7 d/yr ≥103°F today · 17 d/yr by 30 yrs out
- Wind 2/10 Low 0% chance of damaging wind over 30 yrs
- Air quality 2/10 Low 2 unhealthy d/yr today · 2 by 30 yrs out
Nearby sold comps map
Loading sold comps map…
Walkable amenities ~0.75 mi
Loading nearby amenities…
Taxation est. · year 1
- Rental income
- $20,400
- − Mortgage interest
- −$6,722
- − Property taxes
- −$393
- − Insurance
- −$600
- − Repairs & maintenance
- −$1,632
- − Management
- −$1,632
- − Depreciation
- −$3,491
- Taxable income
- $5,930
- Est. tax owed @ 24.0%
- −$1,423
- After-tax cash flow
- $6,148/yr
For passive investors: Depreciation is non-cash, so a rental often shows a tax loss while cash-flowing — sheltering income. Rental losses are passive: they offset passive income freely, and up to $25,000/yr can offset ordinary (W-2) income if you actively participate and your MAGI is under $100k (phasing out to $0 by $150k); unused losses carry forward. On sale, claimed depreciation is recaptured at up to 25%, and gains may owe capital-gains tax (a 1031 exchange can defer both). Figures are a year-1 estimate at your 24.0% rate — not tax advice; consult a CPA.
Schools (NCES district)
- District
- South Newton School Corporation
- NCES district ID
- 1810470
- Math proficiency
- 29% ▼ -18.00%
- Reading proficiency
- 35% ▼ -14.00%
- Median HH income
- $46,624
- Composite
- 27.52/100
- National rank
- #6952
- State rank
- #219 of 301 in IN
Livability — Kentland
- Score
- 67/100
- State rank
- #265
- US rank
- #11108
Category grades
Schools grade is shown separately in the Schools card above.
Census & demographics
- Census place
- Kentland, IN
- City population
- 2,246
- Population (ZIP)
- 2,246
Population outlook (Newton County) Hauer SSP2
- Today (2025)
- 13,726 people
- By 2030
- 13,448 · -2.0%
- By 2040
- 12,771 · -7.0%
- By 2050
- 12,104 · -11.8%
- By 2075
- 11,059 · -19.4%
- By 2100
- 9,813 · -28.5%
Race, ethnicity, and origin ACS 2023
- Neighborhood character
- Predominantly White (83%)
- Race & ethnicity
- White 83% Hispanic / Latino 8% Black 6% Two or more races 6%
- Hispanic origin (detail)
- Mexican 6%
- Common ancestry
- Lithuanian 3% Iranian 2% Romanian 1%
- Foreign-born
- 3% · Canada
- Languages at home
- 96% English-only · Spanish 4%
Political lean MEDSL · Newton
- 2024 margin
- Solid R (+57.0) · D 20.8% · R 77.7% · Other 1.5%
- 2008→2024 swing
- -45.8pp toward R · 2008: -11.2pp · 2024: -57.0pp
- All cycles
- 2024: R+57.0 2020: R+52.1 2016: R+46.1 2012: R+19.1 2008: R+11.2
Not yet ingested
- Civics
- —
Market trends
- HPI YoY
- ▲ 26.78%
- Current HPI
- 262.4146
- Rent YoY
- —
- Metro
- —
- State GDP YoY
- ▲ 2.90%
- F500 in state
- 18
Industry mix (Fortune 500 HQ in IN)
| Industry | F500 HQs | Revenue |
|---|---|---|
| Industrial Machinery | 2 | $37B |
|
||
| Healthcare | 1 | $177B |
|
||
| Pharmaceuticals | 1 | $45B |
|
||
| Metals / Steel | 1 | $18B |
|
||
| Agriculture | 1 | $17B |
|
||
| Packaging | 1 | $12B |
|
||
Price history
+161.4% since first listed8 events — show timeline
- 2026-06-06 Listed $120,000 NIRA MLS as Distributed by MLS Grid
- 2015-07-08 Listing Removed — NIRA MLS as Distributed by MLS Grid
- 2015-06-16 Sold (Public Records) $44,000 Public Records
- 2015-06-15 Sold (MLS) $44,000 NIRA MLS as Distributed by MLS Grid
- 2015-01-08 Listing Removed — NIRA MLS as Distributed by MLS Grid
- 2014-12-12 Listed $45,900 NIRA MLS as Distributed by MLS Grid
- 2014-07-07 Listed $59,900 NIRA MLS as Distributed by MLS Grid
- 2014-07-07 Listed $45,900 NIRA MLS as Distributed by MLS Grid
Property tax history
+6.6%/yrLatest (2024): $393 · +0.0% YoY. Source: county tax records.
Cash-flow waterfall
monthlySold comps — $/sqft
last 12 mo · ≤1 miLoading sold comps…