2248 Maclaren Dr Plan · Milford, MI
Flood risk No data
- FEMA flood zone
- —
- Chance of flooding over 30 yrs
- —
- Est. flood insurance / yr
- —
Fire risk No data
- Est. fire insurance / yr
- —
Heat risk No data
- Hot days now (above threshold)
- —
- Hot days in 30 yrs
- —
Wind risk No data
- Chance of severe wind over 30 yrs
- —
Air-quality risk No data
- Unhealthy air days now
- —
- Unhealthy air days in 30 yrs
- —
Risk factors via First Street. Map © Google.
Why this score? — see what drove the C grade
The composite is a weighted blend of 9 inputs, each scored 0–100. Each bar is that input's sub-score; the figure is the points it added to the 100-point composite (weight × sub-score).
- Cash flow +22.8/30.0
- ARV discount +7.5/15.0
- DSCR +7.3/10.0
- 1% rule +6.0/10.0
- Condition / age +4.8/5.0
- Schools +4.4/10.0
- Livability +4.4/5.0
- Rent growth +2.5/5.0
- Appreciation +0.0/10.0
$94,995
🖨 Deal sheet (PDF) 📄 Offer letter ✓ Due diligence
Listing remarks MLS
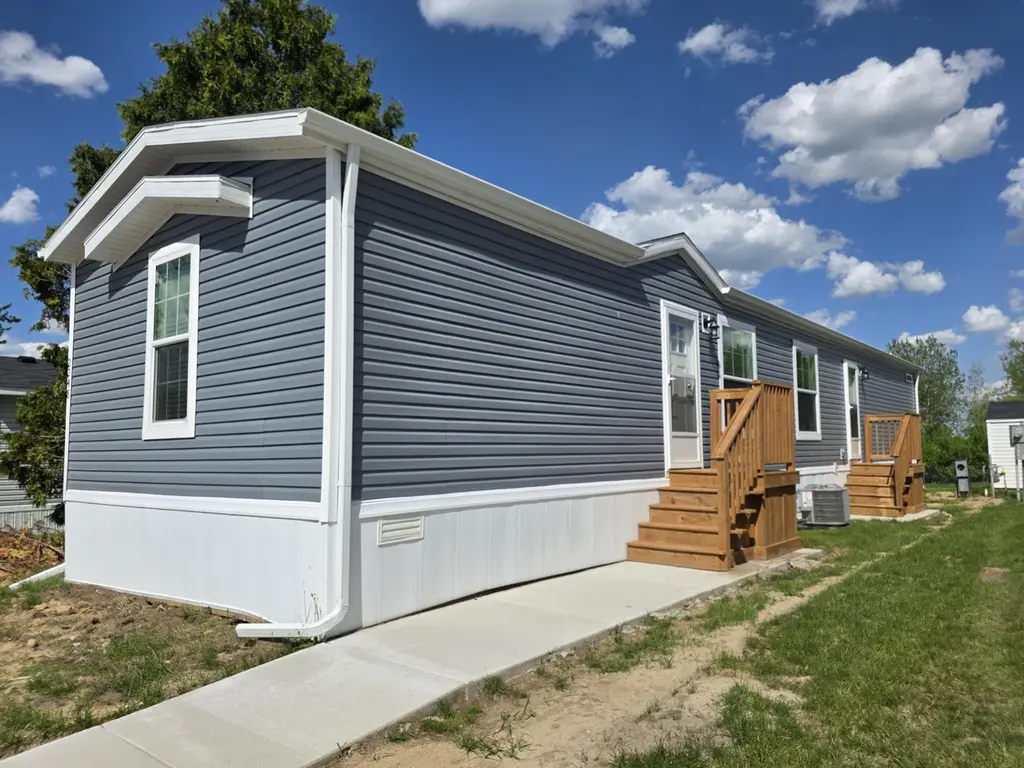
This beautiful, move-in-ready home features modern finishes and an open floor plan perfect for comfortable living. Enjoy a spacious kitchen with a large center island, sleek black appliances, and ample cabinet storage, including a pantry. The home boasts a generously sized living area and a bright primary bedroom with a walk-in closet. The bathroom includes a full-size tub and updated fixtures. With fresh neutral tones and plenty of natural light, this home offers a clean, contemporary feel. Schedule your showing today homes like this don t last long!
Key facts
- Black appliances
- Open floor plan
- Large center island
Tags
Neighborhood map
What this means for you Summary
Snapshot
- This is a 2-bed/2.0-bath manufactured listed at $95k. Condition is rated excellent.
Deal economics
- At list price, monthly cash flow is $166 ($2k/yr) — positive.
- The deal already cash-flows at list — no discount required.
- Meets the 1% rule at list price ($1k rent vs $95k).
- Recommended offer: $84k (12.0% below list) — sets the bar for market timing.
- Cap rate 8.4% vs local median 1.7% in Milford — top-decile yield for the area; either an underpriced asset or a hidden risk that comps aren't pricing in. Stress-test before assuming the spread holds.
Location & tenants
- Location reads 87/100 on livability (#17 in MI, #275 nationally) — a professional / high-income tenant draw. Strengths: crime A+, amenities A+, employment A+; Watch: commute F.
- Huron Valley Schools (suburban): math 42% / reading 56% proficiency, ranked #87 of 540 in MI (top 16%) — families likely to look elsewhere, expect single-tenant / working-renter base with shorter leases.
- Market conditions: 68 active listings in the ZIP; 2 comparable units currently listed for rent nearby; 2,614 units permitted in Oakland County in 2024 (721 in 5+ unit buildings).
Forward outlook
- Local home prices are declining (-3.0%/yr); year-one equity from $657 of loan paydown is wiped out by about $3k of value loss. Plan a longer hold.
- Oakland County population projected at +10% by 2050 — modest demand growth; plan on rents tracking national, not racing it.
Negotiation context
- It's been on market 399 days — a 12% lower offer ($84k) is reasonable based on typical stale-listing flexibility.
Questions for the listing agent
- It's been on market 399 days. Have you received any prior offers? Is the seller open to a 12% concession, seller financing, or rate buy-down credit?
- Why hasn't it sold? Are there any deal-killer items the seller is aware of (foundation, flood, title, zoning, code violations)?
- Is there a deadline driving the sale (1031 exchange, divorce, estate, relocation)? That informs how much negotiation room exists.
- Schools are B-rated — typically a magnet for longer-tenancy family renters. What's the average tenant stay here, and is there a school-zone premium baked into asking?
- What's the average days-on-market for RENTAL listings here right now (not sales)? A rising rental-DOM trend means longer vacancies and softer asking-rent achievability than the comps imply.
- What's the recent tenant-quality profile in this submarket — average credit score on applications, eviction rate, late-payment / NSF rate, and stable-employment percentage? A property-management company in the area should have these aggregated.
- How much new for-sale + rental construction is in the pipeline within 1–3 miles? Heavy new supply typically softens prices + rents 12–24 months out; constrained supply supports both.
Investment metrics
- 1% rule
- 1.10% ✓
- Cap rate
- 8.39%
- Cash-on-cash
- 7.48%
- DSCR
- 1.33
- GRM
- 7.6
CMA / ARV
No comps found within radius.
Projected returns pro-forma
-3.0% appreciation · 3.0% rent growth · sell at horizon
- IRR
- -4.9%
- Equity multiple
- 0.82×
- Total profit
- $-4,816
- Equity at exit
- $14,164
- IRR
- 4.8%
- Equity multiple
- 1.36×
- Total profit
- $9,469
- Equity at exit
- $8,213
Cash invested: $26,599 (down + closing). Projections, not guarantees.
Landlord ↔ Tenant lean methodology
- Overall (STATE)
- 62 Landlord-Friendly
- State Michigan
- 62 Landlord-Friendly · EVEN
- County
- — inherits STATE
- City
- — inherits STATE
ZIP-level market 48357
- Active inventory
- 68
- Price-to-rent
- 7.6×
Monthly cashflow live
- Estimated rent
- $1,041 medium interval (Pro) →
- Mortgage (P&I)
- −$498
- Tax est. 1.5%
- −$119 /mo · $1,425/yr
- Insurance
- −$40
- HOA
- −$0
- Vacancy / Maint / Mgmt
- −$219
- Net cashflow
- $166
Break-even live
Sensitivity live
| Price | -10% $231 | -5% $199 | +0% $166 | +5% $133 | +10% $100 |
|---|---|---|---|---|---|
| Rent | -10% $84 | -5% $125 | +0% $166 | +5% $207 | +10% $248 |
| Rate | -1.0pp $214 | -0.5pp $190 | base $166 | +0.5pp $141 | +1.0pp $116 |
UW: 25.0% down · 7.5% · 30yr · 1.5% tax · 5.0% vac · 8.0% maint · 8.0% mgmt
Financing live
Cash to close
- Down payment
- $23,749
- Closing costs
- $2,850
- Reserves months
- —
- Total cash needed
- —
Loan-product check · same deal, 3 products live
Conventional
25% down · 7.5% · 30yr
- Down + closing
- —
- Monthly P&I
- —
- Monthly cashflow
- —
- DSCR
- —
- Eligible?
- —
Personal DTI + credit; lowest rate.
DSCR
20% down · 8.5% · 30yr
- Down + closing
- —
- Monthly P&I
- —
- Monthly cashflow
- —
- DSCR
- —
- Eligible?
- —
No personal income docs; deal must DSCR.
Hard money
10% down · 12.0% · 12mo
- Down + closing
- —
- Monthly P&I
- —
- Monthly cashflow
- —
- DSCR
- —
- Eligible?
- —
Short-term bridge; refi at stabilization.
Rent comps 2 comps
| Address | Beds | Baths | Sqft | Rent | $/sqft | DOM | Units | Dist |
|---|---|---|---|---|---|---|---|---|
| 2377 N Milford Rd Highland Charter Twp, MI | 2.0–3.0 | 2.0 | 1120 | $999 | $0.89 | 0d | 1 | 0.21mi |
| 1200 Highland Rd Highland, MI | 3.0 | 2.0 | 1024 | $1,279 | $1.25 | 0d | 1 | 1.31mi |
Listing history 16 events
-
2026-06-21days on market $94,995 Active 399 DOM
-
2026-06-18days on market $94,995 Active 396 DOM
-
2026-06-17days on market $94,995 Active 395 DOM
-
2026-06-16days on market $94,995 Active 394 DOM
-
2026-06-15days on market $94,995 Active 393 DOM
-
2026-06-13days on market $94,995 Active 391 DOM
-
2026-06-13days on market $94,995 Active 390 DOM
-
2026-06-09days on market $94,995 Active 387 DOM
-
2026-06-08days on market $94,995 Active 386 DOM
-
2026-06-07days on market $94,995 Active 385 DOM
-
2026-06-04days on market $94,995 Active 382 DOM
-
2026-06-03days on market $94,995 Active 381 DOM
-
2026-06-02days on market $94,995 Active 380 DOM
-
2026-06-01days on market $94,995 Active 379 DOM
-
2026-05-31days on market $94,995 Active 378 DOM
-
2025-05-18$94,995 Active 557-char remark
Show marketing remark (557 chars)
This beautiful, move-in-ready home features modern finishes and an open floor plan perfect for comfortable living. Enjoy a spacious kitchen with a large center island, sleek black appliances, and ample cabinet storage, including a pantry. The home boasts a generously sized living area and a bright primary bedroom with a walk-in closet. The bathroom includes a full-size tub and updated fixtures. With fresh neutral tones and plenty of natural light, this home offers a clean, contemporary feel. Schedule your showing today homes like this don t last long!
ⓘ Source: listings_history table (triggers on properties + properties_extension) + one-shot
backfill from property_details.listing_events for pre-trigger history.
Nearby sold comps map
Loading sold comps map…
Walkable amenities ~0.75 mi
Loading nearby amenities…
Taxation est. · year 1
- Rental income
- $12,491
- − Mortgage interest
- −$5,321
- − Property taxes
- −$1,425
- − Insurance
- −$475
- − Repairs & maintenance
- −$999
- − Management
- −$999
- − Depreciation
- −$2,763
- Taxable income
- $508
- Est. tax owed @ 24.0%
- −$122
- After-tax cash flow
- $1,868/yr
For passive investors: Depreciation is non-cash, so a rental often shows a tax loss while cash-flowing — sheltering income. Rental losses are passive: they offset passive income freely, and up to $25,000/yr can offset ordinary (W-2) income if you actively participate and your MAGI is under $100k (phasing out to $0 by $150k); unused losses carry forward. On sale, claimed depreciation is recaptured at up to 25%, and gains may owe capital-gains tax (a 1031 exchange can defer both). Figures are a year-1 estimate at your 24.0% rate — not tax advice; consult a CPA.
Condition & rehab AI · 7 photos
This move-in-ready manufactured home features modern finishes and an open floor plan, with excellent condition and minimal maintenance required.
Value-add opportunities
- Both Paint interior walls — Fresh neutral tones enhance curb appeal and interior ambiance
- Both Install smart home devices — Modernizes home and adds value for tech-savvy buyers
- Both Add outdoor lighting — Enhances curb appeal and safety
Renovation cost estimate screening
Value-add ROI direction
- Both Paint interior walls — Fresh neutral tones enhance curb appeal and interior ambiance ↑
- Both Install smart home devices — Modernizes home and adds value for tech-savvy buyers ↑
- Both Add outdoor lighting — Enhances curb appeal and safety ↑
ⓘ Cost ranges are severity-bucket heuristics (US national rule-of-thumb). Get contractor quotes + a written scope before underwriting a rehab budget.
Schools (NCES district)
- District
- Huron Valley Schools
- NCES district ID
- 2618990
- Math proficiency
- 42% ▼ -8.00%
- Reading proficiency
- 56% ▼ -3.00%
- Median HH income
- $76,011
- Composite
- 44.39/100
- National rank
- #2815
- State rank
- #87 of 540 in MI
Livability — Milford
- Score
- 87/100
- State rank
- #17
- US rank
- #275
Category grades
Schools grade is shown separately in the Schools card above.
Census & demographics
- Population (ZIP)
- 8,523
Population outlook (Oakland County) Hauer SSP2
- Today (2025)
- 1,335,747 people
- By 2030
- 1,375,100 · +2.9%
- By 2040
- 1,435,385 · +7.5%
- By 2050
- 1,469,250 · +10.0%
- By 2075
- 1,531,946 · +14.7%
- By 2100
- 1,450,485 · +8.6%
Race, ethnicity, and origin ACS 2023
- Neighborhood character
- Predominantly White (93%)
- Race & ethnicity
- White 93% Two or more races 4% Black 1%
- Common ancestry
- Romanian 11% Lithuanian 7% Slovak 4%
- Foreign-born
- 2% · Canada
Political lean MEDSL · Oakland
- 2024 margin
- D (+10.6) · D 54.4% · R 43.8% · Other 1.9%
- 2008→2024 swing
- -3.9pp toward R · 2008: 14.5pp · 2024: 10.6pp
- All cycles
- 2024: D+10.6 2020: D+14.1 2016: D+8.1 2012: D+8.1 2008: D+14.5
Not yet ingested
- Civics
- —
Market trends
- HPI YoY
- ▼ -291.58%
- Current HPI
- 212.404
- Rent YoY
- —
- Metro
- —
- State GDP YoY
- ▲ 1.37%
- F500 in state
- 28
Industry mix (Fortune 500 HQ in MI)
| Industry | F500 HQs | Revenue |
|---|---|---|
| Automotive Parts | 3 | $48B |
|
||
| Automotive | 2 | $372B |
|
||
| Chemicals | 1 | $45B |
|
||
| Automotive Retail | 1 | $29B |
|
||
| Healthcare / Medical Devices | 1 | $23B |
|
||
| Automotive Technology | 1 | $20B |
|
||
Price history
1 event — show timeline
- 2025-05-18 Listed $94,995 Zillow
Cash-flow waterfall
monthlySold comps — $/sqft
last 12 mo · ≤1 miLoading sold comps…