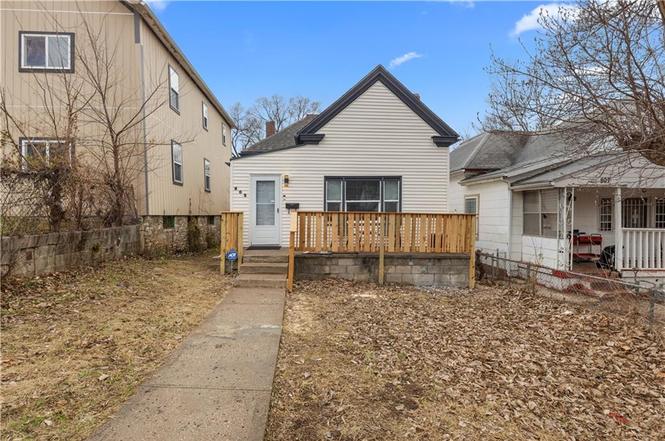
805 Lafayette Ave · Kansas City, KS
Flood risk 1/10 · Minimal
- FEMA flood zone
- X (unshaded)
- Chance of flooding over 30 yrs
- 0.0%
- Est. flood insurance / yr
- $473 – $860
Fire risk 1/10 · Minimal
- Est. fire insurance / yr
- $1,154 – $2,142
Heat risk 3/10 · Minor
- Hot days now (above 107°F)
- 7 days/yr
- Hot days in 30 yrs
- 15 days/yr
Wind risk 2/10 · Minimal
- Chance of severe wind over 30 yrs
- —
Air-quality risk 3/10 · Minor
- Unhealthy air days now
- 2 days/yr
- Unhealthy air days in 30 yrs
- 3 days/yr
Risk factors via First Street. Map © Google.
Why this score? — see what drove the D+ grade
The composite is a weighted blend of 9 inputs, each scored 0–100. Each bar is that input's sub-score; the figure is the points it added to the 100-point composite (weight × sub-score).
- Cash flow +11.7/30.0
- Appreciation +10.0/10.0
- ARV discount +7.5/15.0
- 1% rule +3.6/10.0
- Livability +3.6/5.0
- DSCR +3.5/10.0
- Rent growth +2.5/5.0
- Condition / age +2.5/5.0
- Schools +0.9/10.0
$142,000
🖨 Deal sheet (PDF) 📄 Offer letter ✓ Due diligence
Listing remarks
Welcome home to 805 Lafayette Avenue, Kansas City, Kansas—a beautifully renovated 3-bedroom, 1-bath home tucked away on a quiet street that blends classic charm with modern updates. Inside, you’ll find original hardwood floors that add warmth and character throughout the living spaces, complemented by fresh interior paint and abundant natural light. The updated kitchen features brand-new granite countertops, new tile backsplash, and comes fully equipped with a gas stove, refrigerator, microwave, washer, and dryer, making this home truly move-in ready. The bathroom has been thoughtfully renovated with new tile and fresh finishes. Major system updates include a newer roof, central
Key facts
- New patio
- Fresh paint
- Natural light
Tags
Property features AI
Finance
- Other: Living area reported as 1,152 (source: public records)
- HOA & community: No association fees
Exterior
- Parking: Garage faces front; 1-car garage
- Utilities: City/public water (verify); Sewer: unknown
- Home design: Single-family residence; Bungalow floor plan; Residential property
- Construction: Stone and frame construction; Composition roof; Home age estimated 76–100 years
- Exterior features: Not in a flood plain; Lot approximately 3,485 square feet
Interior
- Bedrooms: 3 bedrooms
- Bathrooms: 1 full bathroom
- Heating & cooling: Forced air heating; Electric cooling
- Interior features: Partial basement
Neighborhood map
What this means for you Summary
Snapshot
- This is a 2-bed/1.0-bath single-family listed at $142k.
Deal economics
- At list price, monthly cash flow is $-40 ($-484/yr) — negative.
- To cash-flow at today's rent, offer at most $135k (5.0% below list).
- To meet the 1% rule (rent ≥ 1% of price), the offer needs to be $122k (13.9% below list).
- Recommended offer: $122k (13.9% below list) — sets the bar for 1% rule.
- Cap rate 6.0% vs local median 4.8% in Kansas City — meaningfully above typical; check what's discounted (condition, days-on-market, listing class) to confirm the premium yield is real.
Location & tenants
- Location reads 72/100 on livability (#103 in KS) — a middle-class / working-renter tenant base. Strengths: commute A+, cost of living A+, housing A+; Watch: schools F, crime F, employment D-.
- Kansas City (urban): math 8% / reading 15% proficiency, ranked #169 of 169 in KS (top 100%) — low school quality limits family demand, transient renter base, plan for 1-2y turnover; 81% free/reduced lunch — lower-income household profile, screen leases tightly.
- Market conditions: 42 active listings in the ZIP; lower-income renter base — watch delinquency; 369 units permitted in Wyandotte County in 2024 (236 in 5+ unit buildings).
- This rent runs 34% of the median local income ($43k/yr) — at the standard rent-burdened threshold; future hikes will face affordability resistance.
Forward outlook
- In year one you build about $15k of equity ($982 loan paydown + $14k appreciation (10.0% local appreciation)).
- Wyandotte County population projected at +17% by 2050 — long-run rental-demand tailwind backs the buy-and-hold thesis.
- At projected returns (10.0% appreciation + 3.0% rent growth), your $40k cash investment doubles in ~3 years — after that, you're playing with house money.
- By year 3, paydown + projected appreciation supports a ~$38k cash-out refi (75% LTV) — recoverable capital for the next deal without selling this one.
Negotiation context
- It's been on market 138 days — a 12% lower offer ($125k) is reasonable based on typical stale-listing flexibility.
- 2 sale attempts; this cycle's ask has dropped $11k (7%) from the opening price — seller is motivated, your offer sets the floor, not the list.
- Current owner paid $9k; list at $142k implies a 1498% gain — meaningful room to come down on a strong offer.
Risks & watch-outs
- Watch-outs: built in 1935 — expect roof / HVAC / electrical / plumbing capex.
Questions for the listing agent
- What do current leases actually rent for vs. the listed asking? Can we see a recent rent roll and the last 12 months of T-12 income?
- It's been on market 138 days. Have you received any prior offers? Is the seller open to a 14% concession, seller financing, or rate buy-down credit?
- Built in 1935 — when were the roof, HVAC, electrical panel, plumbing, and water heater last replaced?
- Why hasn't it sold? Are there any deal-killer items the seller is aware of (foundation, flood, title, zoning, code violations)?
- Is there a deadline driving the sale (1031 exchange, divorce, estate, relocation)? That informs how much negotiation room exists.
- Schools are F-rated, which usually means shorter tenancies and higher turnover. Who's the typical renter profile here, and what's been the actual vacancy rate?
- Crime grade is F in this area — have there been break-ins, vandalism, or insurance claims at this property in the last 3 years? What carrier currently insures it and at what premium?
- The area grade is low — what's the realistic commute time and amenity access for the typical tenant pool here? Any planned neighborhood developments (good or bad) we should know about?
- What's the average days-on-market for RENTAL listings here right now (not sales)? A rising rental-DOM trend means longer vacancies and softer asking-rent achievability than the comps imply.
- What's the recent tenant-quality profile in this submarket — average credit score on applications, eviction rate, late-payment / NSF rate, and stable-employment percentage? A property-management company in the area should have these aggregated.
- How much new for-sale + rental construction is in the pipeline within 1–3 miles? Heavy new supply typically softens prices + rents 12–24 months out; constrained supply supports both.
Investment metrics
- 1% rule
- 0.86% ✗
- Cap rate
- 5.95%
- Cash-on-cash
- -1.22%
- DSCR
- 0.95
- GRM
- 9.7
CMA / ARV
No comps found within radius.
Projected returns pro-forma
10.0% appreciation · 3.0% rent growth · sell at horizon
- IRR
- 23.4%
- Equity multiple
- 2.88×
- Total profit
- $74,802
- Equity at exit
- $127,925
- IRR
- 20.9%
- Equity multiple
- 6.59×
- Total profit
- $222,367
- Equity at exit
- $275,875
Cash invested: $39,760 (down + closing). Projections, not guarantees.
Landlord ↔ Tenant lean methodology
- Overall (STATE)
- 83 Strongly Landlord-Friendly
- State Kansas
- 83 Strongly Landlord-Friendly · R+10
- County
- — inherits STATE
- City
- — inherits STATE
ZIP-level market 66101
- Home prices YoY
- 20.4%
- Active inventory
- 42
- Price-to-rent
- 9.7×
Monthly cashflow live
- Estimated rent
- $1,222 medium interval (Pro) →
- Mortgage (P&I)
- −$745
- Tax from tax record
- −$202 /mo · $2,425/yr
- Insurance
- −$59
- HOA
- −$0
- Vacancy / Maint / Mgmt
- −$257
- Net cashflow
- $-40
Break-even live
Sensitivity live
| Price | -10% $40 | -5% $0 | +0% $-40 | +5% $-81 | +10% $-121 |
|---|---|---|---|---|---|
| Rent | -10% $-137 | -5% $-89 | +0% $-40 | +5% $8 | +10% $56 |
| Rate | -1.0pp $31 | -0.5pp $-4 | base $-40 | +0.5pp $-77 | +1.0pp $-115 |
UW: 25.0% down · 7.5% · 30yr · 1.5% tax · 5.0% vac · 8.0% maint · 8.0% mgmt
Financing live
Cash to close
- Down payment
- $35,500
- Closing costs
- $4,260
- Reserves months
- —
- Total cash needed
- —
Loan-product check · same deal, 3 products live
Conventional
25% down · 7.5% · 30yr
- Down + closing
- —
- Monthly P&I
- —
- Monthly cashflow
- —
- DSCR
- —
- Eligible?
- —
Personal DTI + credit; lowest rate.
DSCR
20% down · 8.5% · 30yr
- Down + closing
- —
- Monthly P&I
- —
- Monthly cashflow
- —
- DSCR
- —
- Eligible?
- —
No personal income docs; deal must DSCR.
Hard money
10% down · 12.0% · 12mo
- Down + closing
- —
- Monthly P&I
- —
- Monthly cashflow
- —
- DSCR
- —
- Eligible?
- —
Short-term bridge; refi at stabilization.
Listing history 22 events
-
2026-06-21days on market $142,000 Active 138 DOM
-
2026-06-18days on market $142,000 Active 135 DOM
-
2026-06-17days on market $142,000 Active 134 DOM
-
2026-06-16days on market $142,000 Active 133 DOM
-
2026-06-15days on market $142,000 Active 132 DOM
-
2026-06-13days on market $142,000 Active 130 DOM
-
2026-06-13days on market $142,000 Active 129 DOM
-
2026-06-09days on market $142,000 Active 126 DOM
-
2026-06-08days on market $142,000 Active 125 DOM
-
2026-06-07days on market $142,000 Active 124 DOM
-
2026-06-05days on market $142,000 Active 121 DOM
-
2026-06-03days on market $142,000 Active 120 DOM
-
2026-06-02days on market $142,000 Active 119 DOM
-
2026-06-01days on market $142,000 Active 118 DOM
-
2026-05-31days on market $142,000 Active 117 DOM
-
2026-05-22price $142,000
-
2026-04-29status Active
-
2026-04-16status Pending
-
2026-03-02price $149,000
-
2026-01-21$153,000 Active
-
2020-02-12soldstatus $8,888
-
2019-11-27soldstatus $2,953
ⓘ Source: listings_history table (triggers on properties + properties_extension) + one-shot
backfill from property_details.listing_events for pre-trigger history.
Tax reassessment forecast KS · Resets to sale price
- Current annual tax
- $2,425 · $202/mo
- Projected year-2 tax
- $2,425 · $202/mo
- Expected delta
- $0/yr ($0/mo · 0.0%)
ⓘ Screening estimate from a state-policy table — verify with the county assessor before closing.
Climate risk First Street
- Flood 1/10 Low FEMA zone X (unshaded) · 0% chance over 30 yrs
- Wildfire 1/10 Low
- Heat 3/10 Moderate 7 d/yr ≥107°F today · 15 d/yr by 30 yrs out
- Wind 2/10 Low
- Air quality 3/10 Moderate 2 unhealthy d/yr today · 3 by 30 yrs out
Nearby sold comps map
Loading sold comps map…
Walkable amenities ~0.75 mi
Loading nearby amenities…
Taxation est. · year 1
- Rental income
- $14,667
- − Mortgage interest
- −$7,954
- − Property taxes
- −$2,425
- − Insurance
- −$710
- − Repairs & maintenance
- −$1,173
- − Management
- −$1,173
- − Depreciation
- −$4,131
- Taxable loss
- −$2,900
- Est. tax savings @ 24.0%
- +$696
- After-tax cash flow
- $212/yr
For passive investors: Depreciation is non-cash, so a rental often shows a tax loss while cash-flowing — sheltering income. Rental losses are passive: they offset passive income freely, and up to $25,000/yr can offset ordinary (W-2) income if you actively participate and your MAGI is under $100k (phasing out to $0 by $150k); unused losses carry forward. On sale, claimed depreciation is recaptured at up to 25%, and gains may owe capital-gains tax (a 1031 exchange can defer both). Figures are a year-1 estimate at your 24.0% rate — not tax advice; consult a CPA.
Schools (NCES district)
- District
- Kansas City
- NCES district ID
- 2007950
- Math proficiency
- 8% ▼ -10.00%
- Reading proficiency
- 15% ▼ -4.00%
- Median HH income
- $34,774
- Composite
- 9.38/100
- National rank
- #9856
- State rank
- #169 of 169 in KS
Livability — Kansas City
- Score
- 72/100
- State rank
- #103
- US rank
- #6054
Category grades
Schools grade is shown separately in the Schools card above.
Census & demographics
- Census place
- Kansas City, KS
- County
- Wyandotte County · 130,206 people
- City population
- 130,206
- Metro
- Kansas City, MO-KS
- Population (ZIP)
- 12,556
- Household income
- $42,551
- Rent vs Own
- Severe rent burden
- 457.0
Population outlook (Wyandotte County) Hauer SSP2
- Today (2025)
- 177,063 people
- By 2030
- 183,212 · +3.5%
- By 2040
- 195,697 · +10.5%
- By 2050
- 207,897 · +17.4%
- By 2075
- 236,169 · +33.4%
- By 2100
- 255,790 · +44.5%
Race, ethnicity, and origin ACS 2023
- Neighborhood character
- Diverse neighborhood (Simpson 0.66)
- Race & ethnicity
- Hispanic / Latino 47% Black 30% White 16% Two or more races 10% Asian 4% Native American 2%
- Hispanic origin (detail)
- Mexican 40%
- Common ancestry
- Romanian 1% Lithuanian 1% Slovak 1%
- Foreign-born
- 29% · Canada, India
- Languages at home
- 53% English-only · Spanish 39% Other Asian/Pacific 2%
Political lean MEDSL · Wyandotte
- 2024 margin
- Strong D (+23.9) · D 61.1% · R 37.3% · Other 1.6%
- 2008→2024 swing
- -17.0pp toward R · 2008: 40.9pp · 2024: 23.9pp
- All cycles
- 2024: D+23.9 2020: D+30.9 2016: D+29.1 2012: D+36.4 2008: D+40.9
Not yet ingested
- Civics
- —
Market trends
- HPI YoY
- ▲ 77.98%
- Current HPI
- 460.4303
- Rent YoY
- —
- Metro
- Kansas City, MO-KS
- State GDP YoY
- —
- F500 in state
- 0
Price history
+4708.7% since first listed7 events — show timeline
- 2026-05-22 Price Changed $142,000 Heartland MLS as Distributed by MLS Grid
- 2026-04-29 Relisted — Heartland MLS as Distributed by MLS Grid
- 2026-04-16 Pending — Heartland MLS as Distributed by MLS Grid
- 2026-03-02 Price Changed $149,000 Heartland MLS as Distributed by MLS Grid
- 2026-01-21 Listed $153,000 Heartland MLS as Distributed by MLS Grid
- 2020-02-12 Sold (Public Records) $8,888 Public Records
- 2019-11-27 Sold (Public Records) $2,953 Public Records
Property tax history
+14.7%/yrLatest (2025): $2,425 · +490.6% YoY. Source: county tax records.
Cash-flow waterfall
monthlySold comps — $/sqft
last 12 mo · ≤1 miLoading sold comps…