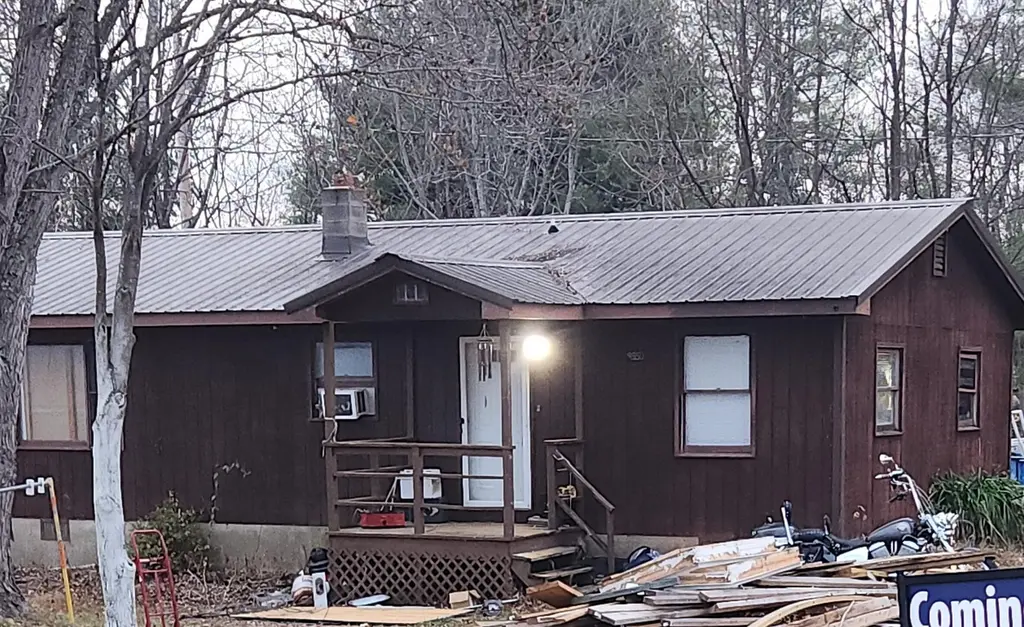
9550 Goodview Rd · Westlake Corner, VA
Flood risk 1/10 · Minimal
- FEMA flood zone
- X (unshaded)
- Chance of flooding over 30 yrs
- 0.0%
- Est. flood insurance / yr
- $507 – $1,088
Fire risk 3/10 · Minor
- Est. fire insurance / yr
- $666 – $1,236
Heat risk 5/10 · Moderate
- Hot days now (above 101°F)
- 7 days/yr
- Hot days in 30 yrs
- 18 days/yr
Wind risk 2/10 · Minimal
- Chance of severe wind over 30 yrs
- 2.0%
Air-quality risk 2/10 · Minimal
- Unhealthy air days now
- 1 days/yr
- Unhealthy air days in 30 yrs
- 1 days/yr
Risk factors via First Street. Map © Google.
Why this score? — see what drove the B+ grade
The composite is a weighted blend of 9 inputs, each scored 0–100. Each bar is that input's sub-score; the figure is the points it added to the 100-point composite (weight × sub-score).
- Cash flow +30.0/30.0
- DSCR +10.0/10.0
- Appreciation +10.0/10.0
- ARV discount +7.5/15.0
- 1% rule +7.3/10.0
- Schools +5.5/10.0
- Livability +2.7/5.0
- Rent growth +2.5/5.0
- Condition / age +2.5/5.0
$89,000
🖨 Deal sheet (PDF) 📄 Offer letter ✓ Due diligence
Listing remarks MLS
Motivated Seller - BRING ALL OFFERS! 2 bed / 2 bath home in Goodview with lots of potential, low-maintenance living, and stunning mountain views. Just minutes from Smith Mountain Lake and in the Staunton River School District. Great starter home or investment property
Key facts
- 0.61 acre lot
- Built 1986
- Listed 189 days
Neighborhood map
What this means for you Summary
Snapshot
- This is a 2-bed/0.5-bath single-family listed at $89k.
Deal economics
- At list price, monthly cash flow is $335 ($4k/yr) — positive.
- The deal already cash-flows at list — no discount required.
- Meets the 1% rule at list price ($1k rent vs $89k).
- Recommended offer: $78k (12.0% below list) — sets the bar for market timing.
- Cap rate 10.8% vs local median 1.5% in Westlake Corner — top-decile yield for the area; either an underpriced asset or a hidden risk that comps aren't pricing in. Stress-test before assuming the spread holds.
Location & tenants
- Location reads 54/100 on livability (#525 in VA) — a working-class tenant base; expect higher turnover. Strengths: crime A+; Watch: employment C-, cost of living D+, schools F.
- Bedford County Public School District (rural): math 55% / reading 73% proficiency, ranked #41 of 131 in VA (top 31%) — acceptable for families but not a draw, mixed tenant base, ~2y average lease.
- Market conditions: 68 active listings in the ZIP; 294 units permitted in Bedford County in 2024 (0 in 5+ unit buildings).
Forward outlook
- In year one you build about $10k of equity ($615 loan paydown + $9k appreciation (10.0% local appreciation)).
- Bedford County population projected at +8% by 2050 — modest demand growth; plan on rents tracking national, not racing it.
- At projected returns (10.0% appreciation + 3.0% rent growth), your $25k cash investment doubles in ~2 years — after that, you're playing with house money.
- By year 4, paydown + projected appreciation supports a ~$34k cash-out refi (75% LTV) — recoverable capital for the next deal without selling this one.
Negotiation context
- It's been on market 189 days — a 12% lower offer ($78k) is reasonable based on typical stale-listing flexibility.
- 5 sale attempts since 9y ago; this cycle's ask has dropped $91k (51%) from the opening price — seller is motivated, your offer sets the floor, not the list.
Risks & watch-outs
- Climate carrying-cost: extreme-heat days projected 7→18/yr by 2055 (HVAC capex compounding) — expect insurance premiums to compound above CPI over the hold.
Questions for the listing agent
- It's been on market 189 days. Have you received any prior offers? Is the seller open to a 12% concession, seller financing, or rate buy-down credit?
- Why hasn't it sold? Are there any deal-killer items the seller is aware of (foundation, flood, title, zoning, code violations)?
- Is there a deadline driving the sale (1031 exchange, divorce, estate, relocation)? That informs how much negotiation room exists.
- Schools are F-rated, which usually means shorter tenancies and higher turnover. Who's the typical renter profile here, and what's been the actual vacancy rate?
- What's the average days-on-market for RENTAL listings here right now (not sales)? A rising rental-DOM trend means longer vacancies and softer asking-rent achievability than the comps imply.
- What's the recent tenant-quality profile in this submarket — average credit score on applications, eviction rate, late-payment / NSF rate, and stable-employment percentage? A property-management company in the area should have these aggregated.
- How much new for-sale + rental construction is in the pipeline within 1–3 miles? Heavy new supply typically softens prices + rents 12–24 months out; constrained supply supports both.
Investment metrics
- 1% rule
- 1.23% ✓
- Cap rate
- 10.81%
- Cash-on-cash
- 16.13%
- DSCR
- 1.72
- GRM
- 6.8
CMA / ARV
- ARV (median comp)
- $399,032
- List price
- $89,000
- Delta
- -77.70%
- Verdict
- UNDERPRICED
- Comps
- 2 within 2.0 mi
Projected returns pro-forma
10.0% appreciation · 3.0% rent growth · sell at horizon
- IRR
- 36.2%
- Equity multiple
- 3.80×
- Total profit
- $69,772
- Equity at exit
- $80,178
- IRR
- 31.2%
- Equity multiple
- 8.57×
- Total profit
- $188,619
- Equity at exit
- $172,907
Cash invested: $24,920 (down + closing). Projections, not guarantees.
Landlord ↔ Tenant lean methodology
- Overall (STATE)
- 55 Moderately Landlord-Leaning
- State Virginia
- 55 Moderately Landlord-Leaning · D+2
- County
- — inherits STATE
- City
- — inherits STATE
ZIP-level market 24095
- Home prices YoY
- 12.3%
- Active inventory
- 68
- Price-to-rent
- 6.8×
Monthly cashflow live
- Estimated rent
- $1,096 medium interval (Pro) →
- Mortgage (P&I)
- −$467
- Tax from tax record
- −$27 /mo · $324/yr
- Insurance
- −$37
- HOA
- −$0
- Vacancy / Maint / Mgmt
- −$230
- Net cashflow
- $335
Break-even live
Sensitivity live
| Price | -10% $385 | -5% $360 | +0% $335 | +5% $310 | +10% $285 |
|---|---|---|---|---|---|
| Rent | -10% $248 | -5% $292 | +0% $335 | +5% $378 | +10% $422 |
| Rate | -1.0pp $380 | -0.5pp $358 | base $335 | +0.5pp $312 | +1.0pp $288 |
UW: 25.0% down · 7.5% · 30yr · 1.5% tax · 5.0% vac · 8.0% maint · 8.0% mgmt
Financing live
Cash to close
- Down payment
- $22,250
- Closing costs
- $2,670
- Reserves months
- —
- Total cash needed
- —
Loan-product check · same deal, 3 products live
Conventional
25% down · 7.5% · 30yr
- Down + closing
- —
- Monthly P&I
- —
- Monthly cashflow
- —
- DSCR
- —
- Eligible?
- —
Personal DTI + credit; lowest rate.
DSCR
20% down · 8.5% · 30yr
- Down + closing
- —
- Monthly P&I
- —
- Monthly cashflow
- —
- DSCR
- —
- Eligible?
- —
No personal income docs; deal must DSCR.
Hard money
10% down · 12.0% · 12mo
- Down + closing
- —
- Monthly P&I
- —
- Monthly cashflow
- —
- DSCR
- —
- Eligible?
- —
Short-term bridge; refi at stabilization.
Listing history 23 events
-
2026-06-14statusdays on market $89,000 Pending 189 DOM
-
2026-06-13pricedays on market $89,000 Active 188 DOM
-
2026-06-10pricedays on market $99,000 Active 186 DOM
-
2026-06-09days on market $125,000 Active 185 DOM
-
2026-06-08days on market $125,000 Active 184 DOM
-
2026-06-07days on market $125,000 Active 183 DOM
-
2026-06-05days on market $125,000 Active 180 DOM
-
2026-06-03days on market $125,000 Active 179 DOM
-
2026-06-02days on market $125,000 Active 178 DOM
-
2026-06-01days on market $125,000 Active 177 DOM
-
2026-05-31days on market $125,000 Active 176 DOM
-
2026-05-30days on market $125,000 Active 175 DOM
-
2026-05-08price $125,000 268-char remark
Show marketing remark (268 chars)
Motivated Seller - BRING ALL OFFERS! 2 bed / 2 bath home in Goodview with lots of potential, low-maintenance living, and stunning mountain views. Just minutes from Smith Mountain Lake and in the Staunton River School District. Great starter home or investment property
-
2025-12-06$180,000 Active 268-char remark
Show marketing remark (268 chars)
Motivated Seller - BRING ALL OFFERS! 2 bed / 2 bath home in Goodview with lots of potential, low-maintenance living, and stunning mountain views. Just minutes from Smith Mountain Lake and in the Staunton River School District. Great starter home or investment property
-
2025-12-03historical $180,000 268-char remark
Show marketing remark (268 chars)
Motivated Seller - BRING ALL OFFERS! 2 bed / 2 bath home in Goodview with lots of potential, low-maintenance living, and stunning mountain views. Just minutes from Smith Mountain Lake and in the Staunton River School District. Great starter home or investment property
-
2019-08-15historical
-
2019-03-01$109,500
-
2019-01-31historical
-
2018-07-31$89,000
-
2018-07-18historical
-
2017-12-14$89,000
-
2017-06-23historical
-
2017-04-28$114,950
ⓘ Source: listings_history table (triggers on properties + properties_extension) + one-shot
backfill from property_details.listing_events for pre-trigger history.
Tax reassessment forecast VA · Resets to sale price
- Current annual tax
- $324 · $27/mo
- Projected year-2 tax
- $730 · $61/mo
- Expected delta
- +$405/yr (+$34/mo · 125.0%)
ⓘ Screening estimate from a state-policy table — verify with the county assessor before closing.
Climate risk First Street
- Flood 1/10 Low FEMA zone X (unshaded) · 0% chance over 30 yrs
- Wildfire 3/10 Moderate
- Heat 5/10 Major 7 d/yr ≥101°F today · 18 d/yr by 30 yrs out
- Wind 2/10 Low 2% chance of damaging wind over 30 yrs
- Air quality 2/10 Low 1 unhealthy d/yr today · 1 by 30 yrs out
Nearby sold comps map
Loading sold comps map…
Walkable amenities ~0.75 mi
Loading nearby amenities…
Taxation est. · year 1
- Rental income
- $13,152
- − Mortgage interest
- −$4,985
- − Property taxes
- −$324
- − Insurance
- −$445
- − Repairs & maintenance
- −$1,052
- − Management
- −$1,052
- − Depreciation
- −$2,589
- Taxable income
- $2,704
- Est. tax owed @ 24.0%
- −$649
- After-tax cash flow
- $3,371/yr
For passive investors: Depreciation is non-cash, so a rental often shows a tax loss while cash-flowing — sheltering income. Rental losses are passive: they offset passive income freely, and up to $25,000/yr can offset ordinary (W-2) income if you actively participate and your MAGI is under $100k (phasing out to $0 by $150k); unused losses carry forward. On sale, claimed depreciation is recaptured at up to 25%, and gains may owe capital-gains tax (a 1031 exchange can defer both). Figures are a year-1 estimate at your 24.0% rate — not tax advice; consult a CPA.
Schools (NCES district)
- District
- Bedford County Public School District
- NCES district ID
- 5100360
- Math proficiency
- 55% ▼ -29.00%
- Reading proficiency
- 73% ▼ -7.00%
- Median HH income
- $56,288
- Composite
- 54.92/100
- National rank
- #1310
- State rank
- #41 of 131 in VA
Livability — Westlake Corner
- Score
- 54/100
- State rank
- #525
- US rank
- #24129
Category grades
Schools grade is shown separately in the Schools card above.
Census & demographics
- Population (ZIP)
- 3,426
Population outlook (Bedford County) Hauer SSP2
- Today (2025)
- 83,194 people
- By 2030
- 85,499 · +2.8%
- By 2040
- 88,834 · +6.8%
- By 2050
- 90,060 · +8.3%
- By 2075
- 94,131 · +13.1%
- By 2100
- 89,832 · +8.0%
Race, ethnicity, and origin ACS 2023
- Neighborhood character
- Predominantly White (83%)
- Race & ethnicity
- White 83% Hispanic / Latino 7% Asian 6% Two or more races 4% Black 1%
- Hispanic origin (detail)
- Puerto Rican 6%
- Common ancestry
- Serbian 3% Romanian 1% Slovak 1%
- Foreign-born
- 6% · China, Canada
- Languages at home
- 89% English-only · Spanish 5% Other Indo-European 5% Chinese 1%
Political lean MEDSL · Bedford
- 2024 margin
- Solid R (+50.4) · D 24.4% · R 74.8%
- 2008→2024 swing
- -13.0pp toward R · 2008: -37.4pp · 2024: -50.4pp
- All cycles
- 2024: R+50.4 2020: R+48.1 2016: R+49.4 2012: R+45.0 2008: R+37.4
Not yet ingested
- Civics
- —
Market trends
- HPI YoY
- ▲ 40.58%
- Current HPI
- 371.3743
- Rent YoY
- —
- Metro
- —
- State GDP YoY
- ▲ 2.40%
- F500 in state
- 50
Industry mix (Fortune 500 HQ in VA)
| Industry | F500 HQs | Revenue |
|---|---|---|
| Aerospace / Defense | 4 | $236B |
|
||
| Technology / Defense | 3 | $32B |
|
||
| Financial Services | 2 | $176B |
|
||
| Utilities | 2 | $27B |
|
||
| Insurance | 2 | $25B |
|
||
| Technology | 2 | $15B |
|
||
Price history
+8.7% since first listed11 events — show timeline
- 2026-05-08 Price Changed $125,000 MLSRV
- 2025-12-06 Listed $180,000 MLSRV
- 2025-12-03 Coming Soon $180,000 MLSRV
- 2019-08-15 Listing Removed — MLSRV
- 2019-03-01 Listed $109,500 MLSRV
- 2019-01-31 Listing Removed — MLSRV
- 2018-07-31 Listed $89,000 MLSRV
- 2018-07-18 Listing Removed — MLSRV
- 2017-12-14 Listed $89,000 MLSRV
- 2017-06-23 Listing Removed — MLSRV
- 2017-04-28 Listed $114,950 MLSRV
Property tax history
+0.6%/yrLatest (2025): $324 · +0.0% YoY. Source: county tax records.
Cash-flow waterfall
monthlySold comps — $/sqft
last 12 mo · ≤1 miLoading sold comps…