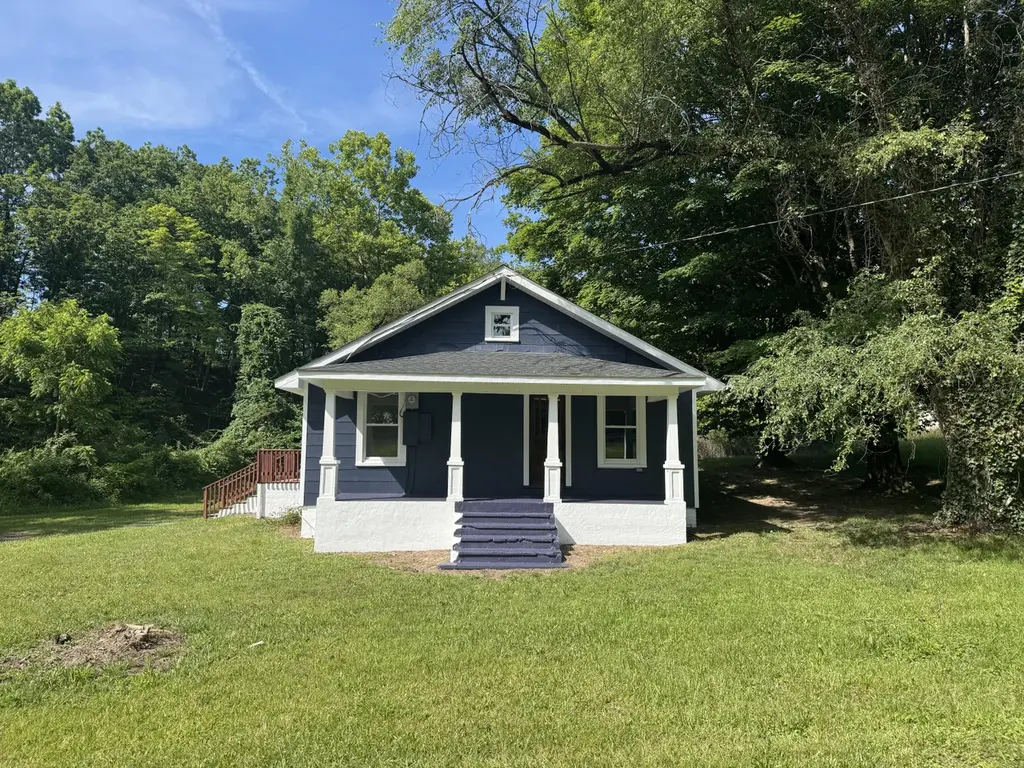
12820 W Lynchburg Salem · Montvale, VA
Flood risk 10/10 · Severe
- FEMA flood zone
- X (unshaded)
- Chance of flooding over 30 yrs
- 0.99%
- Est. flood insurance / yr
- $507 – $1,088
Fire risk 5/10 · Moderate
- Est. fire insurance / yr
- $666 – $1,236
Heat risk 5/10 · Moderate
- Hot days now (above 98°F)
- 7 days/yr
- Hot days in 30 yrs
- 21 days/yr
Wind risk 2/10 · Minimal
- Chance of severe wind over 30 yrs
- 1.0%
Air-quality risk 2/10 · Minimal
- Unhealthy air days now
- 1 days/yr
- Unhealthy air days in 30 yrs
- 2 days/yr
Risk factors via First Street. Map © Google.
Why this score? — see what drove the C grade
The composite is a weighted blend of 9 inputs, each scored 0–100. Each bar is that input's sub-score; the figure is the points it added to the 100-point composite (weight × sub-score).
- Cash flow +22.4/30.0
- ARV discount +7.5/15.0
- DSCR +7.2/10.0
- 1% rule +5.9/10.0
- Schools +5.5/10.0
- Livability +3.5/5.0
- Rent growth +2.5/5.0
- Condition / age +2.5/5.0
- Appreciation +0.0/10.0
$185,000
🖨 Deal sheet 📄 Offer letter ✓ Due diligence
Listing remarks MLS
Great investment property. Long term tenant on a month to month lease wanting to stay. Pays $650/month. Home has a living room, dining room, kitchen, 2 bedrooms, another room that could possibly be used as a 3rd bedroom, and a full bathroom. Water source is a spring and siding is asbestos.
Key facts
- Fully renovated
- New lvp flooring
- Fresh interior paint
Tags
Property features AI
Exterior
- Parking: Three open parking spaces
- Home design: Residential property; Built in 1926
- Construction: Crawl space foundation
- Exterior features: Off-street parking; Lot approximately 1.23 acres
Interior
- Bedrooms: Three bedrooms (all on the main level)
- Bathrooms: One full bathroom (main level)
- Heating & cooling: Forced-air electric heating; Cooling: Other (see remarks)
- Interior features: Seven total rooms; Clad, insulated, tilt-in windows; Crawl space basement
Neighborhood map
What this means for you Summary
Snapshot
- This is a 3-bed/1.0-bath single-family listed at $185k.
Deal economics
- At list price, monthly cash flow is $242 ($3k/yr) — positive.
- The deal already cash-flows at list — no discount required.
- Meets the 1% rule at list price ($2k rent vs $185k).
Location & tenants
- Location reads 70/100 on livability (#225 in VA) — a middle-class / working-renter tenant base. Strengths: cost of living A+, housing A+, health & safety A+; Watch: crime C-, employment D, amenities F.
- Bedford County Public School District (rural): math 55% / reading 73% proficiency, ranked #41 of 131 in VA (top 31%) — acceptable for families but not a draw, mixed tenant base, ~2y average lease.
- Zoned schools: Montvale Elementary (math 57% / reading 57%, grade C+, #597 of 1,108 statewide, top 57%, 253 students, 87% FRL); Liberty Middle (math 49% / reading 67%, grade B, #174 of 342 statewide, top 51%, 535 students, 86% FRL); Liberty High (math 41% / reading 68%, grade C-, #281 of 319 statewide, top 90%, 726 students, 69% FRL) — zoned schools average 81% FRL vs 30% district-wide (51 pts higher); higher-poverty schools than district average — tighter screening recommended.
- Market conditions: 43 active listings in the ZIP; 294 units permitted in Bedford County in 2024 (0 in 5+ unit buildings).
Forward outlook
- Local home prices are declining (-3.0%/yr); year-one equity from $1k of loan paydown is wiped out by about $6k of value loss. Plan a longer hold.
- Bedford County population projected at +8% by 2050 — modest demand growth; plan on rents tracking national, not racing it.
Negotiation context
- Only 14 days on market — expect competitive offers; lowballing is unlikely to land.
- 4 sale attempts since 6y ago with the ask held roughly flat each time — persistent listings suggest the price (not the market) is what's stuck; bring a comps-based counter.
- Current owner paid $65k; list at $185k implies a 185% gain — meaningful room to come down on a strong offer.
Risks & watch-outs
- Watch-outs: flood insurance adds $66/mo; built in 1926 — expect roof / HVAC / electrical / plumbing capex.
- Climate carrying-cost: severe flood risk; moderate wildfire risk; extreme-heat days projected 7→21/yr by 2055 (HVAC capex compounding) — expect insurance premiums to compound above CPI over the hold.
Questions for the listing agent
- Built in 1926 — when were the roof, HVAC, electrical panel, plumbing, and water heater last replaced?
- What's the actual annual flood-insurance premium (NFIP or private), and is the property in a SFHA with mandatory coverage?
- Is there a deadline driving the sale (1031 exchange, divorce, estate, relocation)? That informs how much negotiation room exists.
- Schools are B-rated — typically a magnet for longer-tenancy family renters. What's the average tenant stay here, and is there a school-zone premium baked into asking?
- What's the average days-on-market for RENTAL listings here right now (not sales)? A rising rental-DOM trend means longer vacancies and softer asking-rent achievability than the comps imply.
- What's the recent tenant-quality profile in this submarket — average credit score on applications, eviction rate, late-payment / NSF rate, and stable-employment percentage? A property-management company in the area should have these aggregated.
- How much new for-sale + rental construction is in the pipeline within 1–3 miles? Heavy new supply typically softens prices + rents 12–24 months out; constrained supply supports both.
Investment metrics
- 1% rule
- 1.09% ✓
- Cap rate
- 8.29%
- Cash-on-cash
- 7.15%
- DSCR
- 1.32
- GRM
- 7.7
CMA / ARV
No comps found within radius.
Projected returns pro-forma
-3.0% appreciation · 3.0% rent growth · sell at horizon
- IRR
- -7.6%
- Equity multiple
- 0.72×
- Total profit
- $-14,488
- Equity at exit
- $27,584
- IRR
- 2.0%
- Equity multiple
- 1.15×
- Total profit
- $7,527
- Equity at exit
- $15,995
Cash invested: $51,800 (down + closing). Projections, not guarantees.
Landlord ↔ Tenant lean methodology
- Overall (STATE)
- 55 Moderately Landlord-Leaning
- State Virginia
- 55 Moderately Landlord-Leaning · D+2
- County
- — inherits STATE
- City
- — inherits STATE
ZIP-level market 24064
- Active inventory
- 43
- Price-to-rent
- 7.7×
Monthly cashflow live
- Estimated rent
- $2,009 medium interval (Pro) →
- Mortgage (P&I)
- −$970
- Tax est. 1.5%
- −$231 /mo · $2,775/yr
- Insurance
- −$77
- Flood insurance flood zone
- −$66 /mo · $798/yr
- HOA
- −$0
- Vacancy / Maint / Mgmt
- −$422
- Net cashflow
- $242
Break-even live
UW: 25.0% down · 7.5% · 30yr · 1.5% tax · 5.0% vac · 8.0% maint · 8.0% mgmt
Financing live
Cash to close
- Down payment
- $46,250
- Closing costs
- $5,550
- Reserves months
- —
- Total cash needed
- —
Loan-product check · same deal, 3 products live
Conventional
25% down · 7.5% · 30yr
- Down + closing
- —
- Monthly P&I
- —
- Monthly cashflow
- —
- DSCR
- —
- Eligible?
- —
Personal DTI + credit; lowest rate.
DSCR
20% down · 8.5% · 30yr
- Down + closing
- —
- Monthly P&I
- —
- Monthly cashflow
- —
- DSCR
- —
- Eligible?
- —
No personal income docs; deal must DSCR.
Hard money
10% down · 12.0% · 12mo
- Down + closing
- —
- Monthly P&I
- —
- Monthly cashflow
- —
- DSCR
- —
- Eligible?
- —
Short-term bridge; refi at stabilization.
Listing history 12 events
-
2026-06-19days on market $185,000 Active 14 DOM
-
2026-06-18days on market $185,000 Active 13 DOM
-
2026-06-17days on market $185,000 Active 12 DOM
-
2026-06-16days on market $185,000 Active 11 DOM
-
2026-06-15days on market $185,000 Active 10 DOM
-
2026-06-14days on market $185,000 Active 8 DOM
-
2026-06-13days on market $185,000 Active 7 DOM
-
2026-06-10days on market $185,000 Active 5 DOM
-
2026-06-09days on market $185,000 Active 4 DOM
-
2026-06-08days on market $185,000 Active 3 DOM
-
2026-06-07remarks 699-char remark
-
2026-06-07$185,000 Active 2 DOM
ⓘ Source: listings_history table (triggers on properties + properties_extension) + one-shot
backfill from property_details.listing_events for pre-trigger history.
Climate risk First Street
- Flood 10/10 Extreme FEMA zone X (unshaded) · 99% chance over 30 yrs
- Wildfire 5/10 Major
- Heat 5/10 Major 7 d/yr ≥98°F today · 21 d/yr by 30 yrs out
- Wind 2/10 Low 100% chance of damaging wind over 30 yrs
- Air quality 2/10 Low 1 unhealthy d/yr today · 2 by 30 yrs out
Nearby sold comps map
Loading sold comps map…
Walkable amenities ~0.75 mi
Loading nearby amenities…
Taxation est. · year 1
- Rental income
- $24,107
- − Mortgage interest
- −$10,363
- − Property taxes
- −$2,775
- − Insurance
- −$1,722
- − Repairs & maintenance
- −$1,929
- − Management
- −$1,929
- − Depreciation
- −$5,382
- Taxable income
- $8
- Est. tax owed @ 24.0%
- −$2
- After-tax cash flow
- $2,903/yr
For passive investors: Depreciation is non-cash, so a rental often shows a tax loss while cash-flowing — sheltering income. Rental losses are passive: they offset passive income freely, and up to $25,000/yr can offset ordinary (W-2) income if you actively participate and your MAGI is under $100k (phasing out to $0 by $150k); unused losses carry forward. On sale, claimed depreciation is recaptured at up to 25%, and gains may owe capital-gains tax (a 1031 exchange can defer both). Figures are a year-1 estimate at your 24.0% rate — not tax advice; consult a CPA.
Schools (NCES district)
- District
- Bedford County Public School District
- NCES district ID
- 5100360
- Math proficiency
- 55% ▼ -29.00%
- Reading proficiency
- 73% ▼ -7.00%
- Median HH income
- $56,288
- Composite
- 54.92/100
- National rank
- #1310
- State rank
- #41 of 131 in VA
Livability — Montvale
- Score
- 70/100
- State rank
- #225
- US rank
- #7450
Category grades
Schools grade is shown separately in the Schools card above.
Census & demographics
- Population (ZIP)
- 5,226
Population outlook (Bedford County) Hauer SSP2
- Today (2025)
- 83,194 people
- By 2030
- 85,499 · +2.8%
- By 2040
- 88,834 · +6.8%
- By 2050
- 90,060 · +8.3%
- By 2075
- 94,131 · +13.1%
- By 2100
- 89,832 · +8.0%
Race, ethnicity, and origin ACS 2023
- Neighborhood character
- Predominantly White (88%)
- Race & ethnicity
- White 88% Two or more races 7% Hispanic / Latino 3% Black 2% Asian 1%
- Common ancestry
- Romanian 3% Iranian 3% Serbian 2%
- Foreign-born
- 3% · Canada, Vietnam, South Korea
- Languages at home
- 97% English-only · Spanish 2% French/Haitian/Cajun 1%
Political lean MEDSL · Bedford
- 2024 margin
- Solid R (+50.4) · D 24.4% · R 74.8%
- 2008→2024 swing
- -13.0pp toward R · 2008: -37.4pp · 2024: -50.4pp
- All cycles
- 2024: R+50.4 2020: R+48.1 2016: R+49.4 2012: R+45.0 2008: R+37.4
Not yet ingested
- Civics
- —
Market trends
- HPI YoY
- ▼ -90.90%
- Current HPI
- 160.6289
- Rent YoY
- —
- Metro
- —
- State GDP YoY
- ▲ 2.40%
- F500 in state
- 50
Industry mix (Fortune 500 HQ in VA)
| Industry | F500 HQs | Revenue |
|---|---|---|
| Aerospace / Defense | 4 | $236B |
|
||
| Technology / Defense | 3 | $32B |
|
||
| Financial Services | 2 | $176B |
|
||
| Utilities | 2 | $27B |
|
||
| Insurance | 2 | $25B |
|
||
| Technology | 2 | $15B |
|
||
Price history
+236.4% since first listed8 events — show timeline
- 2026-06-05 Listed $185,000 MLSRV
- 2025-04-07 Sold (MLS) $65,000 MLSRV
- 2025-02-27 Pending — MLSRV
- 2025-02-07 Listed $99,950 MLSRV
- 2021-11-30 Listing Removed — MLSRV
- 2021-11-24 Listed $66,000 MLSRV
- 2020-04-28 Listing Removed — MLSRV
- 2020-03-17 Listed $55,000 MLSRV
Property tax history
+1.2%/yrLatest (2025): $330 · +0.0% YoY. Source: county tax records.
Cash-flow waterfall
monthlySold comps — $/sqft
last 12 mo · ≤1 miLoading sold comps…