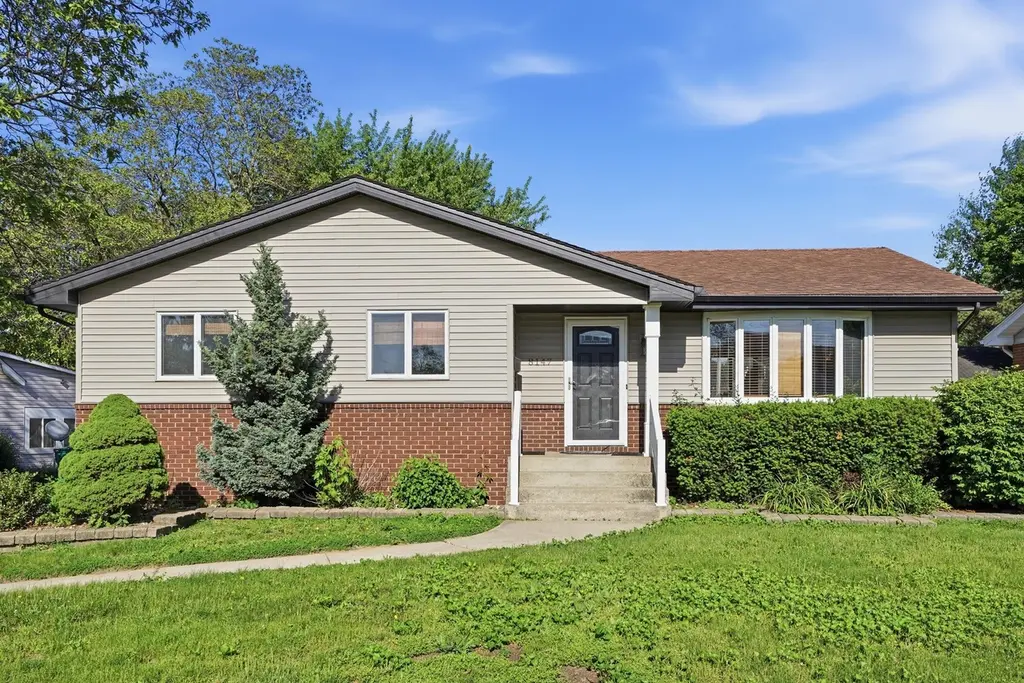
8147 Harrison Ave · Munster, IN
Flood risk 1/10 · Minimal
- FEMA flood zone
- X (unshaded)
- Chance of flooding over 30 yrs
- 0.0%
- Est. flood insurance / yr
- $473 – $860
Fire risk 1/10 · Minimal
- Est. fire insurance / yr
- $717 – $1,331
Heat risk 3/10 · Minor
- Hot days now (above 102°F)
- 7 days/yr
- Hot days in 30 yrs
- 15 days/yr
Wind risk 2/10 · Minimal
- Chance of severe wind over 30 yrs
- 0.0%
Air-quality risk 4/10 · Minor
- Unhealthy air days now
- 5 days/yr
- Unhealthy air days in 30 yrs
- 6 days/yr
Risk factors via First Street. Map © Google.
Why this score? — see what drove the F grade
The composite is a weighted blend of 9 inputs, each scored 0–100. Each bar is that input's sub-score; the figure is the points it added to the 100-point composite (weight × sub-score).
- Cash flow +6.6/30.0
- Schools +5.7/10.0
- Livability +4.0/5.0
- Rent growth +2.5/5.0
- Condition / age +2.5/5.0
- 1% rule +1.3/10.0
- DSCR +0.9/10.0
- ARV discount +0.0/15.0
- Appreciation +0.0/10.0
$330,000
🖨 Deal sheet (PDF) 📄 Offer letter ✓ Due diligence
Listing remarks MLS
3 bedrooms, full finished basement energy star home, not in flood zone. Huge fenced in yard with deck ready for above ground pool. New carpet, professionally decorated, must see. Screened in 3 seasons porch.
Key facts
- Dry bar
- Finished basement
- Above-ground pool
Tags
Property features AI
Exterior
- Parking: Detached garage; Paved driveway
- Security: Security system; Smoke detectors
- Utilities: Public water; Public sewer; 100 amp electric service
- Home design: One-level property; Built in 1978; Neighborhood view
- Construction: Brick and vinyl siding exterior; Shingle roof; Garage structure present; Basement present
- Exterior features: Private yard; Outdoor lighting; Above-ground pool; Fenced backyard
Interior
- Kitchen: Dishwasher; Gas range; Gas cooktop; Microwave; Refrigerator; Disposal; Gas water heater; Pantry
- Bedrooms: Primary bedroom; Bedroom 2; Bedroom 3
- Flooring: Hardwood; Laminate; Carpet
- Bathrooms: 1 full bathroom; 1 half bathroom
- Heating & cooling: Natural gas heating; Central air conditioning; Ceiling fans
- Interior features: Ceiling fans; Recessed lighting; Pantry; Other interior features; Sump pump in basement; Basement storage space
- Laundry & utility: Laundry room with washer hookup; Gas dryer hookup; Sink
Neighborhood map
What this means for you Summary
Snapshot
- This is a 3-bed/1.5-bath single-family listed at $330k.
Deal economics
- At list price, monthly cash flow is $-535 ($-6k/yr) — negative.
- To cash-flow at today's rent, offer at most $235k (28.7% below list).
- To meet the 1% rule (rent ≥ 1% of price), the offer needs to be $207k (37.3% below list).
- Recommended offer: $207k (37.3% below list) — sets the bar for 1% rule.
Location & tenants
- Location reads 81/100 on livability (#17 in IN, #1,427 nationally) — a professional / high-income tenant draw. Strengths: schools A+, crime A+, employment A+; Watch: amenities F, commute F.
- School Town Of Munster (suburban): math 65% / reading 64% proficiency, ranked #6 of 301 in IN (top 2%) — acceptable for families but not a draw, mixed tenant base, ~2y average lease; only 14% free/reduced lunch — higher-income household profile.
- Market conditions: 112 active listings in the ZIP; 5 comparable units currently listed for rent nearby; rentals leasing fast (median 11d on market — plan ~1-2 weeks tenant-placement turnaround); high-income renter base; 1,642 units permitted in Lake County in 2024 (14 in 5+ unit buildings).
Forward outlook
- Local home prices are declining (-3.0%/yr); year-one equity from $2k of loan paydown is wiped out by about $10k of value loss. Plan a longer hold.
- Lake County population projected to shrink 7% by 2050 — rents likely to lag national; underwrite the cash flow, not the appreciation.
Negotiation context
- It's been on market 27 days — a 2% lower offer ($325k) is reasonable based on typical stale-listing flexibility.
- 3 sale attempts since 14y ago with the ask held roughly flat each time — persistent listings suggest the price (not the market) is what's stuck; bring a comps-based counter.
- Current owner paid $180k; list at $330k implies a 84% gain — meaningful room to come down on a strong offer.
Questions for the listing agent
- What do current leases actually rent for vs. the listed asking? Can we see a recent rent roll and the last 12 months of T-12 income?
- Built in 1978 — when were the roof, HVAC, electrical panel, plumbing, and water heater last replaced?
- Is there a deadline driving the sale (1031 exchange, divorce, estate, relocation)? That informs how much negotiation room exists.
- Schools are A-rated — typically a magnet for longer-tenancy family renters. What's the average tenant stay here, and is there a school-zone premium baked into asking?
- The area grade is low — what's the realistic commute time and amenity access for the typical tenant pool here? Any planned neighborhood developments (good or bad) we should know about?
- What's the average days-on-market for RENTAL listings here right now (not sales)? A rising rental-DOM trend means longer vacancies and softer asking-rent achievability than the comps imply.
- What's the recent tenant-quality profile in this submarket — average credit score on applications, eviction rate, late-payment / NSF rate, and stable-employment percentage? A property-management company in the area should have these aggregated.
- How much new for-sale + rental construction is in the pipeline within 1–3 miles? Heavy new supply typically softens prices + rents 12–24 months out; constrained supply supports both.
Investment metrics
- 1% rule
- 0.63% ✗
- Cap rate
- 4.35%
- Cash-on-cash
- -6.95%
- DSCR
- 0.69
- GRM
- 13.3
CMA / ARV
- ARV (on-the-fly)
- $272,616
- Comps found
- 12
Show comp detail 12 sales within ~0.75 mi
| Address | Dist | Beds/Ba | Sqft | Sold | Price | $/sf | Match |
|---|---|---|---|---|---|---|---|
| 8128 Jackson Ave | 0.11mi | 2/1.0 (-1) | 1,159 (-6%) | 6mo | $255,000 | $220 | 74 |
| 8322 Harrison Ave | 0.23mi | 3/1.0 | 1,126 (-8%) | 3mo | $249,000 | $221 | 71 |
| 7741 Hohman Ave | 0.59mi | 2/1.0 (-1) | 1,193 (-3%) | 4mo | $230,000 | $193 | 58 |
| 7840 Monroe Ave | 0.41mi | 3/1.0 | 1,379 (+12%) | 1mo | $320,000 | $232 | 57 |
| 304 Beverly Pl | 0.40mi | 3/2.0 | 1,359 (+11%) | 7mo | $315,000 | $232 | 56 |
| 249 Briar Ln | 0.43mi | 3/1.0 | 1,068 (-13%) | 3mo | $280,000 | $262 | 54 |
| 8154 Kooy Dr | 0.75mi | 3/2.0 | 1,170 (-5%) | 7mo | $295,000 | $252 | 49 |
| 8120 Tapper Ave | 0.56mi | 3/2.0 | 1,376 (+12%) | 4mo | $305,000 | $222 | 49 |
| 18122 Wentworth Ave | 0.72mi | 3/2.0 | 1,150 (-6%) | 6mo | $268,500 | $233 | 49 |
| 7613 Monroe Ave | 0.73mi | 4/1.0 (+1) | 1,330 (+8%) | 1mo | $196,000 | $147 | 44 |
| 17759 Maple St | 0.72mi | 4/2.0 (+1) | 1,328 (+8%) | 4mo | $276,999 | $209 | 42 |
| 7607 Monroe Ave | 0.74mi | 2/1.5 (-1) | 1,092 (-11%) | 3mo | $179,900 | $165 | 40 |
Match score weights: distance 35% · size 25% · config 20% · recency 20%. Top-matched comps best support the ARV.
Projected returns pro-forma
-3.0% appreciation · 3.0% rent growth · sell at horizon
- IRR
- -28.4%
- Equity multiple
- 0.05×
- Total profit
- $-87,606
- Equity at exit
- $49,204
- IRR
- -27.7%
- Equity multiple
- -0.30×
- Total profit
- $-120,338
- Equity at exit
- $28,532
Cash invested: $92,400 (down + closing). Projections, not guarantees.
Landlord ↔ Tenant lean methodology
- Overall (STATE)
- 90 Strongly Landlord-Friendly
- State Indiana
- 90 Strongly Landlord-Friendly · R+11
- County
- — inherits STATE
- City
- — inherits STATE
ZIP-level market 46321
- Active inventory
- 112
- Price-to-rent
- 13.3×
Monthly cashflow live
- Estimated rent
- $2,069 high interval (Pro) →
- Mortgage (P&I)
- −$1,731
- Tax from tax record
- −$302 /mo · $3,624/yr
- Insurance
- −$138
- HOA
- −$0
- Vacancy / Maint / Mgmt
- −$435
- Net cashflow
- $-535
Break-even live
Sensitivity live
| Price | -10% $-349 | -5% $-442 | +0% $-535 | +5% $-629 | +10% $-722 |
|---|---|---|---|---|---|
| Rent | -10% $-699 | -5% $-617 | +0% $-535 | +5% $-454 | +10% $-372 |
| Rate | -1.0pp $-369 | -0.5pp $-451 | base $-535 | +0.5pp $-621 | +1.0pp $-708 |
UW: 25.0% down · 7.5% · 30yr · 1.5% tax · 5.0% vac · 8.0% maint · 8.0% mgmt
Financing live
Cash to close
- Down payment
- $82,500
- Closing costs
- $9,900
- Reserves months
- —
- Total cash needed
- —
Loan-product check · same deal, 3 products live
Conventional
25% down · 7.5% · 30yr
- Down + closing
- —
- Monthly P&I
- —
- Monthly cashflow
- —
- DSCR
- —
- Eligible?
- —
Personal DTI + credit; lowest rate.
DSCR
20% down · 8.5% · 30yr
- Down + closing
- —
- Monthly P&I
- —
- Monthly cashflow
- —
- DSCR
- —
- Eligible?
- —
No personal income docs; deal must DSCR.
Hard money
10% down · 12.0% · 12mo
- Down + closing
- —
- Monthly P&I
- —
- Monthly cashflow
- —
- DSCR
- —
- Eligible?
- —
Short-term bridge; refi at stabilization.
Rent comps 5 comps
| Address | Beds | Baths | Sqft | Rent | $/sqft | DOM | Units | Dist |
|---|---|---|---|---|---|---|---|---|
| 18335 Sherman St Unit 3 Lansing, IL | 3.0 | 1.0 | 1000 | $1,700 | $1.70 | 1d | 1 | 0.89mi |
| 3341 S Schultz Dr Lansing, IL | 4.0 | 2.0 | 1452 | $2,250 | $1.55 | 10d | 1 | 1.09mi |
| 3649 173rd Ct Lansing, IL | 2.0 | 2.0 | 972 | $1,357 | $1.40 | 25d | 1 | 1.14mi |
| 7609 Beech Ave Hammond, IN | 2.0 | 1.0 | 700 | $1,400 | $2.00 | 4d | 1 | 1.35mi |
| 7234 Columbia Ave Hammond, IN | 2.0 | 1.0 | 960 | $1,300 | $1.35 | 25d | 1 | 1.41mi |
Listing history 19 events
-
2026-06-18days on market $330,000 Active 27 DOM
-
2026-06-17days on market $330,000 Active 26 DOM
-
2026-06-16days on market $330,000 Active 25 DOM
-
2026-06-15days on market $330,000 Active 24 DOM
-
2026-06-13days on market $330,000 Active 22 DOM
-
2026-06-13pricedays on market $330,000 Active 21 DOM
-
2026-06-09days on market $340,000 Active 18 DOM
-
2026-06-08days on market $340,000 Active 17 DOM
-
2026-06-07days on market $340,000 Active 16 DOM
-
2026-06-04days on market $340,000 Active 13 DOM
-
2026-06-03days on market $340,000 Active 12 DOM
-
2026-06-02days on market $340,000 Active 11 DOM
-
2026-06-01days on market $340,000 Active 10 DOM
-
2026-05-31days on market $340,000 Active 9 DOM
-
2026-05-22$340,000 Active
-
2025-10-01historical
-
2025-03-31$359,900 Active
-
2012-07-10soldstatus $179,500 207-char remark
Show marketing remark (207 chars)
3 bedrooms, full finished basement energy star home, not in flood zone. Huge fenced in yard with deck ready for above ground pool. New carpet, professionally decorated, must see. Screened in 3 seasons porch.
-
2012-03-31$184,900 207-char remark
Show marketing remark (207 chars)
3 bedrooms, full finished basement energy star home, not in flood zone. Huge fenced in yard with deck ready for above ground pool. New carpet, professionally decorated, must see. Screened in 3 seasons porch.
ⓘ Source: listings_history table (triggers on properties + properties_extension) + one-shot
backfill from property_details.listing_events for pre-trigger history.
Tax reassessment forecast IN · Partial reset (capped growth)
- Current annual tax
- $3,624 · $302/mo
- Projected year-2 tax
- $3,624 · $302/mo
- Expected delta
- $0/yr ($0/mo · 0.0%)
ⓘ Screening estimate from a state-policy table — verify with the county assessor before closing.
Climate risk First Street
- Flood 1/10 Low FEMA zone X (unshaded) · 0% chance over 30 yrs
- Wildfire 1/10 Low
- Heat 3/10 Moderate 7 d/yr ≥102°F today · 15 d/yr by 30 yrs out
- Wind 2/10 Low 0% chance of damaging wind over 30 yrs
- Air quality 4/10 Moderate 5 unhealthy d/yr today · 6 by 30 yrs out
Nearby sold comps map
Loading sold comps map…
Walkable amenities ~0.75 mi
Loading nearby amenities…
Taxation est. · year 1
- Rental income
- $24,831
- − Mortgage interest
- −$18,485
- − Property taxes
- −$3,624
- − Insurance
- −$1,650
- − Repairs & maintenance
- −$1,987
- − Management
- −$1,987
- − Depreciation
- −$9,600
- Taxable loss
- −$12,501
- Est. tax savings @ 24.0%
- +$3,000
- After-tax cash flow
- $-3,424/yr
For passive investors: Depreciation is non-cash, so a rental often shows a tax loss while cash-flowing — sheltering income. Rental losses are passive: they offset passive income freely, and up to $25,000/yr can offset ordinary (W-2) income if you actively participate and your MAGI is under $100k (phasing out to $0 by $150k); unused losses carry forward. On sale, claimed depreciation is recaptured at up to 25%, and gains may owe capital-gains tax (a 1031 exchange can defer both). Figures are a year-1 estimate at your 24.0% rate — not tax advice; consult a CPA.
Schools (NCES district)
- District
- School Town Of Munster
- NCES district ID
- 1807350
- Math proficiency
- 65% ▼ -1.00%
- Reading proficiency
- 64% ▼ -4.00%
- Median HH income
- $71,901
- Composite
- 56.91/100
- National rank
- #1115
- State rank
- #6 of 301 in IN
Livability — Munster
- Score
- 81/100
- State rank
- #17
- US rank
- #1427
Category grades
Schools grade is shown separately in the Schools card above.
Census & demographics
- Census place
- Munster, IN
- County
- Lake County · 422,878 people
- City population
- 23,733
- Metro
- Chicago-Naperville-Elgin, IL-IN-WI
- Population (ZIP)
- 23,733
- Household income
- $110,187
- Rent vs Own
- Severe rent burden
- 338.0
Population outlook (Lake County) Hauer SSP2
- Today (2025)
- 484,026 people
- By 2030
- 478,091 · -1.2%
- By 2040
- 462,974 · -4.3%
- By 2050
- 449,894 · -7.1%
- By 2075
- 436,169 · -9.9%
- By 2100
- 426,607 · -11.9%
Race, ethnicity, and origin ACS 2023
- Neighborhood character
- Predominantly White (71%)
- Race & ethnicity
- White 71% Hispanic / Latino 14% Two or more races 8% Black 7% Asian 6%
- Hispanic origin (detail)
- Mexican 11% Puerto Rican 2%
- Common ancestry
- Romanian 16% Iranian 4% Lithuanian 1%
- Foreign-born
- 9% · Canada, South Korea, China
- Languages at home
- 86% English-only · Spanish 6% Russian/Polish/Slavic 3% Other Indo-European 2%
Political lean MEDSL · Lake
- 2024 margin
- Lean D (+5.6) · D 52.1% · R 46.5% · Other 1.5%
- 2008→2024 swing
- -28.6pp toward R · 2008: 34.3pp · 2024: 5.6pp
- All cycles
- 2024: D+5.6 2020: D+15.1 2016: D+20.6 2012: D+31.0 2008: D+34.3
Not yet ingested
- Civics
- —
Market trends
- HPI YoY
- ▼ -213.34%
- Current HPI
- 232.4818
- Rent YoY
- —
- Metro
- Chicago-Naperville-Elgin, IL-IN-WI
- State GDP YoY
- ▲ 2.90%
- F500 in state
- 18
Industry mix (Fortune 500 HQ in IN)
| Industry | F500 HQs | Revenue |
|---|---|---|
| Industrial Machinery | 2 | $37B |
|
||
| Healthcare | 1 | $177B |
|
||
| Pharmaceuticals | 1 | $45B |
|
||
| Metals / Steel | 1 | $18B |
|
||
| Agriculture | 1 | $17B |
|
||
| Packaging | 1 | $12B |
|
||
Price history
+83.9% since first listed5 events — show timeline
- 2026-05-22 Listed $340,000 NIRA MLS as Distributed by MLS Grid
- 2025-10-01 Listing Removed — NIRA MLS as Distributed by MLS Grid
- 2025-03-31 Listed $359,900 NIRA MLS as Distributed by MLS Grid
- 2012-07-10 Sold (MLS) $179,500 NIRA MLS as Distributed by MLS Grid
- 2012-03-31 Listed $184,900 NIRA MLS as Distributed by MLS Grid
Property tax history
+2.2%/yrLatest (2024): $3,624 · +9.1% YoY. Source: county tax records.
Cash-flow waterfall
monthlySold comps — $/sqft
last 12 mo · ≤1 miLoading sold comps…