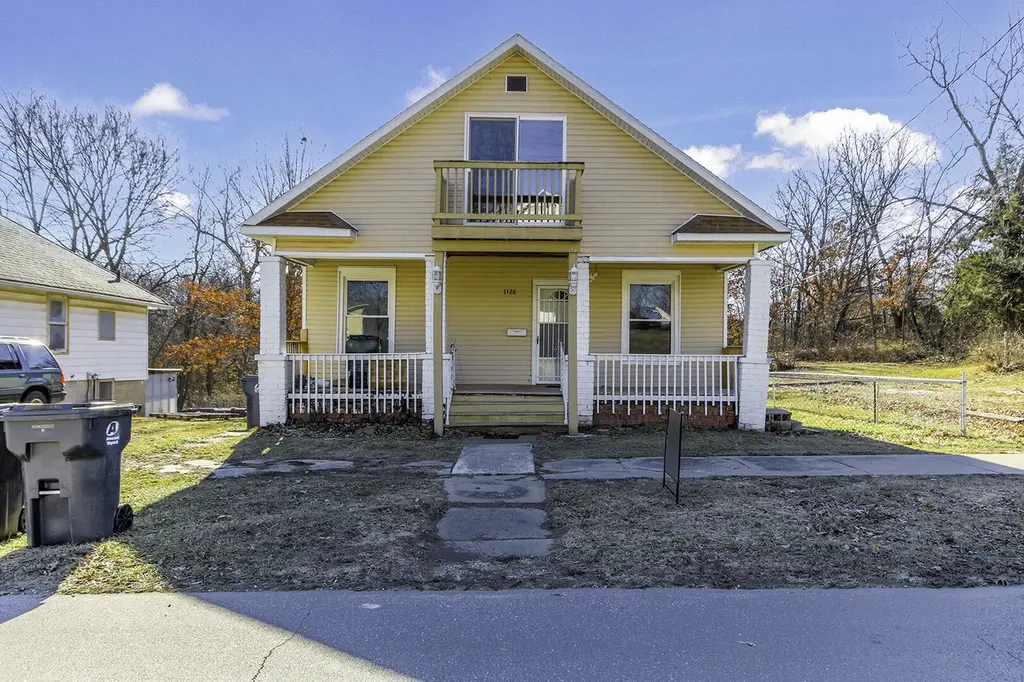
1126 Franklin St · Moberly, MO
Flood risk 1/10 · Minimal
- FEMA flood zone
- X (unshaded)
- Chance of flooding over 30 yrs
- 0.0%
- Est. flood insurance / yr
- $507 – $1,088
Fire risk 4/10 · Minor
- Est. fire insurance / yr
- $1,054 – $1,958
Heat risk 3/10 · Minor
- Hot days now (above 106°F)
- 7 days/yr
- Hot days in 30 yrs
- 17 days/yr
Wind risk 2/10 · Minimal
- Chance of severe wind over 30 yrs
- —
Air-quality risk 1/10 · Minimal
- Unhealthy air days now
- 0 days/yr
- Unhealthy air days in 30 yrs
- 0 days/yr
Risk factors via First Street. Map © Google.
Why this score? — see what drove the B+ grade
The composite is a weighted blend of 9 inputs, each scored 0–100. Each bar is that input's sub-score; the figure is the points it added to the 100-point composite (weight × sub-score).
- Cash flow +30.0/30.0
- ARV discount +15.0/15.0
- 1% rule +10.0/10.0
- DSCR +10.0/10.0
- Livability +3.9/5.0
- Schools +2.7/10.0
- Rent growth +2.5/5.0
- Condition / age +2.5/5.0
- Appreciation +0.0/10.0
$69,000
🖨 Deal sheet (PDF) 📄 Offer letter ✓ Due diligence
Listing remarks MLS
1 1/2 Story 3 Bedroom, 1 Bath Home. Bedroom on Main Floor, Full Bath, Pantry/Laundry Room. Upper level features 2 Bedrooms-one has Patio Doors opening onto a Juliet Balcony. All Electric Home, Baseboard Heat, Large Lot, West Side yard has chain link fence, Full Covered Front Porch, Full U/F Basement. Seller will provide Occupancy Certificate prior to Closing. More photos coming soon.
Key facts
- All electric home
- Patio doors
- Juliet balcony
Tags
Neighborhood map
What this means for you Summary
Snapshot
- This is a 3-bed/1.0-bath single-family listed at $69k.
Deal economics
- At list price, monthly cash flow is $441 ($5k/yr) — positive.
- The deal already cash-flows at list — no discount required.
- Meets the 1% rule at list price ($1k rent vs $69k).
- Recommended offer: $61k (12.0% below list) — sets the bar for market timing.
- Cap rate 14.0% vs local median 4.5% in Moberly — top-decile yield for the area; either an underpriced asset or a hidden risk that comps aren't pricing in. Stress-test before assuming the spread holds.
Location & tenants
- Location reads 77/100 on livability (#32 in MO, #3,045 nationally) — a middle-class / working-renter tenant base. Strengths: cost of living A+, housing A+, health & safety A+; Watch: employment D, schools D-, amenities F.
- Moberly (town): math 30% / reading 36% proficiency, ranked #246 of 324 in MO (top 76%) — families likely to look elsewhere, expect single-tenant / working-renter base with shorter leases.
- Market conditions: 136 active listings in the ZIP; 1 comparable units currently listed for rent nearby; 25 units permitted in Randolph County in 2024 (0 in 5+ unit buildings).
Forward outlook
- Local home prices are declining (-3.0%/yr); year-one equity from $477 of loan paydown is wiped out by about $2k of value loss. Plan a longer hold.
- Randolph County population projected at -10% by 2050 — secular population decline; favor cash flow + early exit over multi-decade hold.
- At projected returns (-3.0% appreciation + 3.0% rent growth), your $19k cash investment doubles in ~5 years — after that, you're playing with house money.
Negotiation context
- It's been on market 147 days — a 12% lower offer ($61k) is reasonable based on typical stale-listing flexibility.
- 8 sale attempts since 3y ago with the ask held roughly flat each time — persistent listings suggest the price (not the market) is what's stuck; bring a comps-based counter.
Risks & watch-outs
- Watch-outs: built in 1900 — expect roof / HVAC / electrical / plumbing capex.
Questions for the listing agent
- It's been on market 147 days. Have you received any prior offers? Is the seller open to a 12% concession, seller financing, or rate buy-down credit?
- Built in 1900 — when were the roof, HVAC, electrical panel, plumbing, and water heater last replaced?
- Why hasn't it sold? Are there any deal-killer items the seller is aware of (foundation, flood, title, zoning, code violations)?
- Is there a deadline driving the sale (1031 exchange, divorce, estate, relocation)? That informs how much negotiation room exists.
- Schools are D-rated, which usually means shorter tenancies and higher turnover. Who's the typical renter profile here, and what's been the actual vacancy rate?
- What's the average days-on-market for RENTAL listings here right now (not sales)? A rising rental-DOM trend means longer vacancies and softer asking-rent achievability than the comps imply.
- What's the recent tenant-quality profile in this submarket — average credit score on applications, eviction rate, late-payment / NSF rate, and stable-employment percentage? A property-management company in the area should have these aggregated.
- How much new for-sale + rental construction is in the pipeline within 1–3 miles? Heavy new supply typically softens prices + rents 12–24 months out; constrained supply supports both.
Investment metrics
- 1% rule
- 1.58% ✓
- Cap rate
- 13.96%
- Cash-on-cash
- 27.39%
- DSCR
- 2.22
- GRM
- 5.3
CMA / ARV
- ARV (median comp)
- $134,464
- List price
- $69,000
- Delta
- -48.69%
- Verdict
- UNDERPRICED
- Comps
- 20 within 1.0 mi
Show comp detail 12 sales within ~0.75 mi
| Address | Dist | Beds/Ba | Sqft | Sold | Price | $/sf | Match |
|---|---|---|---|---|---|---|---|
| 1123 Concannon St | 0.17mi | 3/1.0 | 968 (-5%) | 1mo | $148,000 | $153 | 83 |
| 1029 Concannon St | 0.21mi | 3/2.0 | 960 (-6%) | 2mo | $165,000 | $172 | 75 |
| 1007 Myra St | 0.30mi | 2/1.0 (-1) | 950 (-7%) | 11mo | $145,000 | $153 | 60 |
| 1204 Fisk Ave | 0.47mi | 2/1.0 (-1) | 954 (-6%) | 8mo | $159,900 | $168 | 56 |
| 1312 Concannon St | 0.14mi | 2/1.0 (-1) | 1,155 (+13%) | 12mo | $140,000 | $121 | 56 |
| 837 Myra St | 0.39mi | 3/2.0 | 1,130 (+11%) | 8mo | $149,500 | $132 | 53 |
| 1003 Bond St | 0.23mi | 2/1.0 (-1) | 1,168 (+15%) | 11mo | $35,000 | $30 | 51 |
| 1100 Quinn St | 0.41mi | 2/1.0 (-1) | 928 (-9%) | 13mo | $45,000 | $48 | 51 |
| 126 Bedford St | 0.45mi | 2/1.0 (-1) | 924 (-9%) | 11mo | $115,000 | $124 | 50 |
| 620 Burkholder St | 0.45mi | 2/1.0 (-1) | 1,150 (+13%) | 6mo | $159,500 | $139 | 48 |
| 1323 Henry St | 0.30mi | 3/2.0 | 1,170 (+15%) | 12mo | $43,900 | $38 | 47 |
| 319 S 6th St | 0.73mi | 2/1.0 (-1) | 966 (-5%) | 8mo | $89,900 | $93 | 46 |
Match score weights: distance 35% · size 25% · config 20% · recency 20%. Top-matched comps best support the ARV.
Projected returns pro-forma
-3.0% appreciation · 3.0% rent growth · sell at horizon
- IRR
- 21.4%
- Equity multiple
- 1.87×
- Total profit
- $16,883
- Equity at exit
- $10,288
- IRR
- 29.5%
- Equity multiple
- 3.63×
- Total profit
- $50,788
- Equity at exit
- $5,966
Cash invested: $19,320 (down + closing). Projections, not guarantees.
Landlord ↔ Tenant lean methodology
- Overall (STATE)
- 81 Strongly Landlord-Friendly
- State Missouri
- 81 Strongly Landlord-Friendly · R+10
- County
- — inherits STATE
- City
- — inherits STATE
ZIP-level market 65270
- Home prices YoY
- -30.6%
- Active inventory
- 136
- Price-to-rent
- 5.3×
Monthly cashflow live
- Estimated rent
- $1,090 medium interval (Pro) →
- Mortgage (P&I)
- −$362
- Tax from tax record
- −$30 /mo · $355/yr
- Insurance
- −$29
- HOA
- −$0
- Vacancy / Maint / Mgmt
- −$229
- Net cashflow
- $441
Break-even live
Sensitivity live
| Price | -10% $480 | -5% $460 | +0% $441 | +5% $421 | +10% $402 |
|---|---|---|---|---|---|
| Rent | -10% $355 | -5% $398 | +0% $441 | +5% $484 | +10% $527 |
| Rate | -1.0pp $476 | -0.5pp $458 | base $441 | +0.5pp $423 | +1.0pp $405 |
UW: 25.0% down · 7.5% · 30yr · 1.5% tax · 5.0% vac · 8.0% maint · 8.0% mgmt
Financing live
Cash to close
- Down payment
- $17,250
- Closing costs
- $2,070
- Reserves months
- —
- Total cash needed
- —
Loan-product check · same deal, 3 products live
Conventional
25% down · 7.5% · 30yr
- Down + closing
- —
- Monthly P&I
- —
- Monthly cashflow
- —
- DSCR
- —
- Eligible?
- —
Personal DTI + credit; lowest rate.
DSCR
20% down · 8.5% · 30yr
- Down + closing
- —
- Monthly P&I
- —
- Monthly cashflow
- —
- DSCR
- —
- Eligible?
- —
No personal income docs; deal must DSCR.
Hard money
10% down · 12.0% · 12mo
- Down + closing
- —
- Monthly P&I
- —
- Monthly cashflow
- —
- DSCR
- —
- Eligible?
- —
Short-term bridge; refi at stabilization.
Rent comps 1 comps
| Address | Beds | Baths | Sqft | Rent | $/sqft | DOM | Units | Dist |
|---|---|---|---|---|---|---|---|---|
| 204 Cockrell Dr Moberly, MO | 2.0 | 2.0 | 1150 | $1,090 | $0.95 | 44d | 1 | 1.38mi |
Listing history 37 events
-
2026-06-21days on market $69,000 Active 147 DOM
-
2026-06-18days on market $69,000 Active 145 DOM
-
2026-06-17days on market $69,000 Active 144 DOM
-
2026-06-16days on market $69,000 Active 143 DOM
-
2026-06-15days on market $69,000 Active 142 DOM
-
2026-06-13days on market $69,000 Active 140 DOM
-
2026-06-12days on market $69,000 Active 139 DOM
-
2026-06-09days on market $69,000 Active 136 DOM
-
2026-06-08days on market $69,000 Active 135 DOM
-
2026-06-07days on market $69,000 Active 134 DOM
-
2026-06-07days on market $69,000 Active 133 DOM
-
2026-06-04days on market $69,000 Active 130 DOM
-
2026-06-02days on market $69,000 Active 129 DOM
-
2026-06-01days on market $69,000 Active 128 DOM
-
2026-05-31days on market $69,000 Active 127 DOM
-
2026-02-18status Active 386-char remark
Show marketing remark (366 chars)
3 Bedroom, 1 Bath, 1 1/2 Story Home. Bedroom on Main Floor, Full Bath, Pantry/Laundry Room combo. Upper level features 2 Bedrooms. Front Bedroom has Patio Doors Opening onto a Juliet Balcony. All Electric Home, Large Lot, Sideyard with chained line fence, Full Covered Front Porch, Full Unfinished basement. Seller will provide Occupany certificate prior to closing.
-
2026-02-18status Active 366-char remark
Show marketing remark (366 chars)
3 Bedroom, 1 Bath, 1 1/2 Story Home. Bedroom on Main Floor, Full Bath, Pantry/Laundry Room combo. Upper level features 2 Bedrooms. Front Bedroom has Patio Doors Opening onto a Juliet Balcony. All Electric Home, Large Lot, Sideyard with chained line fence, Full Covered Front Porch, Full Unfinished basement. Seller will provide Occupany certificate prior to closing.
-
2026-02-05status Pending 386-char remark
Show marketing remark (386 chars)
1 1/2 Story 3 Bedroom, 1 Bath Home. Bedroom on Main Floor, Full Bath, Pantry/Laundry Room. Upper level features 2 Bedrooms-one has Patio Doors opening onto a Juliet Balcony. All Electric Home, Baseboard Heat, Large Lot, West Side yard has chain link fence, Full Covered Front Porch, Full U/F Basement. Seller will provide Occupancy Certificate prior to Closing. More photos coming soon.
-
2026-01-12$69,000 Active 366-char remark
Show marketing remark (386 chars)
1 1/2 Story 3 Bedroom, 1 Bath Home. Bedroom on Main Floor, Full Bath, Pantry/Laundry Room. Upper level features 2 Bedrooms-one has Patio Doors opening onto a Juliet Balcony. All Electric Home, Baseboard Heat, Large Lot, West Side yard has chain link fence, Full Covered Front Porch, Full U/F Basement. Seller will provide Occupancy Certificate prior to Closing. More photos coming soon.
-
2026-01-12$69,000 Active 386-char remark
Show marketing remark (386 chars)
1 1/2 Story 3 Bedroom, 1 Bath Home. Bedroom on Main Floor, Full Bath, Pantry/Laundry Room. Upper level features 2 Bedrooms-one has Patio Doors opening onto a Juliet Balcony. All Electric Home, Baseboard Heat, Large Lot, West Side yard has chain link fence, Full Covered Front Porch, Full U/F Basement. Seller will provide Occupancy Certificate prior to Closing. More photos coming soon.
-
2024-06-24price $59,900
-
2024-06-24price $59,900
-
2024-05-06price $64,900
-
2024-05-06price $64,900
-
2024-02-22status Active
-
2024-02-22status Active
-
2024-02-06historical
-
2024-01-30price $69,900
-
2024-01-30price $69,900
-
2023-10-12price $74,900
-
2023-09-06$79,900 Active
-
2023-09-05$74,900 Active
-
2008-03-12soldstatus
-
2006-08-28soldstatus
-
1999-04-13soldstatus
-
1997-07-21soldstatus
-
1997-06-23soldstatus
ⓘ Source: listings_history table (triggers on properties + properties_extension) + one-shot
backfill from property_details.listing_events for pre-trigger history.
Tax reassessment forecast MO · Resets to sale price
- Current annual tax
- $355 · $30/mo
- Projected year-2 tax
- $669 · $56/mo
- Expected delta
- +$314/yr (+$26/mo · 88.5%)
ⓘ Screening estimate from a state-policy table — verify with the county assessor before closing.
Climate risk First Street
- Flood 1/10 Low FEMA zone X (unshaded) · 0% chance over 30 yrs
- Wildfire 4/10 Moderate
- Heat 3/10 Moderate 7 d/yr ≥106°F today · 17 d/yr by 30 yrs out
- Wind 2/10 Low
- Air quality 1/10 Low 0 unhealthy d/yr today · 0 by 30 yrs out
Nearby sold comps map
Loading sold comps map…
Walkable amenities ~0.75 mi
Loading nearby amenities…
Taxation est. · year 1
- Rental income
- $13,080
- − Mortgage interest
- −$3,865
- − Property taxes
- −$355
- − Insurance
- −$345
- − Repairs & maintenance
- −$1,046
- − Management
- −$1,046
- − Depreciation
- −$2,007
- Taxable income
- $4,415
- Est. tax owed @ 24.0%
- −$1,060
- After-tax cash flow
- $4,231/yr
For passive investors: Depreciation is non-cash, so a rental often shows a tax loss while cash-flowing — sheltering income. Rental losses are passive: they offset passive income freely, and up to $25,000/yr can offset ordinary (W-2) income if you actively participate and your MAGI is under $100k (phasing out to $0 by $150k); unused losses carry forward. On sale, claimed depreciation is recaptured at up to 25%, and gains may owe capital-gains tax (a 1031 exchange can defer both). Figures are a year-1 estimate at your 24.0% rate — not tax advice; consult a CPA.
Schools (NCES district)
- District
- Moberly
- NCES district ID
- 2921100
- Math proficiency
- 30% ▼ -1.00%
- Reading proficiency
- 36% ▼ -3.00%
- Median HH income
- $36,160
- Composite
- 27.35/100
- National rank
- #6984
- State rank
- #246 of 324 in MO
Livability — Moberly
- Score
- 77/100
- State rank
- #32
- US rank
- #3045
Category grades
Schools grade is shown separately in the Schools card above.
Census & demographics
- Census place
- Moberly, MO
- Population (ZIP)
- 16,762
Population outlook (Randolph County) Hauer SSP2
- Today (2025)
- 24,596 people
- By 2030
- 24,213 · -1.6%
- By 2040
- 23,184 · -5.7%
- By 2050
- 22,081 · -10.2%
- By 2075
- 18,994 · -22.8%
- By 2100
- 15,070 · -38.7%
Race, ethnicity, and origin ACS 2023
- Neighborhood character
- Predominantly White (84%)
- Race & ethnicity
- White 84% Black 7% Two or more races 6% Hispanic / Latino 3%
- Common ancestry
- Italian 2% Lithuanian 2% Iranian 1%
- Foreign-born
- 1% · Canada
- Languages at home
- 98% English-only · Spanish 1%
Political lean MEDSL · Randolph
- 2024 margin
- Solid R (+52.2) · D 23.3% · R 75.5% · Other 1.2%
- 2008→2024 swing
- -28.9pp toward R · 2008: -23.3pp · 2024: -52.2pp
- All cycles
- 2024: R+52.2 2020: R+51.5 2016: R+50.9 2012: R+36.6 2008: R+23.3
Not yet ingested
- Civics
- —
Market trends
- HPI YoY
- ▼ -88.15%
- Current HPI
- 199.9743
- Rent YoY
- —
- Metro
- —
- State GDP YoY
- ▲ 1.84%
- F500 in state
- 20
Industry mix (Fortune 500 HQ in MO)
| Industry | F500 HQs | Revenue |
|---|---|---|
| Healthcare | 1 | $163B |
|
||
| Insurance | 1 | $21B |
|
||
| Industrial Technology | 1 | $17B |
|
||
| Retail | 1 | $16B |
|
||
| Industrial Distribution | 1 | $10B |
|
||
| Utilities | 1 | $9B |
|
||
Price history
-7.9% since first listed22 events — show timeline
- 2026-02-18 Relisted — CBORMLS
- 2026-02-18 Relisted — RCBR
- 2026-02-05 Pending — CBORMLS
- 2026-01-12 Listed $69,000 RCBR
- 2026-01-12 Listed $69,000 CBORMLS
- 2024-06-24 Price Changed $59,900 RCBR
- 2024-06-24 Price Changed $59,900 CBORMLS
- 2024-05-06 Price Changed $64,900 RCBR
- 2024-05-06 Price Changed $64,900 CBORMLS
- 2024-02-22 Relisted — RCBR
- 2024-02-22 Relisted — CBORMLS
- 2024-02-06 Delisted — CBORMLS
- 2024-01-30 Price Changed $69,900 RCBR
- 2024-01-30 Price Changed $69,900 CBORMLS
- 2023-10-12 Price Changed $74,900 CBORMLS
- 2023-09-06 Listed $79,900 CBORMLS
- 2023-09-05 Listed $74,900 RCBR
- 2008-03-12 Sold (Public Records) — Public Records
- 2006-08-28 Sold (Public Records) — Public Records
- 1999-04-13 Sold (Public Records) — Public Records
- 1997-07-21 Sold (Public Records) — Public Records
- 1997-06-23 Sold (Public Records) — Public Records
Property tax history
+5.1%/yrLatest (2025): $355 · +15.8% YoY. Source: county tax records.
Cash-flow waterfall
monthlySold comps — $/sqft
last 12 mo · ≤1 miLoading sold comps…